Us30index

US30 WEEKLY ANALYSIS after the accumulation of the price in the zone that I marked there will be either a continuation of the up trend towards the supply zone or a reversal of the price towards the demand zone

DOW JONES 4HDOW JONES
if the next 4 hours are above 33734 that's touche the 33974 and 34052 and 34199 gives
but if under 33734 the direction goes down until it reaches 33491 and 33395 and 33271
The movement range is between 33607 and 33734
resistance price: 33947 & 34052 & 34199
support price: 33491 & 33395 & 33271
timeframe 4H

buy option on the US30with a retracement down to the support and making a reversal it would be a nice buy option so we can take the buy to continue the move up with the trend

US30 LONGAnticipating US30 to reach 34,164 based on careful analysis. Current price at 33,757, entry point at 33,751. Technical indicators and strong fundamentals suggest continued bullish momentum.

US30 Top-down analysis Hello traders, this is a complete multiple timeframe analysis of this pair. We see could find significant trading opportunities as per analysis upon price action confirmation we may take this trade. Smash the like button if you find value in this analysis and drop a comment if you have any questions or let me know which pair to cover in my next analysis.

potential sell option on us30wait the next candle to open and with a bearish close of this candle it will be an interesting sell option when breaking the low of the previous candle

US30 Forex H1Here is my view for US30 on H1. The price could go bearish, you can put a pending order on the Order block or find an entry on LTF within OB Zone. Trade Safe!

US30 21May2023US30 is in line with the strengthening dollar index, still looks bullish according to my analysis. the price had touched the SnD area and was approaching the invalid area and now in my opinion the possibility is heading to sub wave 3.

US30 Top-down analysisHello traders, this is a complete multiple timeframe analysis of this pair. We see could find significant trading opportunities as per analysis upon price action confirmation we may take this trade. Smash the like button if you find value in this analysis and drop a comment if you have any questions or let me know which pair to cover in my next analysis.


potential buy option for US30 with a bullish trend and after it have made a retracement as a triangle it will be a good potential for a buy option after breaking that high

US30 Forex H1Here is my view for US30 on H1. The price could go bearish, you can put a pending order on the Order block or find an entry on LTF within OB Zone. Trade Safe!

Dow Jones (US 30) daily analysis Dow Jones (US 30) daily analysis on a daily chart. The price is currently at an area of confluence. if the resistance level hold we will see the price moving down but if the price break the level , we will be good for a strong buy. Wait for the price action.

Dow Jones (US 30) daily analysisDow Jones (US 30) daily analysis on a H4 chart. Price is currently on a resistance level. if the level hold we will see the price pull back but if not . one will wait for a breakout. only than one can take a buy. if the price level hold wait for the price to break the counter trend line before one can sell as you can see the trend line was respected.

US 30 weekly analysisUS 30 weekly analysis. The price is on a wedge currently that will mean one will have to wait for a breakout before taking a trade. at the very sometime we also see that from the support side the price has now respect the counter trend line for the second time and the closing candle is looking strong if the new candle can break it will be good for a buy but if the resistance level hold we may see the price pushing down. so with all that the is one thing to do wait for a breakout before taking a trade.

US30 | INVERSE HEAD AND SHOULDER | Bullish An inverse head and shoulders pattern is a bullish chart pattern that forms after a downtrend. It consists of three lows, with the middle low (the head) being lower than the two other lows (the shoulders). The pattern is completed when the price breaks above the neckline, which is a trendline that connects the high points of the two shoulders.
On the other hand, the CURRENCYCOM:US30 US30 chart a pattern of lower lows and lower highs is typically associated with a downtrend, as each subsequent low and high is lower than the previous one. This suggests that the market is making lower lows and failing to make new highs, indicating a lack of buying pressure.
It is important to note that technical analysis is just one tool in investing and should be used in conjunction with other forms of analysis, such as fundamental analysis and risk management strategies. It is also important to remember that past performance is not necessarily indicative of future results, and investing always carries risk.
Follow For more Ideas.

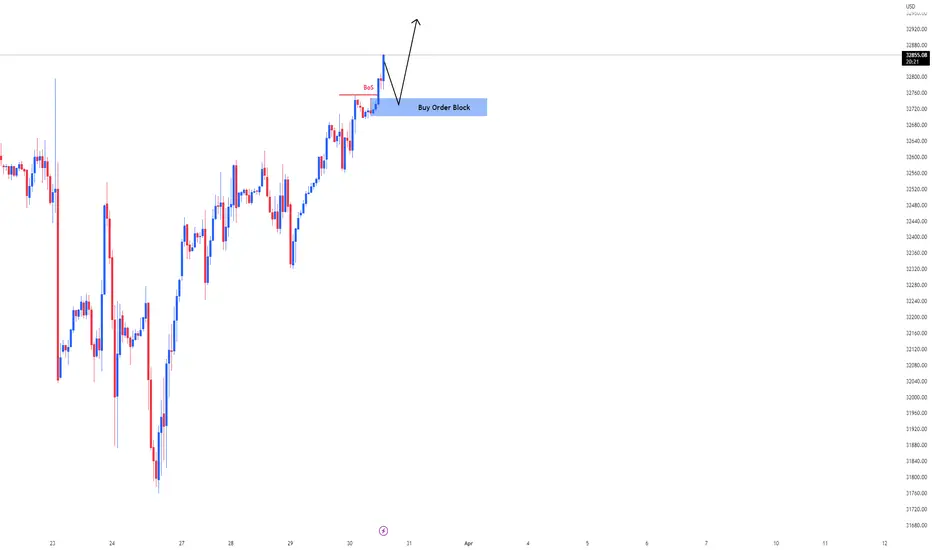
US30 H1Here is my view for US30 on H1. The price could go bullish , you can put a pending order on the Order block or find an entry on LTF within OB Zone. Trade Safe!
US30 D1Here is my view for US30 on D1. The price could go bearish, you can put a pending order on the Order block or find an entry on LTF within OB Zone. Trade Safe!

#US30- NEXT POSSIBLE BUYING ZONEHappy Trading, US30 dropped significantly in last few weeks due to very obvious economic and goverment policies. For us we have next very possible entry on #us30 if the prices falls to our region a risk entry would be worth it. Do your own research and then agree with the idea. If everything goes well we will see a nice short term buying opportunity.
Good Luck and Your support is always appreciated.

US30 is going to land On the daily timeframe US30 was not able to hold its support level of 32505, thus broke it and now waiting for either retest the zone or directly land towards the support zone of 30205

US30-Long-what do you all think ?Dear Traders, US30 we have surpassed the distribution phase and right now we have solid platform of price structure to go long. An ideal entry would be at retesting the future OB after breaking the previous HIGHS were price failed to break. US30 in our opinion is bullish long term and our current target is 36000!
Comment down your views!!

US30 top-down analysisHello traders, this is a complete multiple timeframe analysis of this pair. We see could find significant trading opportunities as per analysis upon price action confirmation we may take this trade. Smash the like button if you find value in this analysis and drop a comment if you have any questions or let me know which pair to cover in my next analysis.
