Continuation pattern on us30 to the bearish moveafter breaking the symmetrical triangle down this will be a great potential to continue the move down for a sell option.
Us30index

Dow Jones (US 30)Dow Jones ( US 30) daily analysis on 1H chart. The price is currently moving down, it therefore needs one to wait for the price to push up and reject before one can take a sell position.

Dow Jones (US 30) Dow Jones ( US 30) daily analysis on 1H chart. The US 30 is given us a fails breakout as we see the price moving down again. This is putting us back into the bear market , which means that we have to look for selling opportunities more than buying opportunities.

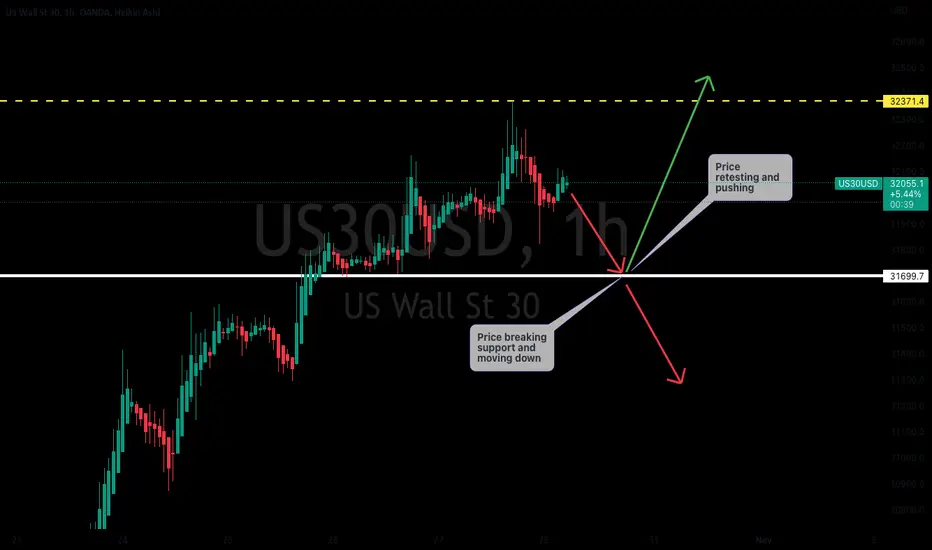
Dow Jones (US 30)Dow Jones (US 30) on the weekly analysis on 4H chart. The market is currently moving up and the price has break the resistance. The price maybe retesting before pushing up.

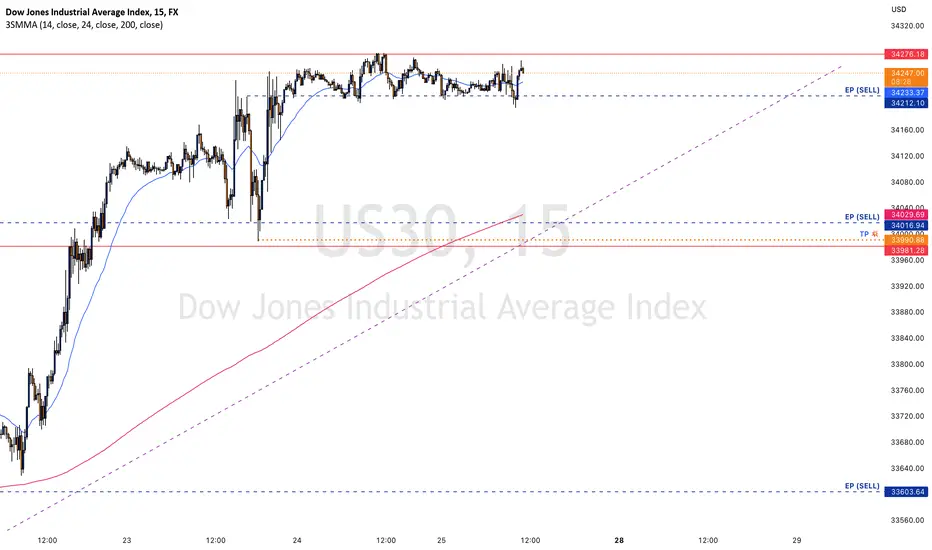
US30 (High Probability SELL Setup SOON)Here we can see in M15 chart, US30 has touched a major resistance level of 34276, which forms a strong resistance level in D1 chart, we've got our EP & TP,
keep a close eye on US30 today,
Happy pip hunting traders.
Dow Jones ( US 30) Dow Jones ( US 30) daily analysis on 1H chart. The market will be affected today due to the Thanksgiving in USA. Price maybe moving very slow so keep that in mind whenever you take a trade. Price is still keep moving up.

US30 top-down analysisHello traders, this is a complete multiple timeframe analysis of this pair. We see could find significant trading opportunities as per analysis upon price action confirmation we may take this trade. Smash the like button if you find value in this analysis and drop a comment if you have any questions or let me know which pair to cover in my next analysis.

Dow Jones (US 30)Dow Jones (US 30) daily analysis on 1H chart. The market is currently moving up. As for the structure is bullish. The price is to move down to test the support level before moving up.

Dow Jones (US 30) The price has breaken the trendline that has hold for 8 months. If the price can break the level 33967.2 and close above, we will see the price moving up strong, but if the price hold at level 33967.2 we may see the price going down. If you need to a buy wait for the price to break before...

Dow Jones (US 30) Weekly AnalysisDow Jones (US30) weekly analysis. The price has breaken the 8 months trendline and we have seen the price playing above the trendline. we are now waiting to have a clear direction, if the price is going to push up or going down?
For more analysis, you can check my 4H chart analysis after this one.

#US30 #DowJones $DJIA #forex #US30 #DowJones $DJIA #trading
- ALT BAT Pattern 🦇
- Daily Frame
- The pattern fails to close the price above : 34765

US30 top-down analysisHello traders, this is a complete multiple timeframe analysis of this pair. We see could find significant trading opportunities as per analysis upon price action confirmation we may take this trade. Smash the like button if you find value in this analysis and drop a comment if you have any questions or let me know which pair to cover in my next analysis.

US30 LongThe price has been forming a falling channel for the past few weeks. The lowest low of the trend formed a double bottom , which is an indicator that the trend was to be a bullish move. The price is now at the top trendline of the channel.
I anticipate that the price might continue with the bullish run, and I have 2 possible scenarios of the entry zone. The first is below the current price at around 32200 and the second, at the top of the current price at around 33000.
My position will be at 32950, as I am using the pullback strategy to enter my positions hence it will be above the highest high formed.
The other reason as to why I am trading bullish is the current client sentiment of this index is 75% short and 25% long, and we are all aware that the market markers tend to move in reversal of the crowds anticipation. (Look at the Daily Forex website for the clients sentiment data)
My targets are 33500, 34050 and 34600 thus my target R:R is 1: 3.
Remember, risk only 1-2% of your account!

Dow Jones (US 30) Weekly AnalysisDow Jones (US 30) weekly analysis on 4H. The price has breaken the 10 months trendline. we are currently seeing the price trying to retest the new support trendline that I have put on the chart. If the price retest we are going to see the price pushing more to the upside.

Dow Jones daily US 30 daily analysis on 1H chart. The market is bearish and currently moving down after respecting the trendline zone. One can look for selling opportunities more than buying. as the bears are still in control of the market.

Dow Jones (US 30) daily US 30 daily analysis on 1H chart. The market structure is currently bearish and the direction is on a down trend. The price has just breaken the counter trendline to the down side. with this situation at hand it will mean that one should look for selling opportunities more than buying.

Dow Jones (US 30) US 30 daily analysis on 1H chart. The market is still bearish. The price is currently at the trendline. We may see the price pushing to challenge the trendline. if not, the price will move down to confirm that the current move was a correction.

Dow Jones ( US 30) daily analysis US 30 daily analysis on the 1H chart. The market direction is still on the down trend. The price is currently close to our trendline that has been test 3 times. if the price respect the trendline we may see it going down and if not the trendline will be breaken and the price will move up.

Dow Jones Prediction H1Here is my view for US30 on H1. The price could go up, you can put a pending order on the Order block or find an entry on LTF within OB Zone. Trade Safe!

US 30 daily US 30 daily analysis on 1H chart. Market direction is still bearish. We see the price is very close to the trendline that we had for sometime now. If the price respect the trendline we will see it going down and if not it will break the trendline and push up. Wait for the rejection or a breakout.

US 30 weekly analysisUS 30 weekly analysis on 1D chart. Based on the structure of the market. it is bearish and the current move is a correction. If the price respect the trendline as it has done before we will see the price going down very strong, but if the price break the trendline, a new structure may be formed and giving us a bull market. One need to wait for the confirmation before acting in buying or selling.

US30 possible sell zone!US30 4H has primarily rejected monthly resistance with a long wick candle creating a lower high with a monthly resistance level. As the long-term price action is bearish, it is a high probability that upon rejection from the long-term resistance US30 will drop to the nearest support level. Upon rejection and price action confirmation, we may have a selling opportunity!
Press the like button if you enjoy this content :)

US 30 daily analysisUS 30 daily analysis on 1H chart. The overall market is still bearish and the price is on a correction move. The price may make a move to the down to retest the support level or it will break it and move down.