Us30long

US30 : Intraday Technical AnalysisUS30 Intraday Technical Analysis:
As mentioned yesterday the US30 is going to test the support of 33000 before making a new move. The US30 took support from 33000. My idea for intraday is to take entry at the support of 33000 with target goal of the resistance of 33300 and 33600 for intraday.
If you like this or if you think the opposite of this or if there is any other opinion, mention it in the comments. I am open to all kind of suggestions and critics

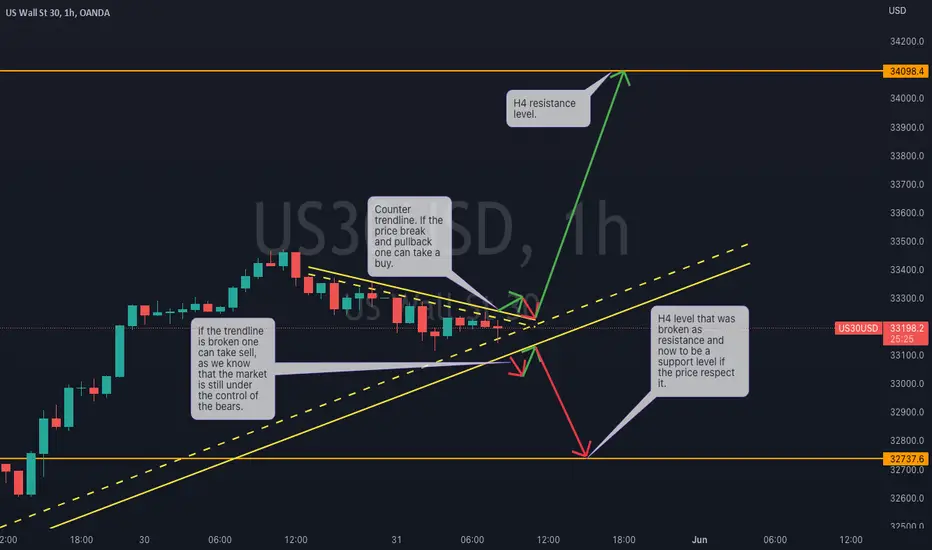
My analysis of the day on H1 chart for US 30The market seems to be respecting the trendline, that will only be confirmed once the counter trendline is broken and the price push to the upside at this point is to see as to where the price will push to.
US30 : Intraday Technical Analysis
As today is holiday in USA, the US30 is not expected to make a significant move. My idea is that US30 will remain in a choppy trend today. US30 will sustain the 33000 level. My idea is to wait for tomorrow until the market opens properly.
If you like this or if you think the opposite of this or if there is any other opinion, mention it in the comments. I am open to all kind of suggestions and critics


US30Hello Traders and subscribers.... #US30 has seen a decent drop recently due to inflation and interest rate hike by the feds. But last week it broke out of a major falling trendline that has served as resistance.. Hence, it has been creating higher highs and higher lows.. Right now it has gotten to a supply zone where I expect a little pull back before it continues growing.

US30 Outlook! Let me know your thoughts! US30 - broke structure to the upside on the Daily, looking for price to continue bullish towards the .886 of the shark before dropping and swiping the liquidity it's been building for the past week, before continuing up towards the supply, consolidating before breaking above to the next D point of the shark the 1.13 before returning to previous broken supply using it as demand to push to the final weekly demand zone/swing high to clear all previous imbalance before potentially continuing down!
This is just an outlook, would love to see your ideas too!

DeGRAM | US30 longLast week, we predicted that US30 was going to move to higher levels.
Price broke and closed above the resistance zone, which now became a support.
Price action has created a nice swing zone from which the price may soon bounce off upwards.
-------------------
Share your opinion in the comments and support the idea with like. Thanks for your support!

LONG US30Price broke a major resistance area with momentum.
Has not quite did a major retest of the zone as new support, but price action looks pretty good so far for this index to boom.

US30 : Intraday Technical AnalysisAs I mentioned in yesterday’s analysis . only long positions are recommended on US30. Currently Us30 is trading near level of 32800 after getting rejection from 32900. My idea is that the US30 is going to try to break 30DMA at 32721. If succeeded then we can expect 34000 level in coming week , Otherwise we can expect rejection from this level. My idea is to wait for today and see how the price action of US30 moves and take entry on Monday.

US30 LONGOANDA:US30USD
A cup and handle pattern forming on US30 breaking resistance for a bullish setup on US30.


US30 Long Hello ,We broke and Resistance if we had pullback and after that good candles we can open buy possession

Short From Daily Supply?US30 - Beautiful looking Daily continuation coming up, looking for a spike into the HTF supply around NYSE open before a break of the momentum and for price to head towards the lows!
Let me know your thoughts!
* Disclaimer **
These ideas I never trade until the end target with my initial lots, I focused on high probable entries with higher lots and use a specific partial taking strategy giving me a very high win rate and take most of my profits very early, I only leave a small % of my capital to run the entire trade. On the flip side im constantly monitoring LTF momentum and will close early if things change, these analysis's are for research purposes only.

US 30: Intraday Technical AnalysisThe US30 once again took rejection from 32200. My idea is that the price is going to test the adjacent supports from where long positions can be taken. My goal is to enter after confirmation of supports near 31600 and 31200 with the goal of target resistance of 32000.
If you like this or if you think the opposite of this or if there is any other opinion, mention it in the comments. I am open to all kind of suggestions and critics

US 30: Intraday Technical AnalysisUS30 took rejection from 32000 twice. My target is long position only after supports of 31600 and 31200.
US 30: Intraday Technical AnalysisAs mentioned yesterday the price was expected to test supports from where long positions were recommended with targets of 31600 and 31900. The price took support from 31400 instead of 31200 from where long positions were taken and both targets of 31600 and 31900 were achieved. The price is expected to continue the upward momentum today. My target is to wait for the price to test the supports of 31600 and 31200 from where my goal is going to be the resistance of 32000.
If you like this or if you think the opposite of this or if there is any other opinion, mention it in the comments. I am open to all kind of suggestions and critics
Channel Break To The Upside?US30, Daily failed to close below previous structure & we have a nice change of character on the 4H, I really want to see this channel break out to the upside, we have an unmitigated zone down in the lower demand (Which price could target before this move potentially happens just above the gap that's not completely filled yet)
Will be trading this in both directions on the LTF!
Let me know your thoughts!
* Disclaimer **
These ideas I never trade until the end target with my initial lots, I focused on high probable entries with higher lots and use a specific partial taking strategy giving me a very high win rate and take most of my profits very early, I only leave a small % of my capital to run the entire trade. On the flip side im constantly monitoring LTF momentum and will close early if things change, these analysis's are for research purposes only.

BUY LIMIT US30BUY LIMIT @31050
STOP LEVEL @30590
TAKE PROFIT @32,700
Note: If pending order hit so hold otherwise don't enter right now because market is not stable.
use proper account management. Good luck.


US30 : Intraweek Technical AnalysisAs I said in previous week’s intraweek technical analysis of US30, the price is going to test the support of 31200 before more any clear trend. the price did tested the support of 31200, before that the price made a false breakout extending to 32600. But ultimately the US30 lost almost all of its gains after disappointing financial results from leading retail store companies like ross and target pulled the index down. US30 made a false breakdown way below 31200 upto 30600. From where we saw huge buying volume.
In coming week we have financials of the following giants along with other companies Zoom, Intuit, Trip.com , NVIDIA (25th may 22) ,Alibaba and Baidu.
My idea is that US30 will remain in stress until all the financials are announced. My idea is entry below 31000 for long positions after a pull back is confirmed and entry at 31600 after a rejection is confirmed.
If you like this or if you think the opposite of this or if there is any other opinion, mention it in the comments. I am open to all kind of suggestions and critics
DeGRAM | US30 longAs we predicted last week, the price of US30 fell from the 32700 level.
There is some buying pressure present. We can see a false break of the 31250 level.
Price might retest previous resistance zones.
-------------------
Share your opinion in the comments and support the idea with like. Thanks for your support!

Waiting for confirmation...US30 - Waiting to see what price does, currently in a PRZ but looking like it's going to break that level and head up to the next supply zone, SPX looking bullish too (Failed to break the previous low), let's see, waiting for confirmations, ideally looking for sells today after the HTF BOS yesterday, if price breaks down and we get failed lows/breaks up rejects from current supply i'll be looking for buys too.
Let me know your thoughts!
* Disclaimer **
These ideas I never trade until the end target with my initial lots, I focused on high probable entries with higher lots and use a specific partial taking strategy giving me a very high win rate and take most of my profits very early, I only leave a small % of my capital to run the entire trade. On the flip side im constantly monitoring LTF momentum and will close early if things change, these analysis's are for research purposes only.
