US 30 daily analysis on H1 chart.This is my daily analysis on US 30 on H1 chart. The market is currently going short.
Us30setup

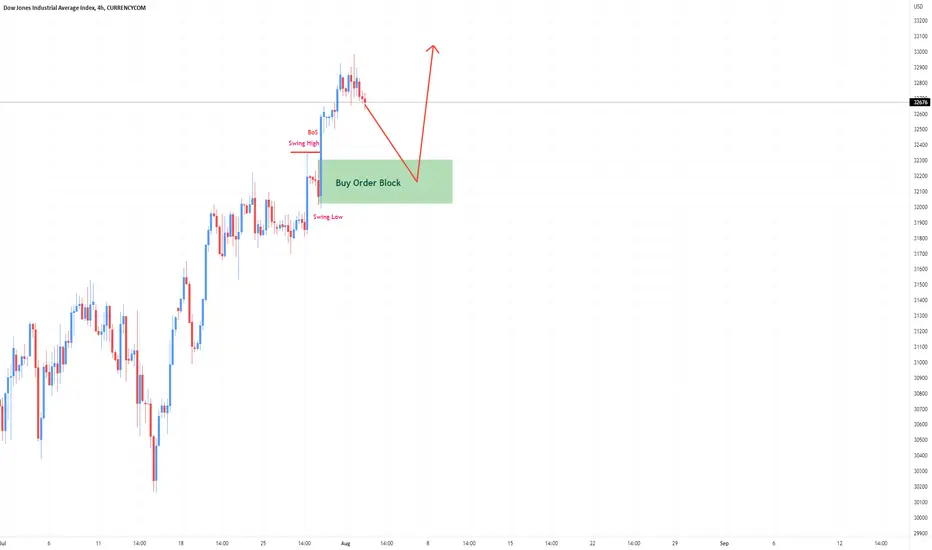
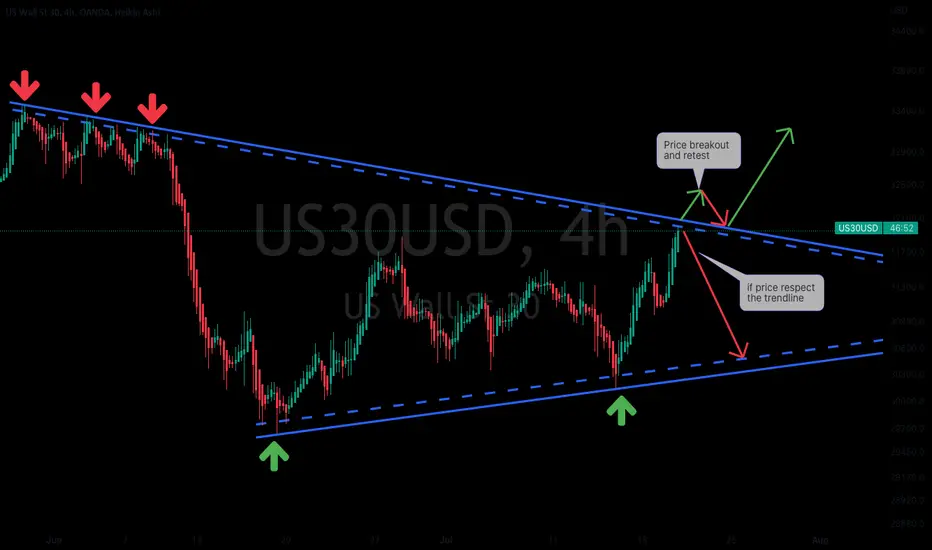
US30 Idea H4Here is my view for US30 on H4. The price could go up, you can put a pending order on the Order block or find an entry on LTF within OB Zone. Trade Safe!
US 30 daily analysisMy us 30 daily analysis. The price is currently at the resistance level and that resistance is in line with the daily timeframe. we may see the price moving down.

US 30 daily analysisMy daily analysis on US 30 on H1 chart. The price is at a resistance level, therefore we may see two things taking place. 1) price moving down to retest the support level or breaking it and pushing down, as we are still in the bear market. or 2) we will see the price pushing up and breaking the resistance. We just need to wait for one of the two.

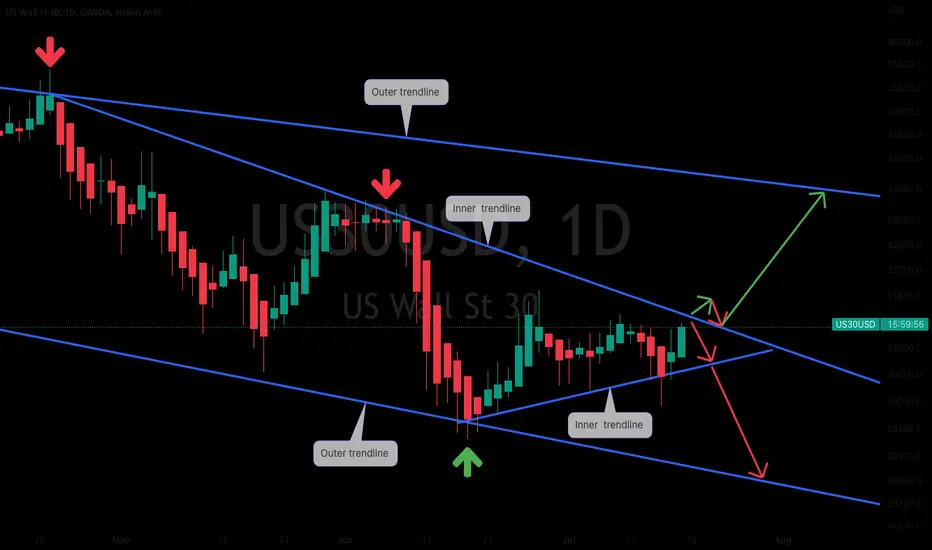
US 30 Weekly AnalysisMy US 30 weekly analysis. The price is currently around the resistance level. The are two thing that may take place 1) price could push to the up and breakout of the trendline or We will see the price rejecting and pushing down as the market is still bearish,

US30 updated analysisUS30 is in a local uptrend for this entire month. As the monthly candle closed as a bullish candle, we could potentially see a further uprise to the monthly Doji or liquidity zone. As the support shown is daily 20EMA and previous resistance where possible buy opportunity may arise.
Press the like button if you find value in this analysis : )

US30 is in buy zone!!US30 is in local uptrend and the price is almost nearing the monthly liqidity zone. Price action is highly bullish and high probability that price will continue to rise up to the monthly doji zone. Current price action on 4H is highly bullish and likely to rise to the resistance.
If you like this analysis, press the like button.

US30 (Dow Jones) Sell SetupFOMC and GDP numbers for Q2 loom large next week. With an interest rate hike, coupled with a higher than expected number for the GDP, a risk off environment will kick off, sending the USD pushing higher and the markets will begin a bear leg.
* The US will be in a technical recession if those numbers come in higher than expected, as this would make it two quarters in a row with bad GDP numbers.
* If price breaks the high of the SZ, then the setup is invalidated.
Feel free to drop a comment, and let me know if you agree or disagree, and let me know why.
Drop a LIKE if you're picking up what I'm putting down! ; )

US30 Idea H4Here is my view for US30 on H4. The price could go up, you can put a pending order on the Order block or find an entry on LTF within OB Zone. Trade Safe!

US 30 daily analysisMy daily analysis on US 30 on H2 chart. The price is currently at the resistance level. The may move down for a retest or it will move sideway before pushing up and break the resistance. We therefore need to wait for a breakout or a retest before one can make a move in the market.

US 30 daily analysisMy daily view on US 30 on H2 chart. The price is currently at the resistance level. It may move down to retest the support before it push up or we may see the price breakout of the resistance and push up.

US 30 daily analysisMy daily analysis on US 30 on H1 chart. The price is currently on a triangle. One will need to wait for the breakout before acting in it.

US 30 daily analysis My daily analysis on US 30 on H1 chart. The price is currently moving sideways. we need a Clare move to know if we have a buy or sell.

US 30 daily analysis My daily analysis on US 30 on H1 chart. The market is still bearish. The price is currently moving sideways. we need to wait for a breakout before we can take action.

US 30 weekly analysis.My weekly analysis on US 30 on daily chart. Market direction is bearish. The price is making a move towards the resistance level. once is to wait for the reaction at the resistance if the price will breakout or reject before taking a trade.

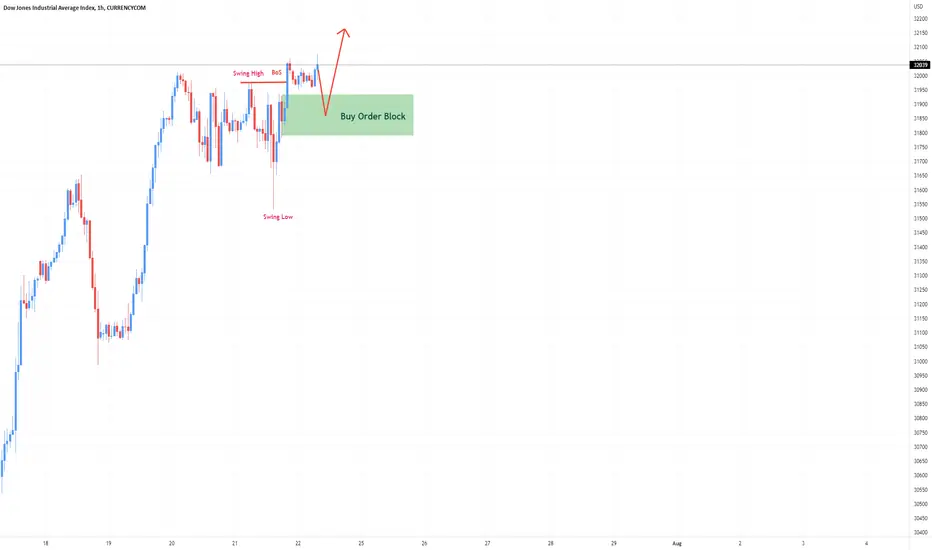
US30 Chart H1Here is my view for US30 on H1. The price could go up, you can put a pending order on the Order block or find an entry on LTF within OB Zone. Trade Safe!
US 30 daily analysisMy daily analysis on US 30. Looking at H1 chart. The price will either push to the up and break the trendline or it will move back down. Let us wait for a breakout on one of the two sides.

US 30 on H4 chart My daily analysis on US 30 on H4 chart. The price is at the resistance trendline. Two things that may take place at this level. 1) the price can reject and move down or 2) we will see a breakout.
US30 Idea H1Here is my view for US30 on H1. The price could go up, you can put a pending order on the Order block or find an entry on LTF within OB Zone. Trade Safe!

US 30 daily analysis.My daily analysis on H1 chart. The market is still bearish. If the price can retest the level 31321.4, we will see a strong sell off.

US 30 Daily Chart My analysis on daily chart. The market is still bearish. all the analysis are done within a down channel.
US30 ( HIGH PROBABILITY BUY SETUP SOON )On Wednesday, U.S. stocks closed in negative territory for a third time this week as the year over year inflation rate increased by a higher percentage than previously expected. The Dow Jones Industrial Average fell 208.54pts (-0.67) to 3077.
Here we can see clearly the next move for US30, baring in mind it's a quick scalp as we're still in a bearish markets & wer're using higher time frame for a clearer view of our analysis,
we've got our EP (blue line) & our TP's (golden line), keep a close eye on US30, U.S. & the world's top 30 companies.
Happy PIP hunting traders.

US 30 daily analysis on H1 chart.This is my daily analysis on US 30 on H1 chart. The market is still bearish and we're currently on a channel that is moving down. one can wait for a breakout before taking any trade.
