potential short on US30 - RSI shows that there is space to move up before a drop
- hopefully price can tap into my POI so we can find an entry before a drop
- ive been looking for a short on this for a while but have changed my POI as price moved up but couldnt quite reach the old POI
let me know what you think is next for US30
Us30short

US30 SELL ANALYSISLooking at US30 on M30 Timeframe
Price has broke the market structure
Upon retest on the OB we should see a rejection and look for a potential Sell

US30 Scalp Idea-SELLSLooks like my previous chart analysis is coming into play. Price looks like it is making another bearish move before market open. Always wait to see if candles break structure for a probability to retest zones.
1.Price is currently in a range
2. If price breaks and closes below 35445, it can possibly retest 35330
3. If price breaks and closes above 35610, it can continue bullish

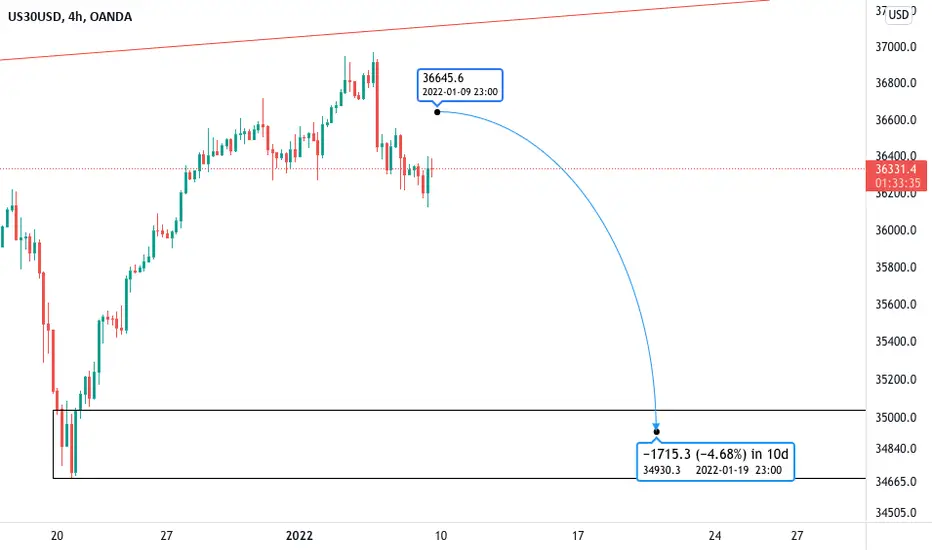
Short swing on US30- Longer term play with a overall move of around 5% - 6%
- Taking profits on the way (they are marked on the charts)
- chart looks a bit messy on the hourly, but makes more sense on LTF

Forecast: Dow Jones US30 Prediction Forecast: Dow Jones US30 -
* All lines: indicates my sell entries
* Curves: The prediction flow - ( Follow the curves :)
Note: - I'm not trying to be Nostradamus, but I've been milking this trade for a while - thought I'd share with you. Trade with caution

US30 30 min breaks February 1Follow the 30 minute breaks of support and resistance , this is a scalping strategy created by Edwin Gonzalez. I have no bias on the market as I create the chart I trade what I see and react to it. Simple explanation of the strategy is to look at the 30 minute chart look at the direction where the candle closes above or below the line , take the trade on that direction. I cant stress this enough , this is a scalping strategy as soon as I see blue I put my SL in profits. Rinse and Repeat.
*** I update my charts every night and in the morning to confirm the S And R ***
-The strat is for the 30M chart.
-Edwin usually sends over the charts already marked up.
-The Support and resistance lines are based off of the 1D, 4H, and 1H charts.
-This is a market structure strat so you'll want to make your trade decisions based on how the market is trending and using the S/R lines provided


Potential Deep Crab 🦀Potential deep crab forming, looking for a bearish push down to the last S/D zone before a bullish rise towards the D point, (looking to take this short then long on the Intraday) But it all depends on the LTF momentum/PA!
* Disclaimer **
These ideas I never trade until the end target with my initial lots, I focused on high probable entries with higher lots and use a specific partial taking strategy giving me a very high win rate and take most of my profits very early, I only leave a small % of my capital to run the entire trade. On the flip side im constantly monitoring LTF momentum and will close early if things change, these analysis's are for research purposes only.

US30 / Potential LongsFrom what I can see price is ranging in this area, it has broken below support but looks like its going to break back in before retesting resistance or breaking it and continuing this dirty uptrend

US30 15M Chart Swing Trading ZonesPlay the chart with simple rules:
Buy/Sell into entries when the candle completes above "Long Entry", or when candle completes under "Short Entry"
Have small stop losses (10-15 pips) in order to not encounter a fake out (goes above our entry line and goes back down for example)
Play with minimum 2 positions. Once trades hits TP1, change stop loss to break even, making it a risk free trade. If passes TP2, change stop loss again to TP1 to lock in profit if trade goes in reversal. Have tight stop losses to lock in profit, If trade hits TP3, close.
If you do see a reversal (For example going from TP2 short to TP1 short, get into a BUY and have take profit @entry point)
Do not trade in-between the Long Entry, and Short Entry! That's my range, and often it will just stay in there until a break out.
If trade breaks through our TP3, wait for a candle to come back to TP3 and reverse the trade back to Long/Short Entry for maximum profit!

US30 Chart H1Here is my view for US30 on h1. The price should go down, you can put a pending order on the Order block or find an entry on LTF within OB Zone. Trade Safe!

Daily Shark Complete US30! 🦈US30 - Daily Shark Completed with a very nice bounce back into bullish structure, as long as the S/D level holds I'l be looking for buys (With LTF confirmation of course) I am currently in a LTF scalp on here!
* Disclaimer **
These ideas I never trade until the end target with my initial lots, I focused on high probable entries with higher lots and use a specific partial taking strategy giving me a very high win rate and take most of my profits very early, I only leave a small % of my capital to run the entire trade. On the flip side im constantly monitoring LTF momentum and will close early if things change, these analysis's are for research purposes only.

Short US30Please see the chart for more details on SL/TP I am taking a sell position with 3% risk on this short position.

US30 ShortHey traders, in today's trading session we are monitoring US30 for a selling opportunity around 34100 zone, once we will receive any bearish confirmation the trade will be executed.
Trade safe, Joe.

Top 4 Currencies & Us 30 Trade Swing Ideas This WeekHi Forex Traders. I’m analyzing my forex price charts, and I see a few great opportunities on the rise for you. While I may see these as good setups, please be sure you construct your own analysis to decide your entry and exit points.

DOW JONES LONGS 📉📉📉Expecting bullish price action on this index as price made a draw on liquidity taking out stops below 34000 a big instituional figure, we had a nice bullish closure above with high momentum, in the mid-long term perspective i think we are going for the W1 and later for the ATH's.
All of this can change tomorrow due FED meeting.
What do you think ? Comment below..


30K Dow jones (US30)It has been long overdue for a market correction. I'm looking in the 30k area and below for the reaccumulation to continue higher.

US30 Day Chart Analysis Trading Zones!Play the chart with important rules:
My Daily chart trades are different compared to my 15M chart trading zones. For my daily chart trading zones, we play this in-between the ranges (in-between the "Long Entry" and "Short Entry") to make money until a breakout occurs. If the candle wicks up and hits the Long Entry line (the orange line) we get into a sell position until it goes to our short entry, the Long Entry has strong resistance, and has a higher chance of not breaking through. BUT, if the candle starts to break through our long entry, around 30-50 pips, reverse the trade and get into a BUY. Ride the trade to our TP1, and place tight stop losses to lock in profit if it wicks down. Same goes for TP2, and TP3, keep changing your stop losses tighter to keep locking in more profit to insure you get as much profit as you can with minimal risk.
Same goes for our Sell Entry line (the blue line) we get into a buy position until it goes to our long entry, the Sell Entry has strong support, and has a higher chance of not breaking through. BUT, if the candle starts to break through our sell entry, around 30-50 pips, reverse the trade and get into a SELL. Ride the trade to our TP1, and place tight stop losses to lock in profit if it wicks up. Same goes for TP2, and TP3, keep changing your stop losses tighter to keep locking in more profit to insure you get as much profit as you can with minimal risk.
Also treat the TP's like TP1 & 2 like our entries, they're major resistance and support areas. For example if the candle hits Long TP2, and hits your TIGHT stop loss that you have in place, get into a sell position and ride it back to TP1, have a tight stop loss once again, and if it doesn't break below TP1, reverse your trade again and get into a buy until TP2! You can keep trading in-between these zones till a break out happens, tight stop losses are important!!

US30 Daily TF Analysis. More Bearish Momentum!Price has been bearish all month. There is a high chance that it can continue to the major level of support. Daily Candle has closed below the 200EMA which indicates that price has a higher probability of continuing its down trend. Whenever candles start printing below the 200EMA, this is usually a sign of a trend reversal. Anticipating a pull back early in the week but then a continuation to 33600. If price breaks the market structure and fails to form support, there could be more bearish momentum heading towards the end of the month and going into February.
1. Price has been bearish all month. There is a high chance that it can continue to the major level of support
2. Daily Candle has closed below the 200EMA which indicates that price has a higher probability of continuing its down trend. Whenever candles start printing below the 200EMA, this is usually a sign of a trend reversal. Anticipating a pull back early in the week but then a continuation to 33600
3. If price breaks the market structure and fails to form support, there could be more bearish momentum heading towards the end of the month and going into February

EURGBP - SHORTs - 01/23-26 2022Scenarios:
"95% probability price will achieve Target Low 33960 "
Will Price Gap down to target Low 33960 ?
Will Price Retrace up to Previous Major Low befor e retesting to go lower to 33960?
Will price marginally retest , then go lower to 33960?

US30Not financial advice.
The essence of investing & trading is the intelligent and patient preying on the greed, fear, impatience, addiction and ignorance of the majority. It's definitionally Darwinian.
US30 Daily TF Analysis-SellsPrice is currently testing a level of support which is also where the 200 EMA. I anticipate that the market will reaction to this level and have a bullish pullback to build momentum for the NY session to retest the lows that were created during the NY session close. As long as price respects the market structure, the analysis should play out. This week the market has been bullish all throughout the London session and pre-NY open. Then in the afternoon 1-2pm Est, the market starts to continue the bearish momentum and takes out all of the bullish movement that was created. My bias is still bearish, its just a matter of waiting for the right time with volume in the market to execute.
1. Daily Candle closed above the 200EMA
2. Price also closed at a strong level of support
3. Structure was broken and price formed a new low
4. Price can possibly pullback during the Asian and London session to retest the support that was broken during today's NY session
*If price breaks and closes below the 200EMA on the daily TF, there is a high probability that the market can continue bearish going into next week.
