Wall Street ShortAfter rebounding from the upper trendline, it seems that this index is forming a rising flag, which IMO is a strong indicator for a bearish momentum.
Based on the previous analysis I had done, I anticipate that the price will complete this pattern at 39000.
Entry position at 40100, Sl at 40600 and TP at 39000
Us30short

US30 More Sells I thinkI think it makes more sense logically for US30 to continue to drop and I do believe it has the means and liquidity to do so.
That being said, I wouldn't attempt to try to trade anything on it as of current because it (like gold) is confusing and chaotic.
I will probably be sitting this one out.
Have a good rest of your day folks!

US500 / S&P 500 Money Heist Plan in Bearish sideMy Dear Robbers / Traders,
This is our master plan to Heist US500 / S&P 500 Market based on Thief Trading style Technical Analysis.. kindly please follow the plan I have mentioned in the chart focus on Short entry. Our target is Green Zone that is High risk Dangerous level, market is oversold / Consolidation / Trend Reversal at the level Bullish Robbers / Traders gain the strength. Be safe and be careful and Be rich.
Note: If you've got a lot of money you can get out right away otherwise you can join with a swing trade robbers and continue the heist plan, Use Trailing SL to protect our money.
Stop Loss : Recent Swing High using 2h timeframe
Warning : Fundamental Analysis comes against our robbery plan. our plan will be ruined smash the Stop Loss. Don't Enter the market at the news update.
Loot and escape on the target 🎯 Swing Traders Plz Book the partial sum of money and wait for next breakout of dynamic level / Order block, Once it is cleared we can continue our heist plan to next new target.
Support our Robbery plan we can easily make money & take money 💰💵 Follow, Like & Share with your friends and Lovers. Make our Robbery Team Very Strong Join Ur hands with US. Loot Everything in this market everyday make money easily with Thief Trading Style.

US30USD Bearish Pattern FormationI think that the bullish run is over and we have witnessed the formation of a rising flag, which IMO, looks like more of a bearish setup to me. (ID Timeframe).
I do anticipate that the bearish run look inevitable and let us dig deeper into the shorter timeframes to get the best position for an entry.

DOW JONES - Long active !! Hello traders!
‼️ This is my perspective on US30.
Technical analysis: Here we are in a bullish market structure from 4H timeframe perspective, so I look for a long position. I expect bullish price action from here as price filled the imbalance and rejected from bullish order block.
Like, comment and subscribe to be in touch with my content!

DOW JONES - Long active !!Hello traders!
‼️ This is my perspective on US30.
Technical analysis: Here we are still in a bullish market structure from 4H timeframe perspective, so I look for a long position. I expect bullish price action as price rejected from bullish order block.
Like, comment and subscribe to be in touch with my content!

US30 shortExpecting an upward push during NY session then later on a downwards trend from that point.

US30 Trade ideaUS30 #dowjones failed to break above that resistance, gave us a double top and also breaking structure followed by a retest.

US30 shortsMonthly;
- Not much can be made of this timeframe.
- June formed an inside bar which shows me indecisiveness
Weekly;
- There is a W formation which has not tested the neckline
- Price formed a bearish candlestick the previous week.
Daily;
- Price broke below the previous low indicating that a bearish pattern has formed
- The last two days have formed major bearish candlesticks
4 hour;
- An evident double top formation with two huge wicks.
- Waiting for the perfect entry to enter the market

US30 shortsFirst of all, there is no clear thesis of where price is headed, however, I believe that confluences are pointing towards price heading lower
Daily;
Price is trapped between 38,850 and 38,550
Can expect a small rejection before price decides where it is headed to.
4 hour;
Price broke above 38,720 yesterday without retesting that region.
I am expecting a retest of that region and I am waiting for price form a sell setup that indicates that price is headed there

Us30 possible sellUsing a break and retest strategy with price action analysis for us30 involves identifying key support and resistance levels and then waiting for the price to break through these levels before entering trades on the subsequent retest.

US30 WEEKLY ANALYSISHello traders here is a setup of US3O as you can see the price has been bullish for the past months and now it has created a bearish flag pattern that signals a bearish reversal you can see also the price has also been respecting the trend lines and it has shown bearish rejection last week. I entered a bearish trade when the price showed me a rejection and now I am waiting for it to drop.

US30USD: Key Insights for NFP FridayGreetings Traders!
Brief Description🖊️:
Currently, on US30USD, I see the potential for a shift into bearish order flow. Price is at premium levels, indicating a possible sell-off from the bearish order block.
Market Analysis📉:
We have observed a bullish narrative throughout the week, with price reaching bullish objectives, including the bearish order block. For a detailed analysis, refer to the linked post:
Things We Have Seen👀:
This week’s bullish price action filled the liquidity void and tapped into the bearish order block.
Now, I am looking for confirmations that the order block will hold and if it does this will indicate bearish price action.
Bearish Targets📉:
The engineered trendline liquidity with sell stops.
Main draw: Daily sell stops.
What's Important Now❗:
This potential move could coincide with tomorrow’s NFP release. If the order block holds, we may see bearish momentum. If not, continued bullishness is likely.
Best Regards,
The_Architect

DJ30 FORECASTThe forecast for the Dow Jones 30 is now leaning towards a bearish trend. Prices are expected to fluctuate between 40050 and 39564. However, if the 4h candle closes below the pivot line at 39,564, the bearish pressure is likely to continue, potentially driving prices down to 39400 and 38825.
Key Levels:
Bullish Line: 39825, 40050, 40285, 40500
Pivot Line: 39564
Bearish Line: 39400, 39075, 38825, 38445

❌Dow Jones is waiting for price correction❌Considering the divergence in most of the main time frames, it is likely that the Dow Jones index will start a correction in the 1 hour time frame soon. Price targets are indicated on the chart.

US30 shortsWeekly;
Price has closed with a very bearish candlestick
The next liquidity zone is 38750
I expect price to head there, but there has to be some orders collected before price goes to the designated region
Daily;
Price has closed below a daily region and retested it on Friday
Price is heading towards 38750 but orders have to be collected first in the new weekly cycle
4 hour;
I believe that price will collect orders at the previous region and then sell off.
Waiting for sell confirmation

US30 Alert: Key Sell Opportunity and Potential Bullish Surge!Greetings Traders!
Brief Description🖊️:
Today, I am focusing on trading the US30, with an interest in taking a selling opportunity to reach the H4 bullish order block.
Things I Have Seen👀:
Liquidity Engineering🔄: Currently, price is engineering liquidity right above the H4 bullish order block using a retail pattern (support zone).
Confirmation Buy Zone🟢: Once the price reaches the H4 bullish order block, I will look to buy against the sell stops (stop losses) upon confirmation.
Bullish Targets📈:
-1st Objective (H1 Buy Stops): Anticipating price having to reach into the H1 buy stops, which is high probable.
-2nd Objective (Daily FVG): Anticipating a minor bullish run to reach and potentially fill the DAILY timeframe Fair Value Gap (FVG).
What's Important Now❗
Time is crucial. I only trade indices during the New York session morning and afternoon due to the favorable volatility. Stay observant for real-time developments.
Stay tuned for a video analysis on the US30.
Best Regards,
The_Architect

us30 low probability setupHello traders this is us30 setup with low probability
the risk i will take 0.25%
i will wait for high probability setups
the system : institutional tactics
if you like my idea hit the like button , follow subscribe and show some love
wish you good luck and good trading

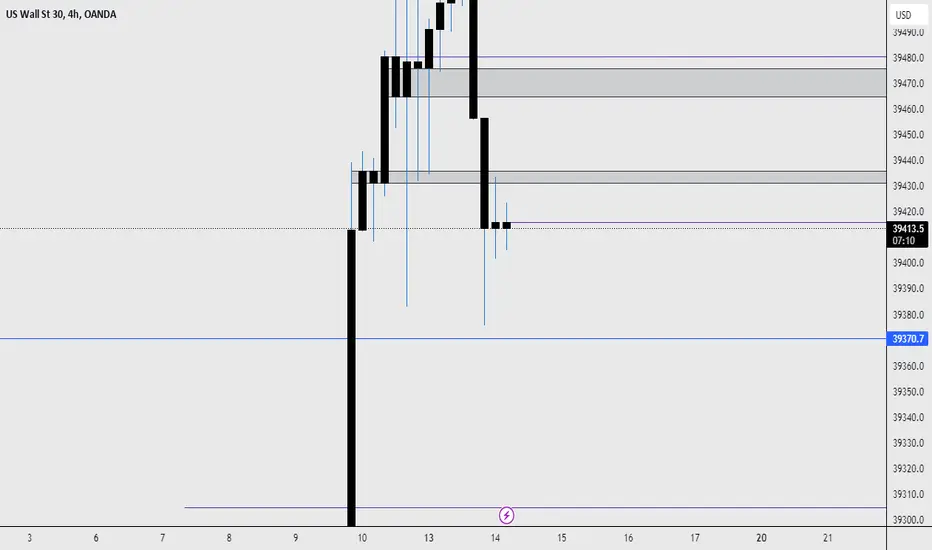
US30 short
Price broke above 38375 daily region
Price is looking to retest that region
There is a three pin pattern on the 4h timeframe
The 3 pin pattern has formed below two liquidity zones
Price retested the 39430 region in the Asia session
Momentum is too weak for now.
Waiting for a solid entry that will make be sell to 39305.
US30 Signal - 06 May NYSEI expect us30 to 38678.
Entry - market price or above 38824
SL - 38864
TP - 38680
Apply proper risk managemet!‼️

US30 BEARISH IDEAIntitutional Strategy/tactics
This is the trade i found after trading
1.5 Risk reward if you like the idea please subscribe for more
hit the like button and show some love
wish you good luck and good trading

Detailed Us30 Insitutional AnalysisHello traders this is my detailed insituional anaylsis for this index
I Will wait for trading setups and share those signals with you
if you like my anaylsis hit the like button and comment and lets share our ideas toghether
Wish you good luck and good trading

US30 PREDICTIONUS30 TRADE PREDICTION
BULLISH SETUP
if you like the idea support please
hit the like button and show some love
wish you good luck and good trading
