US30 - PRE NY SESSION ANALYSIS - 05012022Overall bias coming into the first trading day of the month is still definitely bearish.
I'm looking for price to retrace a bit before getting in on a sell order.
Patiently waiting for signs of exhaustion/reversal near previous structure highs on the lower TFs along with confluence around the 38.2 fib level drawn out which falls in a supply/demand zone.
Happy trading and see you post NY session!
Us30signal

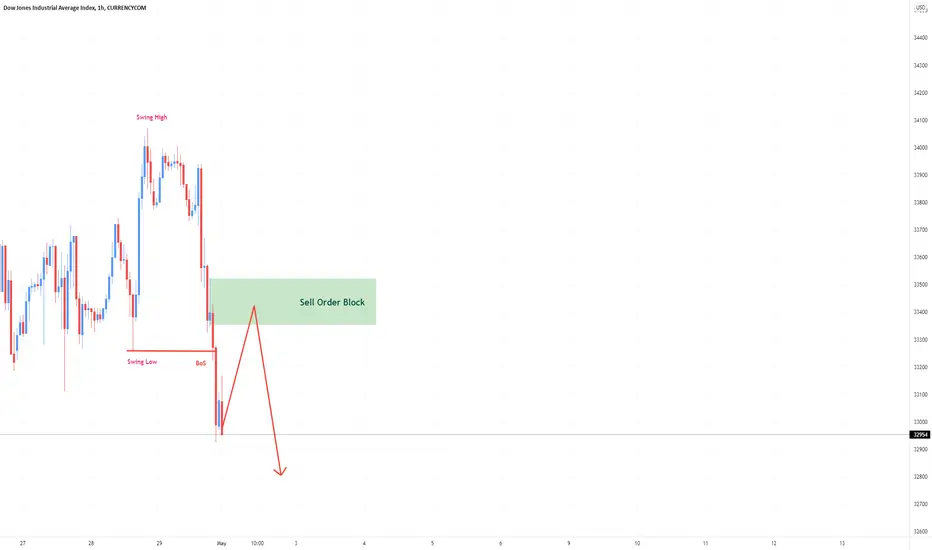
US30 Prediction H1Here is my view for US30 on H1. The price could go down, you can put a pending order on the Order block or find an entry on LTF within OB Zone. Trade Safe!
US30 - POST NY SESSION ANALYSIS - 04292022What an end to the month :/
After my last post, price floated sideways for a couple hours then right after market open at 9:30AM EST price shot up and stopped me out @ 33875 then shot back down to my TP of 33400 and continued pushing down all the way to my previous TPs earlier in the week of 33200 and 32950
I have to say I'm a bit salty about this but I'm just going to add some pepper and keep it cooking.
In retrospect the 2 things I could have done differently here are:
1. Entered the trade during London session - this would have been the absolute optimal time to enter with a ridiculous risk to reward of 1:5 minimum but the only problem with that is I was asleep and usually am at 2AM. So this is probably not feasible to try and adjust much.
2. Once I was stopped out I could have looked for exhaustion and a sign of the bears coming back into the market on the M1 timeframe. I went down to the M5 and M15 after being stopped out but didn't see any big wicks or clear reversal patterns that indicated to me price was going to start dropping. This combined with a strong bullish close on the H1 off a possible 38.2 fib level on a bullish countertrend and I thought I should just let this one go, and I did :/
3. Once price dropped a bit I could have gotten back in albeit at a lower level but at an indication of exhaustion on the M15 which did occur. I was already checked out of the market by this point tbh and not in front of my trade station just tracking on mobile so I called it in for the week.
I learned some valuable lessons this week including the importance of documenting my trades in detail.
I feel that this platform gives me a good place to do this while also sharing my findings and journey with others who are also trying to find their way to consistent profits in this trading game.
With that, I hope to continue doing these pre and post NY market analysis videos for my own journaling and growth as a trader but I also hope that maybe you get some value along the way :)
Have a great weekend, take a break from the charts and refresh.
See you pre NY session on Monday!

US30 - PRE NY SESSION ANALYSIS - 04292022Price pushed back up to approximately 34000 during Asian session and kinda floated sideways during early London session.
There was some nice exhaustion that formed around 2-3 AM which would have potentially made a good entry point but I wasn't awake for that :/
Price now appears to be pushing down retesting recent support of approximately 33800
As of now I'm staying out, I would like to see price push back up to this 34000 - 34200 level and show some signs of exhaustion/reversal before getting in to continue the larger overall bearish trend which I believe is still intact.
We'll see what happens today as this is the final trading day for the month.
See you after NY session!
Good luck!

US30 - POST NY SESSION ANALYSIS - 04282022Interesting movements today.
Price dropped from my entry of 33650 to about 32250
Did not reach my target of 33200 for a 1:4 risk to reward but I was trailing my stop along the way so I secured profits at 33400 when price started to retrace.
Had it not been for trailing my stop I would have gotten stopped out as after price entered that zone in the 33200s it pushed all the way back up to 33900+
The name of the game on this one was proper trade management without a doubt.
Closing out the week and the month tomorrow I still believe the overall bearish bias is still intact.
I am looking for price to push back up to about 34200 which is a previous level of structure and see if it begins to exhibit any signs of exhaustion or countertrend reversal.
If so I will be looking to get in around this 34200 weekly support and resistance level and continue riding the bearish momentum down to my previous target of 33200.
If price breaks above this level it may indicate the beginning of a reversal in the overall bias and possibly consider a short term buy position but that will all depend on the price action over the next few hours in Asian and early London sessions.
See you all pre NY session tomorrow.
Have a good night!

US30 - PRE NY SESSION ANALYSIS - 04282022As anticipated, price pushed back up during Asian and early London session to approximately the 33650 level which appears to be a strong resistance area and the previous structure from the past couple of days.
Price now appears to be reversing and continuing in the overall direction of the bias on larger timeframes which is still definitely bearish in my opinion.
I've entered at approximately 33655 and my TP1 is 33200 targeting the previous structure low from the last couple of days this week.
If it breaks past this TP1 area I will be trailing my stops and targeting 32925 as my TP2 and my TP3 on a larger more swing like trade will be 325925.
No real major US news today or tomorrow so hopefully should be smooth sailing following the volume and overall bearish market bias.
See you after NY Session today!
Happy Trading!

Dow Jones Prediction D1Here is my view for US30 on D1. The price could go down, you can put a pending order on the Order block or find an entry on LTF within OB Zone. Trade Safe!

US30 - POST NY SESSION ANALYSIS - 04272022Not too shabby :)
Price moved exactly as I predicted, dropping down to 33200 before getting pushed back up.
Then it bounced up and down between approximately 33600 and 33200 for the rest of the session.
On the daily we closed weak so I expect price to push back up from it's current level around 33400 retesting the previous highs of the last couple days before the larger overall bearish trend comes back into play.
We will see how the next few hour play out over Asian and early London session.
See you guys pre NY tomorrow!
Have a good night

US30 - PRE NY SESSION ANALYSIS - 04272022After yesterday's drop, price has pulled back to approximately 33600
Showing signs of exhaustion on M5, M15, M30, and H1
This is all occurring between the 38.2 - 50 FIB Levels combined with close proximity to a daily support/resistance level of 33579
I am going to be entering a sell order around 33625 with 100 point stop and targets of 33200, 32925, and 32593

US30 Analysis - 04262022Price is pulling back to the 34000 area however I'm looking for an entry around 34200 roughly
I'm monitoring price to see if it will hit that area and form some sort of exhaustion and/or reversal pattern.

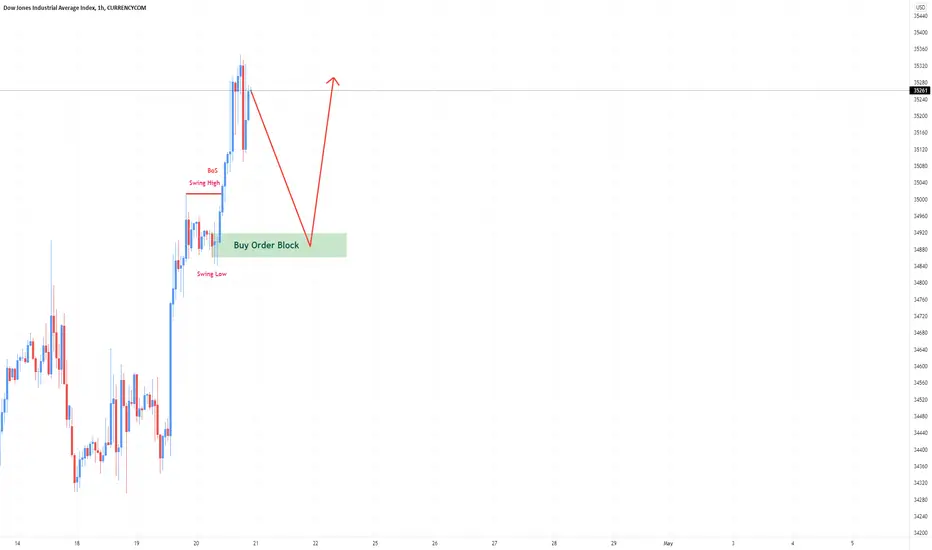
US30 Prediction H1Here is my view foe US30 on H1. The price could go up, you can put a pending order on the Order block or find an entry on LTF within OB Zone. Trade Safe!

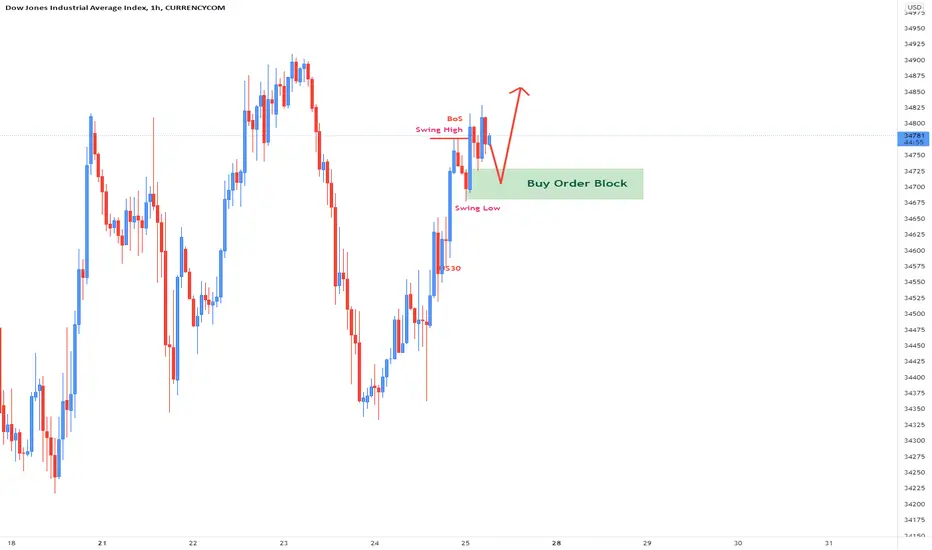
US30 Idea H1Here is my view for US30 on H1. The price could go up, you can put a pending order on the Order block or find an entry on LTF within OB Zone. Trade Safe!

US30 Idea H1Here is my view for US30 on H1. The price should go down, you can put a pending order on the Order block or find an entry on LTF within OB Zone. Trade Safe!

US30 Prediction H4Here is my view for US30 on H4. The price should go up, you can put a pending order on the Order block or find an entry on LTF within OB Zone. Trade Safe!

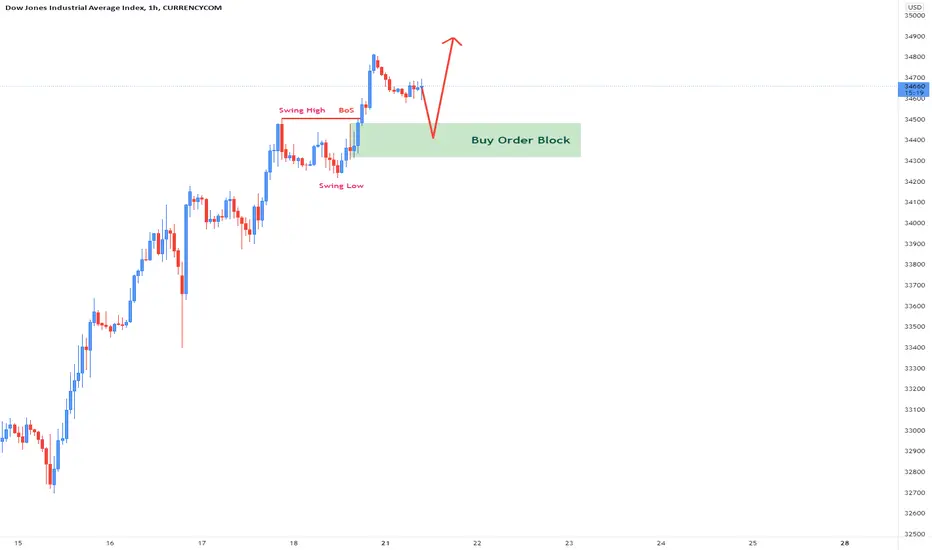
US30 Prediction H1Here is my view for US30 on H1. The price should go up, you can put a pending order on the Order block or find an entry on LTF within OB Zone. Trade Safe!

US30 Prediction H1Here is my view for US30 on H1. The price should go up, you can put a pending order on the Order block or find an entry on LTF within OB Zone. Trade Safe!
US30 Bullish Wedge !!US30 is trading in an uptrend
A bullish wedge pattern has formed
Now, we are witnessing a bullish trend on the bullish breakout and the previous daily resistance at 34277
If it is successful, it will rise and retest level 37000

US30 Prediction H1Here is my view for US30 on H1. The price should go up, you can put a pending order on the Order block or find an entry on LTF within OB Zone. Trade Safe!
US30 Prediction H1Here is my view for US30 on H1. The price should go down, you can put a pending order on the Order block or find an entry on LTF within OB Zone. Trade Safe!

US30 : Ending DiagonalMain pattern : Ending diagonal
Current wave position : wave 4 (triangle)
I see the price will continue the decline to complete wave 5 of ending diagonal.

US30 UP Trend.!#US30 Looking for Buy trade setup as I mentioned in the Chart.!
Keep Supporting LIKE, COMMENT And FOLLOW.!
Thank You.!

DOW JONES LONGS 📉📉📉📈 Expecting bullish price action on US30 (DOW JONES) as price takes out weekly lows and rejects a h4 bullish orderblock area + volume profile poc + institutional figure 33.000. We have a lot of liquidity that has been build on the trendline and price should take it ASAP.
What do you think ?
