Tuesday: US30 - Week 24I will update my idea as the trade progresses if any changes occur and my analysis is wrong, or need to be adapted to the new development of price-action.
Thanks for the support!
-----------------------------------------------------------------------------------------------------------------------
-----------------------------------------------------------------------------------------------------------------------
SMASH that follow button! 👍
💡 Leave a comment and/or message me on how I can improve and provide better content, I'm open to suggestions to create a better experience for you!
RISK DISCLAIMER: Please be advised that I am not telling anyone how to spend or invest their money. Take all of my videos as my own opinion, as entertainment, and at your own risk. I assume no responsibility or liability for any errors or omissions in the content of this channel. This content is for educational purposes only and is not tax, legal, financial, or professional advice. Any action you take on the information in this video is strictly at your own risk. We, therefore, recommend that you contact a personal financial advisor before carrying out specific transactions and investments. There is a very high degree of risk involved in trading. Past results are not indicative of future returns. Inotfancy.com and all individuals affiliated with this channel assume no responsibility for your trading and investment results.
Us30signal
Monday: US30 - Week 24I will update my idea as the trade progresses if any changes occur and my analysis is wrong, or need to be adapted to the new development of price-action.
Thanks for the support!
-----------------------------------------------------------------------------------------------------------------------
-----------------------------------------------------------------------------------------------------------------------
SMASH that follow button! 👍
💡 Leave a comment and/or message me on how I can improve and provide better content, I'm open to suggestions to create a better experience for you!
RISK DISCLAIMER: Please be advised that I am not telling anyone how to spend or invest their money. Take all of my videos as my own opinion, as entertainment, and at your own risk. I assume no responsibility or liability for any errors or omissions in the content of this channel. This content is for educational purposes only and is not tax, legal, financial, or professional advice. Any action you take on the information in this video is strictly at your own risk. We, therefore, recommend that you contact a personal financial advisor before carrying out specific transactions and investments. There is a very high degree of risk involved in trading. Past results are not indicative of future returns. Inotfancy.com and all individuals affiliated with this channel assume no responsibility for your trading and investment results.

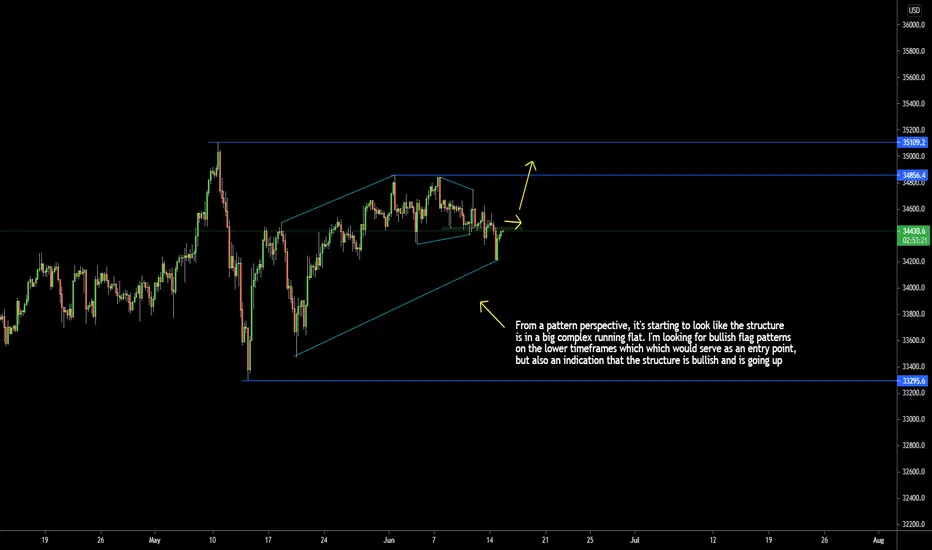
Wednesday: US30 - Week 23Hello Traders! The structure is creating what looks like a bullish flag pattern, watch out for the breakout of that structure to break the top. Trade with care!
I will update my idea as the trade progresses if any changes occur and my analysis is wrong, or need to be adapted to the new development of price-action.
Thanks for the support!
-----------------------------------------------------------------------------------------------------------------------
-----------------------------------------------------------------------------------------------------------------------
SMASH that follow button! 👍
💡 Leave a comment and/or message me on how I can improve and provide better content, I'm open to suggestions to create a better experience for you!
RISK DISCLAIMER: Please be advised that I am not telling anyone how to spend or invest their money. Take all of my videos as my own opinion, as entertainment, and at your own risk. I assume no responsibility or liability for any errors or omissions in the content of this channel. This content is for educational purposes only and is not tax, legal, financial, or professional advice. Any action you take on the information in this video is strictly at your own risk. We, therefore, recommend that you contact a personal financial advisor before carrying out specific transactions and investments. There is a very high degree of risk involved in trading. Past results are not indicative of future returns. Inotfancy.com and all individuals affiliated with this channel assume no responsibility for your trading and investment results.

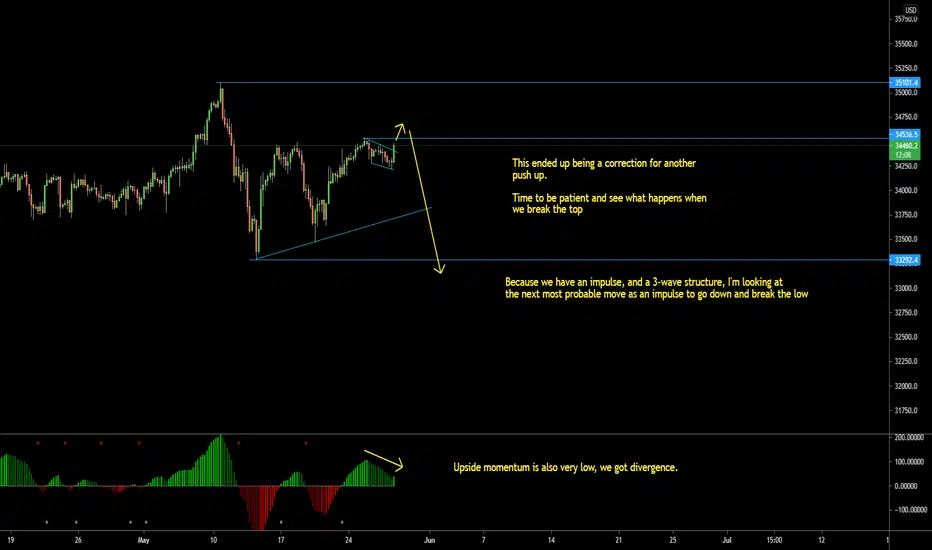
Monday: US30 - Week 23Looks like we are creating another flag-pattern for another impulse to break the top. Be patient and wait for the rejection and, or breakout of the structure. Trade with care!
I will update my idea as the trade progresses if any changes occur and my analysis is wrong, or need to be adapted to the new development of price-action.
Thanks for the support!
-----------------------------------------------------------------------------------------------------------------------
-----------------------------------------------------------------------------------------------------------------------
SMASH that follow button! 👍
💡 Leave a comment and/or message me on how I can improve and provide better content, I'm open to suggestions to create a better experience for you!
RISK DISCLAIMER: Please be advised that I am not telling anyone how to spend or invest their money. Take all of my videos as my own opinion, as entertainment, and at your own risk. I assume no responsibility or liability for any errors or omissions in the content of this channel. This content is for educational purposes only and is not tax, legal, financial, or professional advice. Any action you take on the information in this video is strictly at your own risk. We, therefore, recommend that you contact a personal financial advisor before carrying out specific transactions and investments. There is a very high degree of risk involved in trading. Past results are not indicative of future returns. Inotfancy.com and all individuals affiliated with this channel assume no responsibility for your trading and investment results.

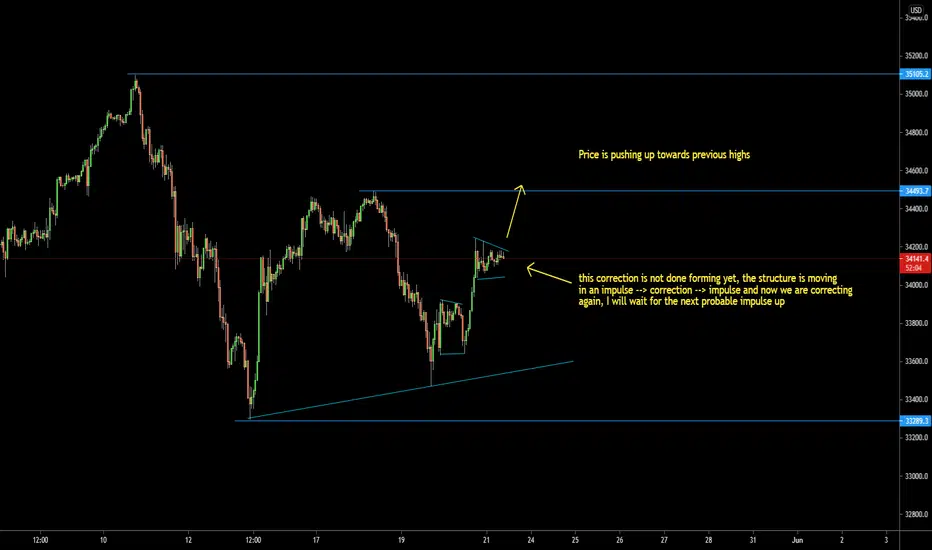
Friday: US30 - Week 22Hello traders, we have been tracking US30 and been looking to sell it. The structure made a nice correction for a sell entry but quickly reversed. The structure is currently making what looks like a sideways correction for 1 more up, but it could also be in the process of making a bigger structure to continue the down move. Check out related ideas!
I will update my idea as the trade progresses if any changes occur and my analysis is wrong, or need to be adapted to the new development of price-action.
Thanks for the support!
-----------------------------------------------------------------------------------------------------------------------
-----------------------------------------------------------------------------------------------------------------------
SMASH that follow button! 👍
💡 Leave a comment and/or message me on how I can improve and provide better content, I'm open to suggestions to create a better experience for you!
RISK DISCLAIMER: Please be advised that I am not telling anyone how to spend or invest their money. Take all of my videos as my own opinion, as entertainment, and at your own risk. I assume no responsibility or liability for any errors or omissions in the content of this channel. This content is for educational purposes only and is not tax, legal, financial, or professional advice. Any action you take on the information in this video is strictly at your own risk. We, therefore, recommend that you contact a personal financial advisor before carrying out specific transactions and investments. There is a very high degree of risk involved in trading. Past results are not indicative of future returns. Inotfancy.com and all individuals affiliated with this channel assume no responsibility for your trading and investment results.

Tuesday: US30 - Week 22Check out related ideas for analysis context!
I will update my idea as the trade progresses if any changes occur and my analysis is wrong, or need to be adapted to the new development of price-action.
Thanks for the support!
-----------------------------------------------------------------------------------------------------------------------
-----------------------------------------------------------------------------------------------------------------------
SMASH that follow button! 👍
💡 Leave a comment and/or message me on how I can improve and provide better content, I'm open to suggestions to create a better experience for you!
RISK DISCLAIMER: Please be advised that I am not telling anyone how to spend or invest their money. Take all of my videos as my own opinion, as entertainment, and at your own risk. I assume no responsibility or liability for any errors or omissions in the content of this channel. This content is for educational purposes only and is not tax, legal, financial, or professional advice. Any action you take on the information in this video is strictly at your own risk. We, therefore, recommend that you contact a personal financial advisor before carrying out specific transactions and investments. There is a very high degree of risk involved in trading. Past results are not indicative of future returns. Inotfancy.com and all individuals affiliated with this channel assume no responsibility for your trading and investment results.

Thursday 2: US30 - Week 21Hello everyone! I'm hoping to reach lots of people here on tradingview and create a community where we all share and help each other in becoming better traders, so please, comment and share your ideas and thoughts in regards to my posts! :)
I will update my idea as the trade progresses if any changes occur and my analysis is wrong, or need to be adapted to the new development of price-action.
-----------------------------------------------------------------------------------------------------------------------
-----------------------------------------------------------------------------------------------------------------------
SMASH that follow button! 👍
💡 Leave a comment and/or message me on how I can improve and provide better content, I'm open to suggestions to create a better experience for you!
RISK DISCLAIMER: Please be advised that I am not telling anyone how to spend or invest their money. Take all of my videos as my own opinion, as entertainment, and at your own risk. I assume no responsibility or liability for any errors or omissions in the content of this channel. This content is for educational purposes only and is not tax, legal, financial, or professional advice. Any action you take on the information in this video is strictly at your own risk. We, therefore, recommend that you contact a personal financial advisor before carrying out specific transactions and investments. There is a very high degree of risk involved in trading. Past results are not indicative of future returns. Inotfancy.com and all individuals affiliated with this channel assume no responsibility for your trading and investment results.
Wednesday 2: US30 - Week 21Check out the related idea link below to understand the market context and why I'm looking for a sell setup.
Hello everyone! I'm hoping to reach lots of people here on tradingview and create a community where we all share and help each other in becoming better traders, so please, comment and share your ideas and thoughts in regards to my posts! :)
I will update my idea as the trade progresses if any changes occur and my analysis is wrong, or need to be adapted to the new development of price-action.
-----------------------------------------------------------------------------------------------------------------------
-----------------------------------------------------------------------------------------------------------------------
SMASH that follow button! 👍
💡 Leave a comment and/or message me on how I can improve and provide better content, I'm open to suggestions to create a better experience for you!
RISK DISCLAIMER: Please be advised that I am not telling anyone how to spend or invest their money. Take all of my videos as my own opinion, as entertainment, and at your own risk. I assume no responsibility or liability for any errors or omissions in the content of this channel. This content is for educational purposes only and is not tax, legal, financial, or professional advice. Any action you take on the information in this video is strictly at your own risk. We, therefore, recommend that you contact a personal financial advisor before carrying out specific transactions and investments. There is a very high degree of risk involved in trading. Past results are not indicative of future returns. Inotfancy.com and all individuals affiliated with this channel assume no responsibility for your trading and investment results.

Wednesday: US30 - Week 21Hello everyone! I'm hoping to reach lots of people here on tradingview and create a community where we all share and help each other in becoming better traders, so please, comment and share your ideas and thoughts in regards to my posts! :)
I will update my idea as the trade progresses if any changes occur and my analysis is wrong, or need to be adapted to the new development of price-action.
-----------------------------------------------------------------------------------------------------------------------
-----------------------------------------------------------------------------------------------------------------------
SMASH that follow button! 👍
💡 Leave a comment and/or message me on how I can improve and provide better content, I'm open to suggestions to create a better experience for you!
RISK DISCLAIMER: Please be advised that I am not telling anyone how to spend or invest their money. Take all of my videos as my own opinion, as entertainment, and at your own risk. I assume no responsibility or liability for any errors or omissions in the content of this channel. This content is for educational purposes only and is not tax, legal, financial, or professional advice. Any action you take on the information in this video is strictly at your own risk. We, therefore, recommend that you contact a personal financial advisor before carrying out specific transactions and investments. There is a very high degree of risk involved in trading. Past results are not indicative of future returns. Inotfancy.com and all individuals affiliated with this channel assume no responsibility for your trading and investment results.

US30 : 33700-34500 scalp range for more days SSI : Above 40%
Trend : Range ( 33700-34500)
Signal : Short Scalp around 34550
Stop Loss : 34720
Target : 33700

US30 - Bullish Opportunities !Welcome to our Trade Setups - May 23th ( US30 ) !
BUY US30
ENTRY LEVEL @ 34263
SL @ 33902
TP @ 34984
Max Risk: 1% - 3%!
Risk/Reward Ratio: 2
Leave us a comment or like to keep our content for free and alive.
Have a great week everyone!

Friday: US30 - Week 20I will update my idea as the trade progresses if any changes occur and my analysis is wrong, or need to be adapted to the new development of price-action.
-----------------------------------------------------------------------------------------------------------------------
-----------------------------------------------------------------------------------------------------------------------
SMASH that follow button! 👍
💡 Leave a comment and/or message me on how I can improve and provide better content, I'm open to suggestions to create a better experience for you!
RISK DISCLAIMER: Please be advised that I am not telling anyone how to spend or invest their money. Take all of my videos as my own opinion, as entertainment, and at your own risk. I assume no responsibility or liability for any errors or omissions in the content of this channel. This content is for educational purposes only and is not tax, legal, financial, or professional advice. Any action you take on the information in this video is strictly at your own risk. We, therefore, recommend that you contact a personal financial advisor before carrying out specific transactions and investments. There is a very high degree of risk involved in trading. Past results are not indicative of future returns. Inotfancy.com and all individuals affiliated with this channel assume no responsibility for your trading and investment results.
US30 trade idea... Update! +493 pips!Congrats to those that held the trade from yesterday!
Bravo!
Drop me a COMMENT/LIKE AND SUBSCRIBE if you like what I'm doing here: getting people to learn and earn!

US30 May 10th 2021 Buy Limit ResultsMissed my entry but did everything I expected. It decided to bounce off a 61.80 level rather than my 71.80 level that had about 10 times more confirmations. This would've been a massive trade had I entered at my initial entry. I did not stress finding another entry because I already had a few open trades and the entry would not be nearly as good so at the time I was okay with letting this trade go. My analysis was perfect for this US30 Long setup anyone could've seen this and found another entry in lower timeframes when it slightly retraced if they wanted to.

US30 - SELL NOW !Welcome to our Trade Setups - April 15th ( US30 ) !
SELL US30
ENTRY LEVEL @ 33918
SL @ 33953
TP @ 33563
Max Risk: 1% - 3%!
Risk/Reward Ratio: 10
Leave us a comment or like to keep our content for free and alive.
Have a great week everyone!

US 30-year Treasury Bonds; Get ready to buy them up.These will easily outperform US (and probably global) equities by a very wide margin! (3%-5% annually) - And so will the 10-year Notes, and the T-Bills, and ... Bet on it! (Inflation expectations = waiting for the Tooth Fairy)
... and when the head o JP Morgan Chase says; "I wouldn't touch 30- year treasuries!" ... You know it's time to load up!

US30USD TECHNICAL ANAYLSIS buy opportunity US30USDUS30USD TECHNICAL ANAYLSIS buy opportunity US30USD

US30/Nikkei225 - (Continuation) SHORT; SELL it until ...... it can be shorted no more!!
Here is the original post;
Been making stupid amounts of money in this spread, ever since!3
Obviously, this still has quite a few country miles left in it (SHORT). - Then, on the top of it, factor in the currency differential and Baam! ... Probably the best (passive) index trade out there, bar none.

NDX/US30 - SHORT; SELL this extreme "rotation" in US equities!!Most likely a Crash.
Here is the Nasdaq100
from this post
Here is the DJIA


US30 ( MASSIVE OPPORTUNITY )US30 has rejected the resistance and then it dropped breaking the trendline, so here we see that it is retesting the trendline from here we anticipate sellers to control the market

US30 Sell OpportunityUS30 chart analysis for a sell and buy ideas
Follow us for more analysis and signals

PERFECT - Follow up analysisClick the link in the "Red circle" to see the previous analysis, and also here's attached below the link to see the beginning of this analysis before the election:
I reckon it will reach the final target before the year ends. PERFECT Trades and Analysis!
Catalyst:
- Covid-19 vaccine breaking news
- Trump v Biden breaking news
