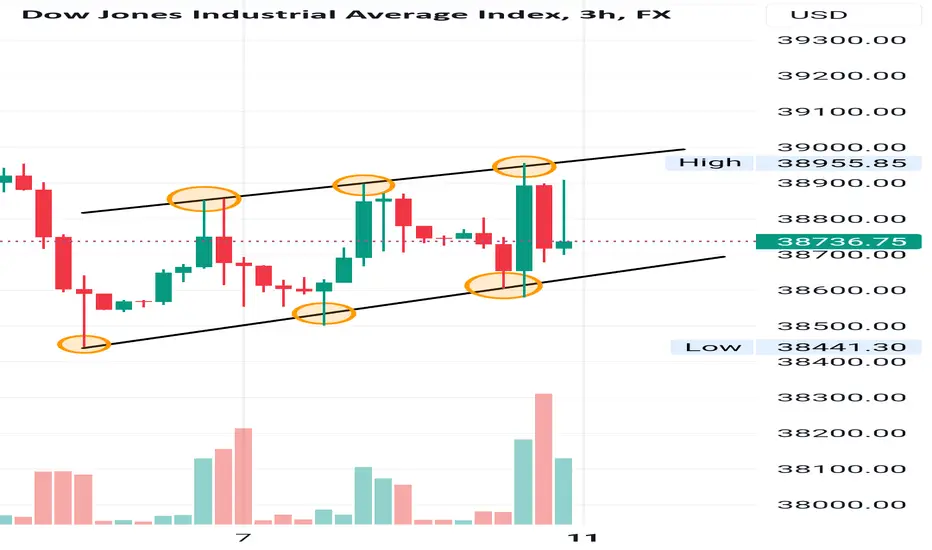
US30 Trade IdeaUS530: Riding the Ascending Channel to New Heights
The US30 index has been tracing an ascending channel on the 4-hour chart, a bullish pattern that suggests a continuation of the current uptrend. This pattern is characterized by two parallel upward-sloping trend lines that have been containing the price action.
Key Observations:
Bullish Sentiment: The ascending channel indicates a strong bullish sentiment as it is formed by a series of higher highs and higher lows.
Support and Resistance: The lower trend line serves as support, while the upper trend line acts as resistance.
Trading Strategy: Traders might consider buying at the lower trend line or on a breakout above the upper trend line.
Trade Execution:
Entry Point: A pullback towards the lower trend line could be a potential entry point, offering a favorable risk-reward ratio.
Stop Loss: A stop loss can be placed just below the lower trend line to protect against a potential breakdown.
Take Profit: The height of the channel can be used to project potential take profit levels, either from the point of entry or from the upper trend line if trading a breakout.
Risk Consideration:
Ensure to monitor for any signs of a breakdown below the lower trend line, which could invalidate the pattern.
Adjust positions according to the evolving market conditions and maintain a disciplined approach to risk management.
Trade ideas are speculative and should be considered within the context of your overall market analysis and trading strategy.
This trade idea is based on the ascending channel pattern, which is a common bullish signal in technical analysis. It’s important to combine this with other indicators and market analysis for a well-rounded trading decision. Happy trading!
Us30signal
US30 sellI had been waiting days for this move and during the week US30 had created equal highs and built liquidity where I was waiting for price to eventually tap into the main supply zone also taking out early sellers.
Upon seeing that volume was coming back into the market at around 2.30pm Uk time I set a sell limit @38950.00 with sl@39000.00 (risking 50pts). Zooming into the 1min once price entered into zone and broke structure to the downside this gave me added confluence.
TP1: 38800.00 TP2: 38650.00 TP3:38450.00 TP4: 38300.00
* Where has the market moved since I entered my trade? PROFITS
* If I looked at the market now, would I take the same trade? yes
* How do I feel about my trade? optimistic
* What do I like about this trade ? precise entry, patience stalking the move
* What do I dis-like about this trade now? nothing just that it may go into next week
* On a scale of 1 to 10, where would I rate this Trade now? 8/10
* If I were not in a trade now, would I take the opposite trade ? no

DOWJONES - Buy Zone!Hi there!
I'm a buyer on the DOW JONES:
-RMID (Range Manipulation Initiation Distribution)
-We have liquidity uptake.
-We're in an interesting zone.
-We have the optimal Fibonacci.
-We have accumulation before/on the zone.
-We're in the trend.
Let's not forget that we also have good profit results from companies, and we have Nvidia's report coming up, which looks very promising!
🚀 If you liked it and want more, don't hesitate to subscribe and boost the post!
Questions? Leave a comment!

Dow Jones / US30This Is My Anticipation On The Us30, Hopefully We See A Low Of The Week Formed On The Daily Mitigation Block And We Get A Change In State Of Delivery Bullishly On The H1 To Confirm The Bias I Hold Already.

DOWJONES - Buy Zone!Hi there!
I'm a buyer on the DOW JONES:
-RMID (Range Manipulation Initiation Distribution)
-We have liquidity uptake.
-We're in an interesting zone.
-We have the optimal Fibonacci.
-We have accumulation before/on the zone.
-We're in the trend.
Let's not forget that we also have good profit results from companies, and we have Nvidia's report coming up, which looks very promising!
🚀 If you liked it and want more, don't hesitate to subscribe and boost the post!
Questions? Leave a comment!

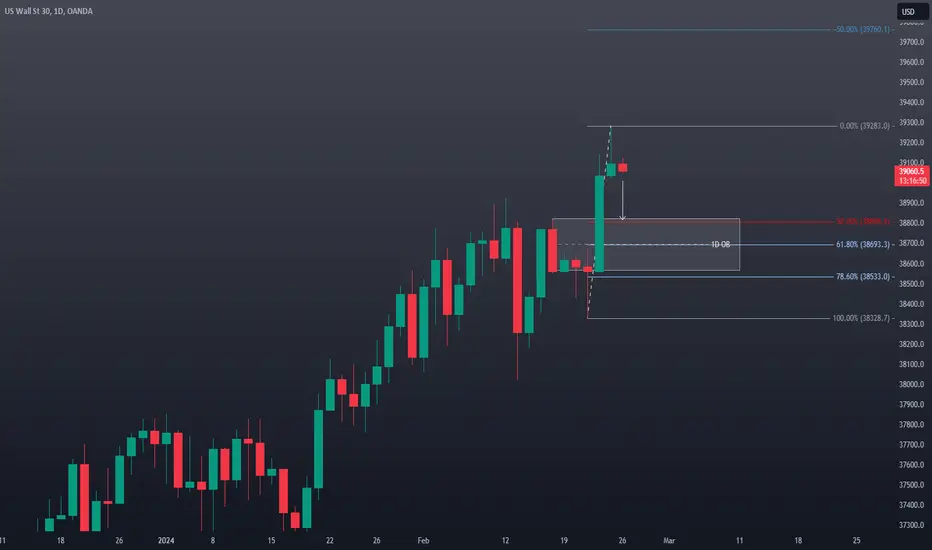
US30 DOW JONES Technical Analysis and Trade IdeaThe US30 has enjoyed a robust bullish run, but recent price action on the 1D and 4H charts indicates potential weakness. I'm anticipating a **sell opportunity** should we observe a decisive break below the current range low, followed by a retest and failure of that level. Potential targets for this trade would align with prior 1D accumulation range highs.
Remember that trading carries inherent risk. Before executing any trades, it's vital to conduct your own extensive research. Consider both fundamental market drivers and global macroeconomic conditions alongside your technical analysis. Always implement sound risk management practices to safeguard your investment.
**Disclaimer**: This analysis presents a technical viewpoint on the US30. It should not be interpreted as investment advice. Base your trading decisions on your own risk profile, comprehensive market research, and a thorough assessment of all relevant variables.
US30 Probably setupUS300 For me is probably setup for sell.
My potential setups you see on chart.
This is not recommendation ;) Just my view.
Usually I use 3 or 4 orders with TP1-TP4
Minimal Risk reward is 1:1 NOT LESS

Dow Jones Index (US30): Confirmed Bullish Signal?!
Dow Jones retested a recently broken horizontal resistance.
After a test of structure, the market bounced and violated the upper boundary
of a bullish flag pattern.
The violation may trigger a trend following movement.
Goals: 38050 / 38100
❤️Please, support my work with like, thank you!❤️

US30 IndexPair : US30 Index
Description :
Impulse Correction " ABC " Impulse Completed. Rejecting from the Strong Resistance Level. Completed " 1234 " Impulsive Waves in Short Time Frame. Rising Wedge as an Corrective Pattern in Long Time Frame , Wait for the Proper Rejection / Breakout

Market Dynamics: Large Players Enter as Price Reaches Highs
The price has been on a significant bullish rally, breaking historical highs. This suggests that the price has encountered strong buying interest, indicating the presence of buy-side liquidity. From a technical perspective, this suggests that a retracement may be imminent.
As further confirmation, on the daily chart, we can see that the price reached the liquidity of its previous high and swiftly reversed, creating a breaker pattern. If the price continues to decline, it is likely to experience a shallow retracement to prevent buyers from recovering all their losses.
Additionally, in the highlighted area, we can clearly observe a decrease in buying activity and an increase in aggressive short positions. This could be an indication of the involvement of institutional or large traders, and it's something to keep a close eye on.
Furthermore, the catalysts scheduled for tomorrow add more weight to the possibility of a correction. In my experience, this type of price action often occurs before significant market-moving events. A significant correction is highly probable.
For setting stop-loss (SL) levels, I've shared both aggressive and conservative ideas. I've also provided take-profit (TP) levels based on Fibonacci retracement levels at -272 and -618, with the last one indicated by the white line on the chart.
Please note that trading involves risks, and it's essential to use proper risk management techniques and consider your own trading strategy and risk tolerance when making trading decisions. This analysis is for informational purposes only and should not be considered as financial advice.

US30 DOW JONES Technical Analysis And Trade Idea The US30 has exhibited a strong upward movement, recently reaching a significant resistance level on both the daily and weekly charts. This video provides a detailed analysis of this trend, meticulously examining price movements and identifying possible trading opportunities by thoroughly assessing multiple timeframes, ranging from weekly to as short as 15 minutes. Anticipate an in-depth review covering price variations, market trends, trend evaluations, and crucial technical analysis components. It's crucial to emphasize that the insights shared here are purely educational and should not be interpreted as financial advice.

US30 and NAS100 Possible buy zone!Hello traders, this is a complete multiple timeframe analysis of this pair. We see could find significant trading opportunities as per analysis upon price action confirmation we may take this trade. Smash the like button if you find value in this analysis and drop a comment if you have any questions or let me know which pair to cover in my next analysis.

US30USD ShortWell, the price has broken the resistance zone aggressively, and I anticipate that the price will continue with bearish momentum.

US30USD LongThe index has been having a strong bull run for the past few weeks, and I am anticipating that the run will continue.
According to the client sentiment analysis, it seems most traders are selling this index - 78%, and I am predicting that the price might move in their favor.
My entry point is 35400, TP at 35700, and SL at 35250.
My target R: R is 1:2
Note - Only risk 1% of your trading account.

US30 DJI on 20-11-2023 : BEARISH BIASEDUS30 Index can go Bullish if,
H1/H4 closing happens above 35000, it can move bullish upto 35150 level.
or it can go Bearish if,
H1/H4 closing happens below 34880, it can move bearish upto 34730 level
#️⃣ Trend expectations from 8:00AM to 12:30PM USA Time EST.
#️⃣ Trade with 1-2% risk only.

US30 - Short SignalThe 35,000 handle has become a focal point, laden with significant psychological implications. Anticipating potential rejections in this territory, though the extent of their impact remains uncertain. Nevertheless, the exploration of this scenario is deemed valuable, given the considerable corrective movements stemming from last week's market fluctuations and the imminent Consumer Price Index (CPI) release later this week.

US30 D1 - Short SignalUS30 D1
The US30 could undergo another substantial selloff, and we've begun to decisively resist the 34,150 price level, as previously anticipated.
Our response may not have been as swift as I'd prefer, but it's worth noting that we closed yesterday's D1 candle in the red, indicating a renewed bearish sentiment today. We remain optimistic about the possibility of seizing short trading opportunities in alignment with the ongoing trends on both the US30 and NAS100 indices.

US30 4H tests additional barrierYesterday, the index price activated the upward corrective path, compensating for some losses by testing the additional stable barrier near 33090 and settling below it, as is clear in the attached figure.
Therefore, we will continue to wait for the price to succeed in gaining additional negative momentum to facilitate the task of activating the negative attack again. We expect it to soon attack the 32328 level and then attempt to reach the 50% Fibonacci retracement level centered at 31851.
The expected general trend for today: bearish with the stability of the barrier
Pivot Price: 33040
Resistance Price: 334131 & 34005 & 34534
support price: 32328 & 318951 & 31348
