US30 top-down analysisHello traders, this is a complete multiple timeframe analysis of this pair. We see could find significant trading opportunities as per analysis upon price action confirmation we may take this trade. Smash the like button if you find value in this analysis and drop a comment if you have any questions or let me know which pair to cover in my next analysis.
Us30update

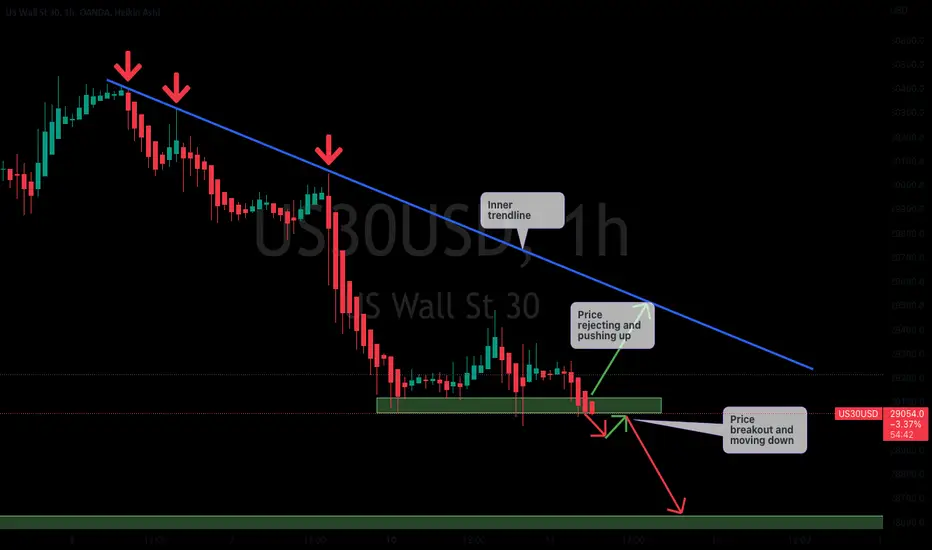
Dow Jones (US 30) US 30 daily analysis on 1H chart. The market is still bearish. The price is currently at the trendline. We may see the price pushing to challenge the trendline. if not, the price will move down to confirm that the current move was a correction.

Dow Jones ( US 30) daily analysis US 30 daily analysis on the 1H chart. The market direction is still on the down trend. The price is currently close to our trendline that has been test 3 times. if the price respect the trendline we may see it going down and if not the trendline will be breaken and the price will move up.

US 30 daily US 30 daily analysis on 1H chart. Market direction is still bearish. We see the price is very close to the trendline that we had for sometime now. If the price respect the trendline we will see it going down and if not it will break the trendline and push up. Wait for the rejection or a breakout.

US 30 weekly analysisUS 30 weekly analysis on 1D chart. Based on the structure of the market. it is bearish and the current move is a correction. If the price respect the trendline as it has done before we will see the price going down very strong, but if the price break the trendline, a new structure may be formed and giving us a bull market. One need to wait for the confirmation before acting in buying or selling.

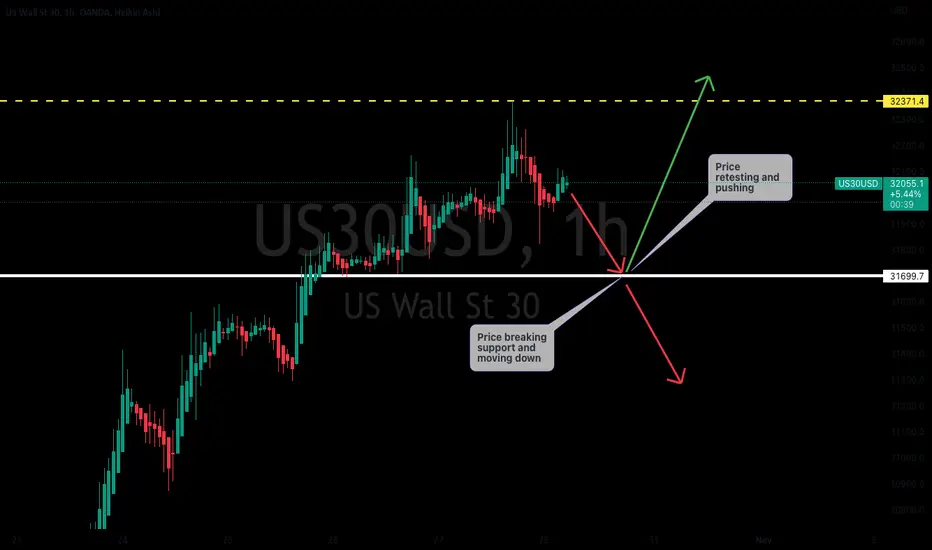
US 30 daily analysisUS 30 daily analysis on 1H chart. The overall market is still bearish and the price is on a correction move. The price may make a move to the down to retest the support level or it will break it and move down.
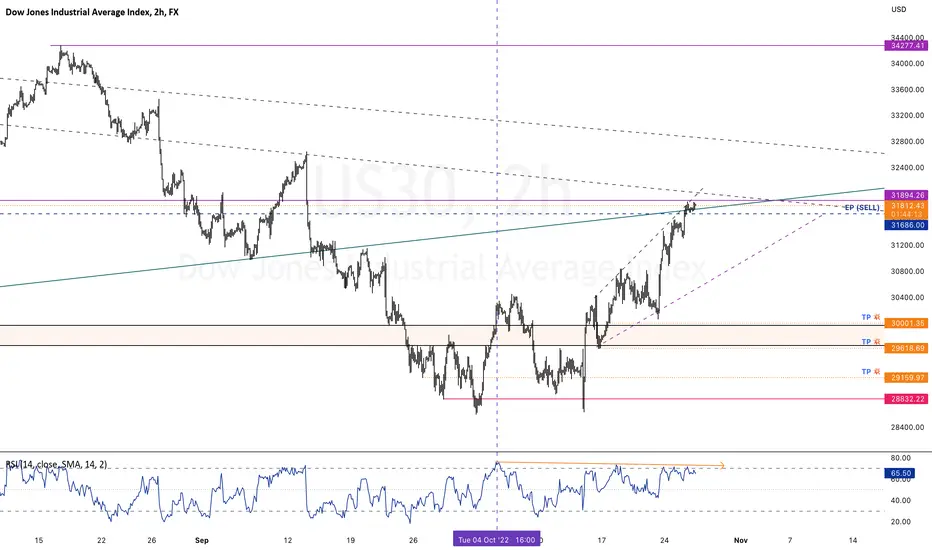
US30 (High Probability SELL Setup Soon)Here we can see clearly the next move for US30,
* Prices have continued the bullish move higher & resulted in 3 consecutive positive days.
* This has resulted in signals for sentiment being at overbought extremes & we look for a move to the downside.
* A lower correction is expected.
* A break of 31690 bis needed to confirm follow through negative momentum.
* We got our EP (blue line) & our TP's (golden lines).
* Keep a close eye on US30 today,
* Happy pip hunting traders
US 30 daily analysisUS 30 daily analysis on 1H chart. The overall market is still bearish. The price is on a correction move at this moment. The may move down to the support level to retest it and move up or we may see it breaking the support level move down.

US 30 daily analysisUS 30 daily analysis on 1H chart. The price has managed to break the inner trendline and now, we see it pushing to the out trendline. We need to see the price pull back before pushing up.

US30 is in possible sell zone!!US30 has formed a strong bearish price action after multiple liquidity grabs and false breakouts. Currently, on the hourly chart, the price has formed a head & shoulder on the resistance level with bearish engulfing followed by a Doji. It is a high probability that the price will continue to drop to the next support level as the long-term trend is bearish and the price has a strong downward bias. Upon candle close, a sell trade is high probable.
Thank you and press the like button if you enjoy this content :)

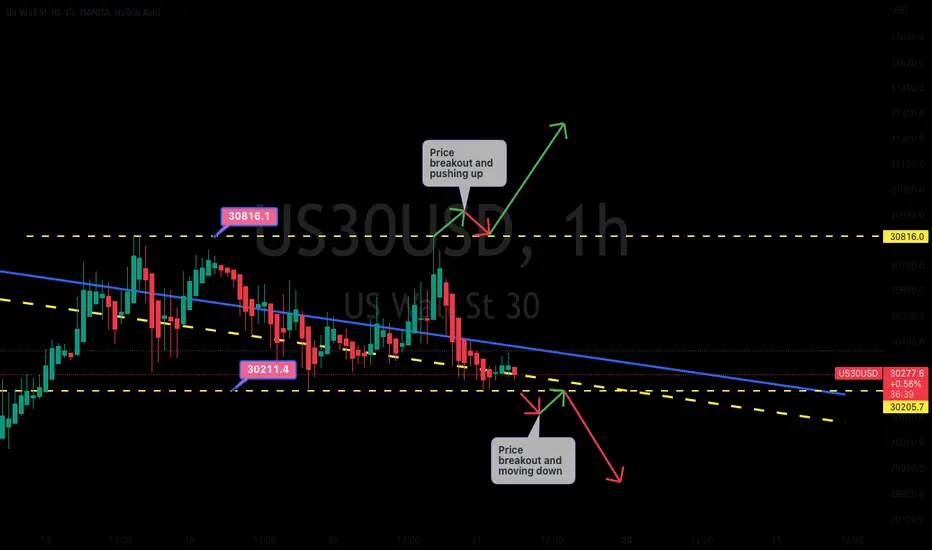
US 30 daily analysis US 30 daily analysis o 1H chart. the price is currently on the sideway move, which mean a breakout is going to take place. One need to wait for it. Pay attention to the two levels of support and resistance if one is broken one take a buy or a sell it will depend as to which one that is broken.
US30 Short: Daily Trend Line Resistance, Range 1- Overall Downtrend on 1D
2- Price is currently testing the daily trendline resistance
3- There is also a strong Daily resistance
4- Range bound for last 3 days
5- Will go short once the price breaks the support area

US30 (High Probability SELL Setup Soon)Here we can see clearly the next move for Dow Jones Industrial Average (US30) in the coming hours, we're using the HTF for clearer view of our analysis, Keep a close eye on US30, Happy pip hunting traders.

US 30 daily analysisUS 30 daily analysis on 1H chart. Price managed to break the trendline but rejected at the resistance level above has we see the price back below the trendline again. One will have to wait for the price to break it and give a retest before one can buy.

US 30 daily analysisUs 30 daily analysis on 1H chart. Our descending trendline has been broken. The price is currently consolidating, which means that, we may see a move either to the downside or to the upside. One need to wait for the direction at this point.

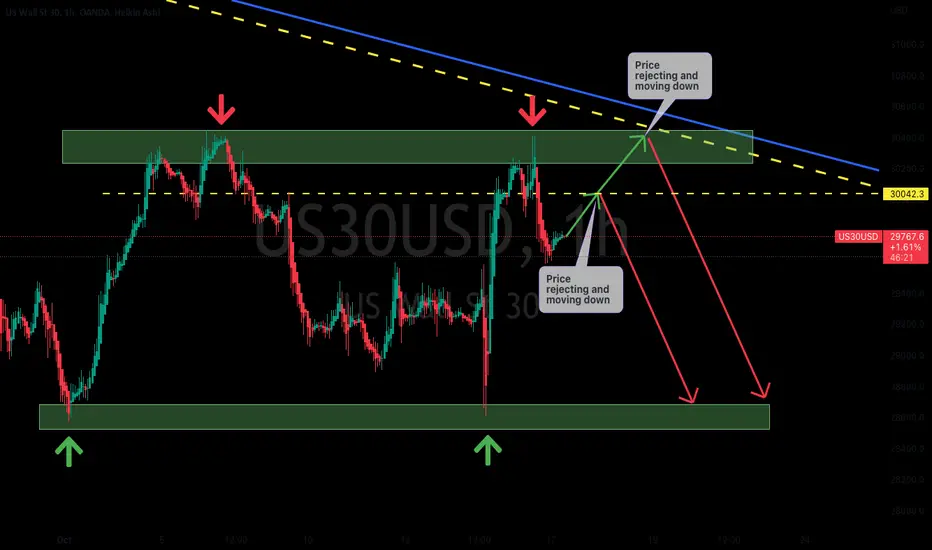
US 30 daily analysisUs 30 daily analysis on 1H chart. The market direction is bearish at this moment. The price is at the resistance level. If the price respect the level it will reject and move down, if not,. The price will break the resistance and push to the upside.

Our Stop Loss at Break even @ 30140 TP1 @ Fridays High Following our entry at the beginning of the hour OUR STOP LOSS is at Break even @ 30140 TP1 @ Fridays High
Manage the trade accordingly we will not be moving our STOP LOSS NOW until at least the next hour.
We will continue to share our trade and chart ideas on this FREE platform if we see the interaction from the community, so PLEASE SUBSCRIBE TO SEEKINGPIPS HERE ON THIS PLATFORM.

US 30 daily analysis Us 30 daily analysis on 1H chart. The overall market is bearish, as per the market direction. The price is below my trendline at the higher timeframe. Price has respected a resistance level. Therefore, one should look for selling opportunities in this market more than buying. check my weekly analysis.

US 30 weekly analysisUS 30 weekly analysis on the 4H chart. The market is still in the bear move. The price has respected the resistance level and move down. It with be noted that the price is just moving sideways. As a trader you are looking for a breakout, before one can take a trade.

US 30 daily analysisUS 30 daily analysis on 1H chart. The market is still bearish. The great opportunities are more on the selling side, than buying. Check my weekly analysis for more understanding.
US 30 daily analysis US 30 daily analysis on 2H chart. The market direction is bearish. The price has just rejected at the resistance level and is currently moving down. If the price respect the recurrent low. the price will move up, if not, we will see the price break and move down.

US 30 weekly analysisUS 30 weekly analysis on a 4H chart. The market is still bearish at this point. The price has given us a retest before turning and moving down. if one has to take a trade, one will have to wait for the price to breakout of the support first or the price reject at the support and only after that you can take a trade.
