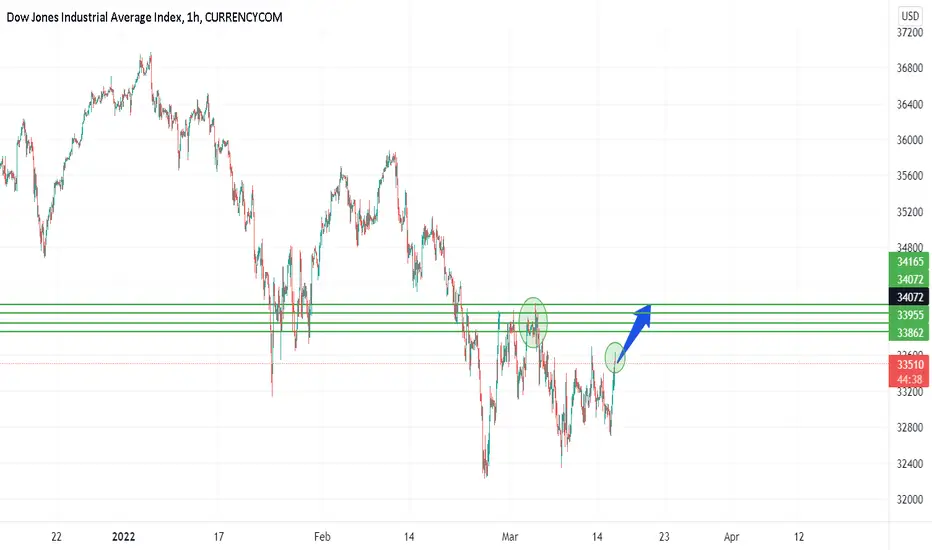
US30 as a Bullish H1 TimeFrameUS30 as a Bullish H1 Time Frame
Target 1 at 33862
Target 2 at 33955
Target 3 at 34165
Almost 600 + Pipsss
US WALL ST 30
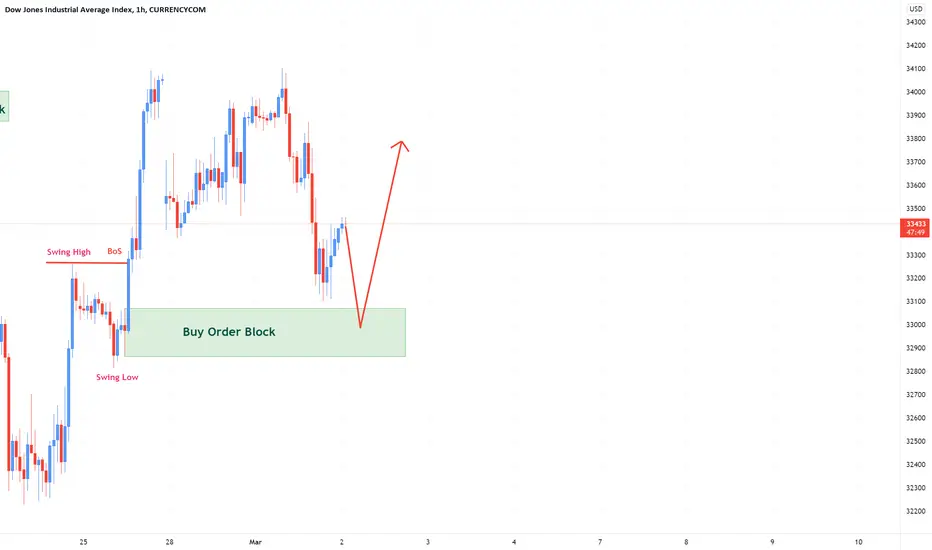
US30 Prediction H1Here is my view for US30 on H1. The price should go down, you can put a pending order on the Order block or find an entry on LTF within OB Zone. Trade Safe!

US30USD YM1! DOW 2022 MAR 14 Week
US30USD YM1! DOW 2022 MAR 14 Week
With the break of 33087, market may next test of 32167-32427.
Preference will be to short on retracement with target to this
level.
Breach of this level will see test of lower levels.
Price reaction levels
Short on Test and Reject | Long on Test and Accept
36446 35750 35330
34968 34367 34034
33427 32492 32167
Weekly: Average volume down bar closing off low = some demand.
Daily: Low volume down bar closing at low = weakness
Remember to like and follow if you find this useful.
Have a profitable week ahead.

Dow ScalpShorting the us index for a scalp trade. Its just for you to study why am I entering and why not. Its not a trade recommendation at all.

DOWJONESEntering a short term order for buyside liquidity. Watching price action and waiting for entry. Good luck all<

DOW JONES SELL SETUPMy analysis is that US30 will break the previous double bottom support and sell. TP and SL shown in the setup.

US30 BUY ANALYSISLooking at US30 on 30M timeframe
We looking for potential long position
Inverse H&S has been formed

DOW JONES LONGS 📉📉📉📈 Expecting bullish price action on US30 (DOW JONES) as price takes out weekly lows and rejects a h4 bullish orderblock area + volume profile poc + institutional figure 33.000. We have a lot of liquidity that has been build on the trendline and price should take it ASAP.
What do you think ?


Dow Jones gonna fallSelling pressure continues to weigh on US indices especially on Dow Jones. We will see new lower lows this week as Russia-Ukraine crisis stay in focus of investors.

US30 - Next Buy Opportunity 😊Technical Overview: - Dow Jones
Previously -
Simple, whoever tells you short is selling you lies, you want to be on the safe side? stay bullish on US markets simple as that.
Wait for dips if they happen don't chase the market :)
Analysis is only 1 piece of the puzzle 🧩
Our analysis is a sentiment for the upcoming week, month.
Use this as a weather forecast, you are the person that has to put on a jacket when it’s raining.
Trade this sentiment based off your own entry strategy at the right time.
Flow with the Devil 😈
Trade with the manipulation👾

US30USD YM1! DOW 2022 MAR 07 Week
YM1!
US30USD YM1! DOW 2022 MAR 07 Week
Last week, long from test area1 at 32672 and short from 34034 worked.
Market is in a rotation between 34034 and 33087
As such, preference to short at resistance and long at support is
preferred, until any decisive directionis shown by the market.
Price reaction levels
Short on Test and Reject | Long on Test and Accept
36446 35750 35330
34968 34367 34034
33230 32672 32167
Weekly: Average volume down bar closing in middle =
undecisive
Daily: Average volume down bar closing off high = strength
Remember to like and follow if you find this useful.
Have a profitable week ahead.

US30 OUTLOOK UPDATE During yesterdays London session we were stuck in a consolidation faze for 8 hours.
Once we finally broke out we rejected off major zone 34100 for the 5th time and then rejected back off of 33750...end up back right where we left off during London session.
Also stated this yesterday, "i would like to see a retest of 33750 and a break through 34100. If not we might bounce back and fourth within a major consolidation zone from 33100 - 34100"
We still need to see a clear break through 34100 to break resistance.

US30rollby technically the trend will get down and also the news make the trend refer to down so be careful from bad situation
approximately entry under blackline sell at 34080
Tp. 33800 & 33650
SL 34300

US30 Prediction H1Here is my view for US30 on H1. The price should go up, you can put a pending order on the Order block or find an entry on LTF within OB Zone. Trade Safe!

US30 GOING LONG After grabbing liquidity on the daily TF last week i suspect that little pullback is a mitigation of the liquidity grab... I'm not targeting far because i don't see why price might want to continue far bullish but will keep watching it's behaviour as it approaches those double tops created when it was covering the weekend price gap...

US30 Bullish H1Here is my view for US30 on H1. The price should go up, you can put a pending order on the Order block or find an entry on LTF within OB Zone. Trade Safe!
US30US30 will fake out to the lower zone which could be Good Sell Scalps but even if it do so we must look for buying opportunities for whole this week and Target would be 36600 !

US30 update with new entry added to catch 600 pips- We put this short setup after price broke the last structure and also corrected on it.
- Price dropped about 300 pips and started to pull back.
- We can see a pin bar engulfing candle also on the lower timeframes you will see that price broke an ascending correction channel.
- So now we can put another entry to 32500 to catch 600 pips

US30 strongly brearishUS30 has just broken the support line and is likely start a new downtrend as we have seen long-term consolidation above. the current price action is highly brearish.

US30 30 min breaks February 28Follow the 30 minute breaks of support and resistance , this is a scalping strategy created by Edwin Gonzalez. I have no bias on the market as I create the chart I trade what I see and react to it. Simple explanation of the strategy is to look at the 30 minute chart look at the direction where the candle closes above or below the line , take the trade on that direction. I cant stress this enough , this is a scalping strategy as soon as I see blue I put my SL in profits. Rinse and Repeat.
*** I update my charts every night and in the morning to confirm the S And R ***
-The strategy is for the 30 minute chart.
-Edwin usually sends over the charts already marked up.
-The Support and resistance lines are based off of the 1D, 4H, and 1H charts.
-This is a market structure strategy so you'll want to make your trade decisions based on how the market is trending and using the S/R lines provided.
Comment Below if you have any questions or input about the strategy.

US30USD YM1! DOW 2022 FEB 28 Week
US30USD YM1! DOW 2022 FEB 28 Week
Last week's short from 34367, and late week long
on support was highly profitable.
With price pushing up on very high volume, there's a
possibility of price returning to test these high volume area,
scenarios will be:
1) Long if test area 1 is supported
2) Long if test area 2 is supported
3) Not forgetting the trend channel showing overbought,
there may be an opportunity to short if price shows rejection
at 34367 / 34034
Price reaction levels
Short on Test and Reject | Long on Test and Accept
36446 35750 35330
34968 34367 34034
33230 32672 32167
Weekly: High volume wide spread up bar closing off high =
weakness
Daily: Very high volume up bar driving demand to close above
33031 followed by average volume up bar closing near high
= strength
H4: High volume down bar closing off high = demand present.
Remember to like and follow if you find this useful.
Have a profitable week ahead.

US30 might fall and here is whyUS30 might fall back to 33476. Price is trading within a descending channel and price has reached the resistance of this channel. Because of the strong downward momentum it can be difficult for bulls to push price up beyond this resistance. I expect price to fall.
Please support this idea with likes. I will highly appreciate it ❤️
