US30 - Short SellThe Dow Jones aka US30
* Overall trend is bullish
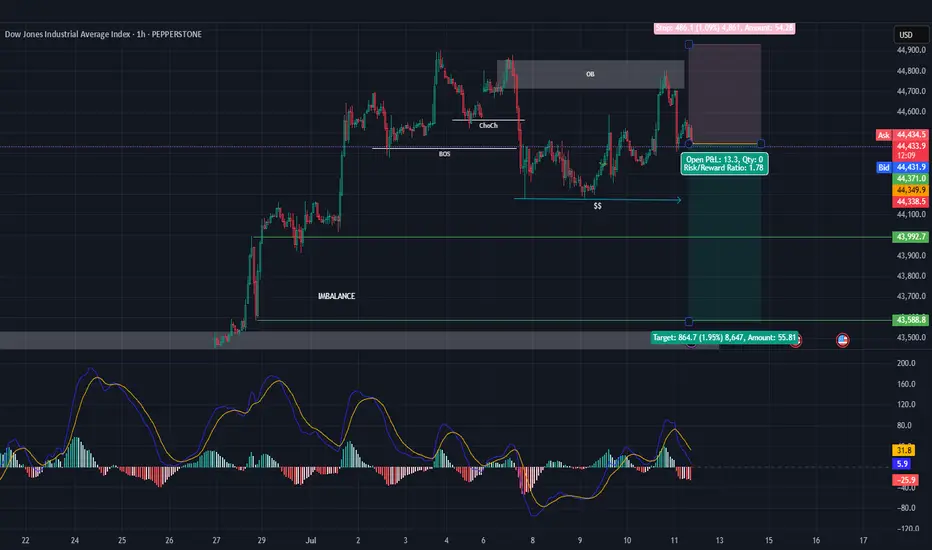
* Currently trading the retracement with the following points.
1. Valid OB
2. Liquidity to the sell side
3. Imbalance to the sell side
4. Price failed to break the previous HH activating the Bear positions, the question is How Deep The Retracement Will Be ? So we are closely monitoring the price action to adjust at any changes that the market might face.
Us30usdsignal
"US30/DJ30" Indices CFD Market Bearish Heist Plan🌟Hi! Hola! Ola! Bonjour! Hallo!🌟
Dear Money Makers & Robbers, 🤑 💰🐱👤🐱🏍
Based on 🔥Thief Trading style technical and fundamental analysis🔥, here is our master plan to heist the "US30/DJ30" Indices CFD Market. Please adhere to the strategy I've outlined in the chart, which emphasizes short entry. Our aim is the high-risk Green Zone. Risky level, oversold market, consolidation, trend reversal, trap at the level where traders and bullish thieves are getting stronger. 🏆💸Book Profits Be wealthy and safe trade.💪🏆🎉
Entry 📈 : "The heist is on! Wait for the breakout (44,000.0) then make your move - Bearish profits await!"
however I advise placing Sell Stop Orders below the breakout MA or Place Sell limit orders within a 15 or 30 minute timeframe. Entry from the most recent or closest low or high level should be in retest.
Stop Loss 🛑: Thief SL placed at 44,600.0 (swing Trade Basis) Using the 4H period, the recent / swing high or low level.
SL is based on your risk of the trade, lot size and how many multiple orders you have to take.
Target 🎯: 43,000.0 (or) Escape Before the Target
🧲Scalpers, take note 👀 : only scalp on the Short side. If you have a lot of money, you can go straight away; if not, you can join swing traders and carry out the robbery plan. Use trailing SL to safeguard your money 💰.
📰🗞️Fundamental, Macro, COT, Sentimental Outlook:
"US30/DJ30" Indices CFD Market is currently experiencing a Bearish trend., driven by several key factors.
⚪Fundamental Analysis
The US30 index is influenced by the overall performance of the US economy, including GDP growth rate, inflation, and interest rates. Currently, the US economy is experiencing a moderate growth rate, with a slight increase in inflation.
🔴Macroeconomic Analysis
The Federal Reserve has maintained a hawkish stance, with interest rates expected to remain high in the short term. This has led to a strengthening of the US dollar, which may impact the US30 index.
🟢COT Data Analysis
The Commitments of Traders (COT) report shows that commercial traders are net short, while non-commercial traders are net long. This indicates a potential trend reversal.
🟡Sentimental Analysis
Market sentiment is slightly bearish, with 55% of traders holding short positions.
🟤Positioning Data Analysis
Institutional traders are holding short positions, while corporate traders are holding long positions. Banks are maintaining a bearish stance.
🔵Market Sentiment
- Institutional Traders: 60% bearish, 40% bullish
- Hedge Funds: 70% bearish, 30% bullish
- Retail Traders: 55% bullish, 45% bearish
🟣Overall Outlook
The US30 index is expected to remain volatile in the short term, with a slight bearish bias due to the hawkish stance of the Federal Reserve. However, the index's movement will largely depend on the overall performance of the US economy and global economic trends.
⚠️Trading Alert : News Releases and Position Management 📰 🗞️ 🚫🚏
As a reminder, news releases can have a significant impact on market prices and volatility. To minimize potential losses and protect your running positions,
we recommend the following:
Avoid taking new trades during news releases
Use trailing stop-loss orders to protect your running positions and lock in profits
📌Please note that this is a general analysis and not personalized investment advice. It's essential to consider your own risk tolerance and market analysis before making any investment decisions.
📌Keep in mind that these factors can change rapidly, and it's essential to stay up-to-date with market developments and adjust your analysis accordingly.
💖Supporting our robbery plan will enable us to effortlessly make and steal money 💰💵 Tell your friends, Colleagues and family to follow, like, and share. Boost the strength of our robbery team. Every day in this market make money with ease by using the Thief Trading Style.🏆💪🤝❤️🎉🚀
I'll see you soon with another heist plan, so stay tuned 🤑🐱👤🤗🤩

"US30 / DJI 30" Indices Market Bullish Heist Plan🌟Hi! Hola! Ola! Bonjour! Hallo!🌟
Dear Money Makers & Robbers, 🤑 💰
Based on 🔥Thief Trading style technical analysis🔥, here is our master plan to heist the "US30 / DJI 30" Indices market. Please adhere to the strategy I've outlined in the chart, which emphasizes long entry. Our aim is the high-risk Red Zone. Risky level, overbought market, consolidation, trend reversal, trap at the level where traders and bearish robbers are stronger. 👀 So Be Careful, wealthy and safe trade.💪🏆🎉
Entry 📈 : You can enter a Bull trade at any point,
however I advise placing Buy limit orders within a 15 or 30 minute timeframe. Entry from the most recent or closest low or high level should be in retest.
Stop Loss 🛑: Using the 2H period, the recent / nearest low or high level.
Goal 🎯: 44,200.00
Scalpers, take note : only scalp on the Short side. If you have a lot of money, you can go straight away; if not, you can join swing traders and carry out the robbery plan. Use trailing SL to safeguard your money 💰.
Warning⚠️ : Our heist strategy is incompatible with Fundamental Analysis news 📰 🗞️. We'll wreck our plan by smashing the Stop Loss 🚫🚏. Avoid entering the market right after the news release.
Take advantage of the target and get away 🎯 Swing Traders Please reserve the half amount of money and watch for the next dynamic level or order block breakout. Once it is resolved, we can go on to the next new target in our heist plan.
💖Supporting our robbery plan will enable us to effortlessly make and steal money 💰💵 Tell your friends, Colleagues and family to follow, like, and share. Boost the strength of our robbery team. Every day in this market make money with ease by using the Thief Trading Style.🏆💪🤝❤️🎉🚀
I'll see you soon with another heist plan, so stay tuned 🫂

US30USD ShortFollowing last week's bullish impulse move, there were 3 FVGs created and the price might complete the imbalances so that the bullish movement can continue.
The first imbalance has been completed and I am anticipating that it will complete at 42400.

US30usd signal US30usd confirm signal
Follow my chart
US30usd buy signal
US30usd now buy 42:299
Support 42,900

US30USD ShortConsidering that this price completed the rising flag pattern and retested the lower trendline, I do anticipate that the momentum might be bearish. This will depend the one candle stick that closes after the doji.
Still, my entry point will be 39400, SL at 40,000 at TP at 38000

US30USD Weekly AnalysisThis index has been forming a rising flag pattern for the past few weeks which IMO is a strong indicator of a bearish momentum.
I do anticipate that the momentum will continue and test the market zone at 38.2 A follow-up analysis using shorter time frames will follow.

US30USD Pattern FormationThis index has been forming a bullish pennant for the past few days. It has retested the resistance zone, which has now converted to a support zone.
I do anticipate that this index will continue with its bullish and a follow up analysis using a shorter time frame will be done so that we can have a clear entry point.

Us30usd sell confirm Crude oil is one of the most in-demand commodities, with the two most popularly traded grades of oil being Brent Crude and West Texas Intermediate (WTI). Crude oil prices reflect the market’s volatile and liquid nature, as well as oil being a benchmark for global economic activity. The oil price charts offer live data and comprehensive price action on WTI Crude and Brent Crude patterns. Get information on key pivot points, support and resistance and crude oil news today. Confirm signal

Us30usd sellThe Dow Jones Industrial Average (DJIA), Dow Jones or the Dow for short tracks the performance of 30 of the biggest companies in the US including Boeing, Intel, and Dow. It’s often used as a barometer for the overall performance of the country’s equity markets. Historically it’s one of oldest and most followed indices. The chart is a useful measure of US economic health. Follow the Dow Jones live with the real-time chart and view the latest Dow forecasts, news and analysis. Key pivot points and support and resistance will help you trade the Dow Jones today and into the future.
Us30usd sell 38907
Target 37200

US30USD Idea H4Here is my analysis for US30USD on H4 using Order Block. The price could go bullish, you can put a pending order on the Order block or find an entry on LTF within OB Zone. Trade Safe!

US30USD Analysis H1Here is my analysis for US30USD on H1 using Order Block. The price could go bullish, you can put a pending order on the Order block or find an entry on LTF within OB Zone. Trade Safe!

US30USD Analysis H4Here is my analysis for US30USD on H4 using Order Block. The price could go bullish, you can put a pending order on the Order block or find an entry on LTF within OB Zone. Trade Safe!

US30 a aggressive entry spot and a safe entry spot a lower high was formed so upside could be limited and if you want a safe entry wait for break of that low b4 a sell but looking at dxy power i can see this falling pretty bad if dxy holds into the next session and bulls continue if not we could see a move up to the 31000 area b4 a drop


Us30 Bullish with Potential DrawdownUs30 is bullish but due to Distribution from yesterday leaving a big inefficiency, that could be a potential drawdown for repricing but it is not a must to pull back. If it does not offer me buying opportunities where it is now and it deeps I will be looking for buys after repricing if we start off with manipulating to The downside. Today I would say sit back if not participate with less risk today.

Us30 Long Daily BiasWe created the low of the week yesterday. Looking forward to us30 taking the recent highs once we resume to the upside today. During the New York Session

US 30 daily analysis My daily analysis on US 30 on H1 chart. The price is currently moving sideways. we need a Clare move to know if we have a buy or sell.


us30 targetsfirst target 28662 second target 27662 at us30. have divergence at 2h chart, so 1st target must be reached even the previouse divergence (hidden) must push back the index to second target level.

US30 - POST NY SESSION ANALYSIS - 05052022THE BEARS ARE BACK IN TOWN.
After the push up yesterday following Daddy J. Powell's comments, the market (shocker) has corrected itself and continued with the overall bearish directional bias.
IMO the comments made yesterday about the "strength" of our current economic and labor situation were simply a distraction from the fact that they announced the largest interest rate increase since the year 2000.
Had they not made these comments, the markets would have not only gone up, they would have PLUNGED.
So instead we had this dog and pony show of "everything is fine" while the house is burning in the background.
That's why initially the market jumped up 1000 points after this "news" but today the real market factors came back into play and here we have the result.
All of the 1000 point gain that was realized yesterday has been completely erased and by all of my measures, the bears are still in control here.
I anticipate price to hover sideways during Asian and early London session.
I will then be looking to get back in somewhere around good ole 33200-33300 level to continue the ride downwards, targeting previous structure lows.
Have a good night and see you tomorrow morning!

US30 Bullish Wedge !!US30 is trading in an uptrend
A bullish wedge pattern has formed
Now, we are witnessing a bullish trend on the bullish breakout and the previous daily resistance at 34277
If it is successful, it will rise and retest level 37000

US30 Down Trend.!#US30 Looking for Sell trade setup as I mentioned in the Chart.!
Keep Supporting LIKE, COMMENT And FOLLOW.!
Thank You.!
