Nasdaq100 Short Weekly ChartNasdaq100 Short Weekly Chart, Price after big and small AB=CD + BB+ Trendline+ Engulfing candle at the top, price should go now to Take profit 1 area, and from there if will not be a real support it will go to test the SMA200, for take profit 2 odds are much more small but possible
Us500

Potential bullish rise?S&P500 is reacting off the pivot and could rise to the 1st resistance.
Pivot: 5,869.57
1st Support: 5,707.08
1st Resistance: 6,093.53
Risk Warning:
Trading Forex and CFDs carries a high level of risk to your capital and you should only trade with money you can afford to lose. Trading Forex and CFDs may not be suitable for all investors, so please ensure that you fully understand the risks involved and seek independent advice if necessary.
Disclaimer:
The above opinions given constitute general market commentary, and do not constitute the opinion or advice of IC Markets or any form of personal or investment advice.
Any opinions, news, research, analyses, prices, other information, or links to third-party sites contained on this website are provided on an "as-is" basis, are intended only to be informative, is not an advice nor a recommendation, nor research, or a record of our trading prices, or an offer of, or solicitation for a transaction in any financial instrument and thus should not be treated as such. The information provided does not involve any specific investment objectives, financial situation and needs of any specific person who may receive it. Please be aware, that past performance is not a reliable indicator of future performance and/or results. Past Performance or Forward-looking scenarios based upon the reasonable beliefs of the third-party provider are not a guarantee of future performance. Actual results may differ materially from those anticipated in forward-looking or past performance statements. IC Markets makes no representation or warranty and assumes no liability as to the accuracy or completeness of the information provided, nor any loss arising from any investment based on a recommendation, forecast or any information supplied by any third-party.

SPY, Major Warning has been signalled for the stock market. The stock markets have been rattled by a concerning development that historically has been a precursor to increased volatility and economic uncertainty - the uninversion of the yield curve.
In December, long-term interest rates fell below short-term rates, reversing the inversion that had been in place. This yield curve uninversion is often viewed as a potential warning sign of an impending recession, as it has preceded the last seven recessions in the United States.
Looking back at past data, the last time the yield curve was uninverted in this manner was in 2019, just before the COVID-19 pandemic triggered a major market downturn. Prior to that, it uninverted in 2006-2007, shortly before the Great Recession hit in 2008-2009.
While the yield curve uninversion does not guarantee an imminent recession, it has proven to be a reliable leading indicator of increased market volatility and economic slowdown.
Trade safe,
Trader Leo

S&P500 5 month Channel Up bottomed. Bullish reversal started.S&P500 / US500 is trading inside a Channel Up since the August 5th bottom.
Wednesday's Fed fueled correction crossed under the 1day MA50 but stabilized yesterday and today found support over the 1day MA100 and rebounded.
This low is very close to the bottom of the Channel Up and the 1day MA100 was the level that supported the early September pull back.
The 1day RSI is also reversing, and the 3 times it posted a similar pattern inside the Channel Up, it was a bottom.
Buy and target 6200 (+7.10% from the bottom).
Previous chart:
Follow us, like the idea and leave a comment below!!

Potential bullish rise?S&P500 (US500) has reacted off the pivot which acts as an overlap support and could rise to the 38.3% Fibonacci resistance.
Pivot: 5,868.52
1st Support: 5,788.39
1st Resistance: 5,930.95
Risk Warning:
Trading Forex and CFDs carries a high level of risk to your capital and you should only trade with money you can afford to lose. Trading Forex and CFDs may not be suitable for all investors, so please ensure that you fully understand the risks involved and seek independent advice if necessary.
Disclaimer:
The above opinions given constitute general market commentary, and do not constitute the opinion or advice of IC Markets or any form of personal or investment advice.
Any opinions, news, research, analyses, prices, other information, or links to third-party sites contained on this website are provided on an "as-is" basis, are intended only to be informative, is not an advice nor a recommendation, nor research, or a record of our trading prices, or an offer of, or solicitation for a transaction in any financial instrument and thus should not be treated as such. The information provided does not involve any specific investment objectives, financial situation and needs of any specific person who may receive it. Please be aware, that past performance is not a reliable indicator of future performance and/or results. Past Performance or Forward-looking scenarios based upon the reasonable beliefs of the third-party provider are not a guarantee of future performance. Actual results may differ materially from those anticipated in forward-looking or past performance statements. IC Markets makes no representation or warranty and assumes no liability as to the accuracy or completeness of the information provided, nor any loss arising from any investment based on a recommendation, forecast or any information supplied by any third-party.

S&P500 INDEX (US500): Time to Recover
It looks like US500 is ready to recover after the yesterday's
crazy bearish movement.
We may see a pullback at least to 5940/
❤️Please, support my work with like, thank you!❤️

S&P500 hit the MA50 (1d). Huge buy signal.S&P500 hit today its MA50 (1d) following the Fed Rate announcement.
At the same time, it is testing the bottom of August's Channel Up.
As long as it closes daily inside the pattern, this is a strong buy opportunity.
Trading Plan:
1. Buy on the current market price.
Targets:
1. 6200 (+5.75% rise similar to the previous one).
Tips:
1. The RSI (1d) hit its 3 month Support Zone. If it reverses on it, that might be an even better signal for a buy entry.
Please like, follow and comment!!
Notes:
Past trading plan:

US500Hello friends
This is the resistance area that you see, if the price reaches there and the fall is confirmed, we expect a downward step from it to the specified range.
Be successful and profitable.

S&P500 entering a new Bull Cycle according to the Dollar IndexThe S&P500 index (SPX) has been rising aggressively since the October 2022 market bottom, as it recovered from the Inflation Crisis of 2022. Despite the All Time Highs (ATH) that it is currently trading at, we have strong evidence based on the U.S. Dollar Index (DXY) that it is entering a new, more structured Bull Cycle.
As you can see on this cross chart analysis on the 1W time-frame, the market has been on a multi-year uptrend with clear Phases, ever since the March 2009 bottom of the 2008 U.S. Housing Crisis. At the same time, the DXY (blue trend-line) initiated its own Channel Up.
Every time the DXY bottomed, the S&P500 transitioned from the more aggressive, recovery phase (blue Arc pattern) of the Bear Cycle to a more structured (green) Channel Up. As long as the DXY remains below its (dashed) Lower Highs trend-line, the uptrend of the Channel Up is being extended. Once broken, the stock market starts to form a top, which is natural as a strong/ expensive dollar is far from ideal for buying risky assets like stocks.
In any case, it appears that the DXY bottomed in late September 2024 and rebounded aggressively. This is rebound is the exact behavior it has when the previous two (green) Channel Up patterns started. As a result, we believe that the S&P500 has ahead of it around 4 years of growth within this Channel Up, whose pull-backs/ corrections will be the cyclical buy opportunities.
-------------------------------------------------------------------------------
** Please LIKE 👍, FOLLOW ✅, SHARE 🙌 and COMMENT ✍ if you enjoy this idea! Also share your ideas and charts in the comments section below! This is best way to keep it relevant, support us, keep the content here free and allow the idea to reach as many people as possible. **
-------------------------------------------------------------------------------
💸💸💸💸💸💸
👇 👇 👇 👇 👇 👇

S&P500: Channel Up ready to explode to 6,175S&P500 is bullish on its 1D technical outlook (RSI = 63.112, MACD = 49.220, ADX = 50.110) as it is extending August's Channel Up. The 4H RSI is forming an Arc pattern that is much like the below 4H MA50 consolidation of October 1st - 8th. After that was completed, the price rallied to the 1.786 Fibonacci extension to form a HH on the Channel Up. The 1.786 Fib was the target of the next bullish wave as well. Consequently, we are long on SPX, aiming again for that Fib (TP = 6,175).
## If you like our free content follow our profile to get more daily ideas. ##
## Comments and likes are greatly appreciated. ##

Deep short for SPY? My target is at 510, here why!Christmas Eve Rally? - Not quite.
Trump Trade? - Hardly.
So, what’s driving the market higher, and where is SPY headed next?
Investor sentiment surrounding the upcoming U.S. presidential elections seems to echo the euphoria of 2016, raising hopes for a similar post-election rally. Themes like tax cuts, protectionism, and trade wars are fueling optimism for U.S. equities.
But let’s not get carried away. The economic and geopolitical landscapes today are vastly different, and so is the narrative. The “Superman” Trump of 2016 no longer holds the same sway over markets.
The post-COVID stock market rally was buoyed by an unprecedented flood of liquidity. Based on our analysis, those excess dollars are nearly spent. Furthermore, the global economic outlook bears little resemblance to the relatively stable environment of 2016.
While the Democrats’ recent performance metrics provide Powell with ample material to champion a “resilient economy,” the bigger question remains: Is the U.S. stock market truly worth its current valuations?
We’ll delve into the overvaluation of the #SPY and #SPX indices in greater detail in the coming updates.
For now, you can pay close attention to technical analysis, identifying key peaks and potential correction levels.

S&P is Shaping a Bull Flag While Awaiting the FED DecisionLast week was characterized by increasing selling pressure that hindered upward price progression but failed to trigger any substantial pullback. The market has not even retested the previous consolidation zone ( 598-601 ), which highlights the weakness of the sellers.
Looking at the daily chart, the recent price action resembles a bull flag, favoring a continuation of the upward trend. For sellers to demonstrate their strength, they must not only break this pattern to the downside but also breach the 598 support level and drive the price further down to 594 .
Much will depend on the Federal Reserve's interest rate decision this week, alongside the release of key economic data. The most favorable outcome for the bulls would be a 0.25% rate cut. Any other scenario could spark concerns—either about an impending recession (if the cut is larger) or about a prolonged high-interest-rate environment (if the cut is absent).
The market outlook remains bullish; however, the current price level is not ideal for new long positions. Buyers would be better served by waiting for a more meaningful pullback (e.g., to the 600 level), provided it is not driven by a negative shift in economic sentiment.

US500 Is Very Bullish! Long!
Take a look at our analysis for US500.
Time Frame: 8h
Current Trend: Bullish
Sentiment: Oversold (based on 7-period RSI)
Forecast: Bullish
The market is approaching a significant support area 6,060.5.
The underlined horizontal cluster clearly indicates a highly probable bullish movement with target 6,114.4 level.
P.S
We determine oversold/overbought condition with RSI indicator.
When it drops below 30 - the market is considered to be oversold.
When it bounces above 70 - the market is considered to be overbought.
Like and subscribe and comment my ideas if you enjoy them!

S&P500 Is Approaching the Daily TrendHey Traders, in today's trading session we are monitoring US500 for a buying opportunity around 5940 zone, S&P500 is trading in an uptrend and currently is in a correction phase in which it is approaching the trend at 5940 support and resistance area.
Trade safe, Joe.

Bullish momentum to extend?S&P500 (US500) is falling towards the pivot which has been identified as a pullback support and could bounce to the 1st resistance.
Pivot: 6,006.92
1st Support: 5,866.31
1st Resistance: 6,157.58
Risk Warning:
Trading Forex and CFDs carries a high level of risk to your capital and you should only trade with money you can afford to lose. Trading Forex and CFDs may not be suitable for all investors, so please ensure that you fully understand the risks involved and seek independent advice if necessary.
Disclaimer:
The above opinions given constitute general market commentary, and do not constitute the opinion or advice of IC Markets or any form of personal or investment advice.
Any opinions, news, research, analyses, prices, other information, or links to third-party sites contained on this website are provided on an "as-is" basis, are intended only to be informative, is not an advice nor a recommendation, nor research, or a record of our trading prices, or an offer of, or solicitation for a transaction in any financial instrument and thus should not be treated as such. The information provided does not involve any specific investment objectives, financial situation and needs of any specific person who may receive it. Please be aware, that past performance is not a reliable indicator of future performance and/or results. Past Performance or Forward-looking scenarios based upon the reasonable beliefs of the third-party provider are not a guarantee of future performance. Actual results may differ materially from those anticipated in forward-looking or past performance statements. IC Markets makes no representation or warranty and assumes no liability as to the accuracy or completeness of the information provided, nor any loss arising from any investment based on a recommendation, forecast or any information supplied by any third-party.

SPX Long in Long term to $5050, the up to $6060On the basis of previous cycles analysis.
S&P 500 index is now in the 1st wave of the new growth cycle. Technically and fundamentally now I expect the downside to $4200, but not for long.
After this SPX is going to reach the $5050 price level.
Then after 2nd wave correction (10%) 6 month before US President election SPX starts its 3rd wave up to $6060.

S&P500 What will happen in 2025 and 2026 based on this pattern?The S&P500 index (SPX) has had an excellent run since the time (August 28, see chart below) we introduced the following piece of analysis on the similarities between the 2015 - 2017 fractal and today's 2022 - 2024:
As you see, the index rose by around +8.50% from 5625 to 6100 in only 3.5 months. We are still expecting a local top just below the 3.0 Fibonacci extension, with our Target in tact at 6500.
If it continues to replicate the past pattern into the 2018 fractal as well, then we may experience the last correction of the Bull Cycle around March 2025 towards the 1W MA50 (blue trend-line) as it happened in February - March 2018 and then the final rally to a new All Time High (ATH) towards the end of the year (October - December 2025).
What this pattern shows, and what we've presented to you as a possible scenario on previous analyses, is for a new Bear Cycle to begin in 2026, four years after the Inflation Crisis of 2022, that will once more test the 1W MA200 (orange trend-line), which is the market's long-term Support.
As a side-note to investors, it is important to understand that corrections are cyclical and crises systemic. Long-term, multi-year patterns like this, help us understand with a certain degree of efficiency, when to enter and when to exit. Timing is at times (especially on such long-term horizons), more important than pricing.
-------------------------------------------------------------------------------
** Please LIKE 👍, FOLLOW ✅, SHARE 🙌 and COMMENT ✍ if you enjoy this idea! Also share your ideas and charts in the comments section below! This is best way to keep it relevant, support us, keep the content here free and allow the idea to reach as many people as possible. **
-------------------------------------------------------------------------------
💸💸💸💸💸💸
👇 👇 👇 👇 👇 👇

Potential bullish bounce off pullback resistance?S&P500 (US500) is falling towards the pivot and could bounce to the 1st resistance which has been identified as a pullback resistance.
Pivot: 6,026.51
1st Support: 5,871.75
1st Resistance: 6,099.49
Risk Warning:
Trading Forex and CFDs carries a high level of risk to your capital and you should only trade with money you can afford to lose. Trading Forex and CFDs may not be suitable for all investors, so please ensure that you fully understand the risks involved and seek independent advice if necessary.
Disclaimer:
The above opinions given constitute general market commentary, and do not constitute the opinion or advice of IC Markets or any form of personal or investment advice.
Any opinions, news, research, analyses, prices, other information, or links to third-party sites contained on this website are provided on an "as-is" basis, are intended only to be informative, is not an advice nor a recommendation, nor research, or a record of our trading prices, or an offer of, or solicitation for a transaction in any financial instrument and thus should not be treated as such. The information provided does not involve any specific investment objectives, financial situation and needs of any specific person who may receive it. Please be aware, that past performance is not a reliable indicator of future performance and/or results. Past Performance or Forward-looking scenarios based upon the reasonable beliefs of the third-party provider are not a guarantee of future performance. Actual results may differ materially from those anticipated in forward-looking or past performance statements. IC Markets makes no representation or warranty and assumes no liability as to the accuracy or completeness of the information provided, nor any loss arising from any investment based on a recommendation, forecast or any information supplied by any third-party.

S&P500: Crossed under the 4H MA50. Bearish.S&P500 is headed towards a neutral 1D technical outlook (RSI = 59.952, MACD = 52.430, ADX = 39.810) as today the price hit the 4H MA50 after more than 2 weeks. Every time the index crossed under the 4H MA50 since October 21st, it declined more to the 4H MA200. The long term pattern remains a Channel Up but short term the strenght behind the 4H RSI drop favors going short. Target a potential contact point with the 4H MA200 (TP = 5,960).
## If you like our free content follow our profile to get more daily ideas. ##
## Comments and likes are greatly appreciated. ##

S&P 500: Riding the Wave of OptimismS&P 500: Riding the Wave of Optimism Amid Economic and Political Dynamics
The S&P 500 continues its upward trajectory, buoyed by tech-driven gains and investor optimism, even as mixed economic data and geopolitical uncertainties loom. Here’s a deep dive into the current market landscape and what it means for the benchmark index.
---
Economic and Market Drivers
Tech-Led Rally and AI Optimism
The S&P 500's performance has been significantly influenced by gains in the technology and AI sectors. Investors are betting on the transformative potential of AI, propelling stocks like Microsoft and Meta to the forefront. However, regulatory scrutiny, such as the FTC's probe into Microsoft's AI software sales, introduces a layer of uncertainty.
Resilient Labor Market
While the Challenger Layoffs report showed a slight uptick, JOLTS job openings rose to 7.744 million in October, indicating a stable labor market. This balance supports the Federal Reserve’s cautious approach to monetary policy, as Chair Jerome Powell reiterated the economy’s strength and gradual progress in reducing inflation.
Mixed Economic Indicators
- **ISM Services PMI** fell to 52.1, below expectations of 55.7, suggesting a slowdown in service sector growth.
- **Durable goods orders** increased by 0.3%, meeting expectations and reinforcing the narrative of economic stability.
- **Construction spending** rose 0.4%, signaling robust investment activity.
- **University of Michigan 1-Year Inflation Prelim** came in at 2.9% (forecast: 2.7%, previous: 2.6%), showing slightly higher inflation expectations.
- **University of Michigan Sentiment Prelim** reached 74 (forecast: 73.2, previous: 71.8), reflecting improved consumer confidence.
These data points reflect a U.S. economy navigating challenges while avoiding a hard landing—a scenario that fuels investor confidence.
---
Federal Reserve Policy: A Turning Point?
Fed officials, including John Williams and Christopher Waller, have hinted at the potential for a December rate cut, with futures markets now pricing in an **85% likelihood of a 25-basis-point reduction**, up from **67%** before the recent jobs report. Inflation progress appears to have stalled, with Fed Governor Michelle Bowman cautioning that more robust measures may be necessary to meet the 2% target by 2025.
The November jobs report further influenced expectations:
- US Nonfarm Payrolls rose to 227k (forecast: 220k, previous: 12k, revised to 36k).
- US Unemployment Rate ticked up to 4.2% (forecast: 4.1%, previous: 4.1%).
- US Average Earnings YoY remained steady at 4% (forecast: 3.9%, previous: 4.0%).
These figures reflect a labor market resilient enough to accommodate rate cuts, which could provide an additional boost to equity markets.
---
Corporate Highlights:
- Salesforce reported Q3 revenue of $9.44 billion, exceeding estimates, but missed on adjusted EPS, reflecting mixed investor sentiment.
- Meta (Facebook) is aligning its strategies with evolving political landscapes, as CEO Mark Zuckerberg seeks to navigate regulatory and policy shifts.
- *Microsoft faces FTC scrutiny, underscoring increasing regulatory challenges in the tech sector.
Despite these challenges, corporate earnings have largely supported market valuations, adding another layer of support for the S&P 500.
---
Seasonality and Sentiment:
December has historically been a strong month for the S&P 500, driven by:
- Holiday-driven consumer spending.
- Portfolio rebalancing.
- End-of-year tax considerations.
snapshot
The Fear & Greed Index, currently at 53, indicates a greed-driven sentiment. This optimism aligns with traders pricing in a higher likelihood of Fed rate cuts, reflecting a favorable market environment.
---
Outlook: Optimism with Caution
The S&P 500’s upward momentum is underpinned by strong tech-sector performance, resilient economic data, and seasonal tailwinds. However, challenges such as geopolitical risks, regulatory scrutiny, and uneven progress in disinflation could temper gains.
The Fed's flexibility and potential rate cuts are positive signals for the market, bolstering growth-oriented sectors. Nonetheless, investors should remain vigilant, monitoring corporate earnings, economic releases, and geopolitical developments.
In the near term, the S&P 500 appears poised to end the year on a strong note. However, with inflationary pressures, mixed economic indicators, and geopolitical uncertainties still in play, the path forward will require a delicate balance between economic stability and investor confidence.

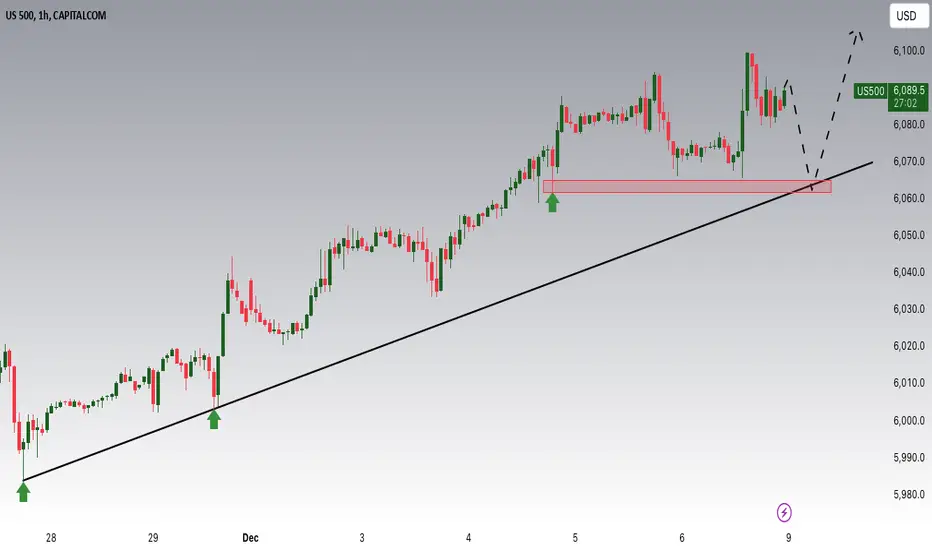
US500 Potential UpsidesHey Traders, in today's trading session we are monitoring US500 for a buying opportunity around 6060 zone, US500 is trading in an uptrend and currently is in a correction phase in which it is approaching the trend at 6060 support and resistance area.
Trade safe, Joe.
S&P 500: Riding the Wave of OptimismS&P 500: Riding the Wave of Optimism Amid Economic and Political Dynamics
The S&P 500 continues its upward trajectory, buoyed by tech-driven gains and investor optimism, even as mixed economic data and geopolitical uncertainties loom. Here’s a deep dive into the current market landscape and what it means for the benchmark index.
---
Economic and Market Drivers
Tech-Led Rally and AI Optimism
The S&P 500's performance has been significantly influenced by gains in the technology and AI sectors. Investors are betting on the transformative potential of AI, propelling stocks like Microsoft and Meta to the forefront. However, regulatory scrutiny, such as the FTC's probe into Microsoft's AI software sales, introduces a layer of uncertainty.
Resilient Labor Market
While the Challenger Layoffs report showed a slight uptick, JOLTS job openings rose to 7.744 million in October, indicating a stable labor market. This balance supports the Federal Reserve’s cautious approach to monetary policy, as Chair Jerome Powell reiterated the economy’s strength and gradual progress in reducing inflation.
Mixed Economic Indicators
- **ISM Services PMI** fell to 52.1, below expectations of 55.7, suggesting a slowdown in service sector growth.
- **Durable goods orders** increased by 0.3%, meeting expectations and reinforcing the narrative of economic stability.
- **Construction spending** rose 0.4%, signaling robust investment activity.
- **University of Michigan 1-Year Inflation Prelim** came in at 2.9% (forecast: 2.7%, previous: 2.6%), showing slightly higher inflation expectations.
- **University of Michigan Sentiment Prelim** reached 74 (forecast: 73.2, previous: 71.8), reflecting improved consumer confidence.
These data points reflect a U.S. economy navigating challenges while avoiding a hard landing—a scenario that fuels investor confidence.
---
Federal Reserve Policy: A Turning Point?
Fed officials, including John Williams and Christopher Waller, have hinted at the potential for a December rate cut, with futures markets now pricing in an **85% likelihood of a 25-basis-point reduction**, up from **67%** before the recent jobs report. Inflation progress appears to have stalled, with Fed Governor Michelle Bowman cautioning that more robust measures may be necessary to meet the 2% target by 2025.
The November jobs report further influenced expectations:
- US Nonfarm Payrolls rose to 227k (forecast: 220k, previous: 12k, revised to 36k).
- US Unemployment Rate ticked up to 4.2% (forecast: 4.1%, previous: 4.1%).
- US Average Earnings YoY remained steady at 4% (forecast: 3.9%, previous: 4.0%).
These figures reflect a labor market resilient enough to accommodate rate cuts, which could provide an additional boost to equity markets.
---
Corporate Highlights
- Salesforce reported Q3 revenue of $9.44 billion, exceeding estimates, but missed on adjusted EPS, reflecting mixed investor sentiment.
- Meta (Facebook) is aligning its strategies with evolving political landscapes, as CEO Mark Zuckerberg seeks to navigate regulatory and policy shifts.
- *Microsoft faces FTC scrutiny, underscoring increasing regulatory challenges in the tech sector.
Despite these challenges, corporate earnings have largely supported market valuations, adding another layer of support for the S&P 500.
---
Seasonality and Sentiment
December has historically been a strong month for the S&P 500, driven by:
- Holiday-driven consumer spending.
- Portfolio rebalancing.
- End-of-year tax considerations.
The Fear & Greed Index, currently at 53, indicates a greed-driven sentiment. This optimism aligns with traders pricing in a higher likelihood of Fed rate cuts, reflecting a favorable market environment.
---
Outlook: Optimism with Caution
The S&P 500’s upward momentum is underpinned by strong tech-sector performance, resilient economic data, and seasonal tailwinds. However, challenges such as geopolitical risks, regulatory scrutiny, and uneven progress in disinflation could temper gains.
The Fed's flexibility and potential rate cuts are positive signals for the market, bolstering growth-oriented sectors. Nonetheless, investors should remain vigilant, monitoring corporate earnings, economic releases, and geopolitical developments.
In the near term, the S&P 500 appears poised to end the year on a strong note. However, with inflationary pressures, mixed economic indicators, and geopolitical uncertainties still in play, the path forward will require a delicate balance between economic stability and investor confidence.

Bearish drop?S&P500 (US500) is reacting off the pivot and could drop to the 23.6% Fibonacci support.
Pivot: 6,083.37
1st Support: 6,027.94
1st Resistance: 6,107.21
Risk Warning:
Trading Forex and CFDs carries a high level of risk to your capital and you should only trade with money you can afford to lose. Trading Forex and CFDs may not be suitable for all investors, so please ensure that you fully understand the risks involved and seek independent advice if necessary.
Disclaimer:
The above opinions given constitute general market commentary, and do not constitute the opinion or advice of IC Markets or any form of personal or investment advice.
Any opinions, news, research, analyses, prices, other information, or links to third-party sites contained on this website are provided on an "as-is" basis, are intended only to be informative, is not an advice nor a recommendation, nor research, or a record of our trading prices, or an offer of, or solicitation for a transaction in any financial instrument and thus should not be treated as such. The information provided does not involve any specific investment objectives, financial situation and needs of any specific person who may receive it. Please be aware, that past performance is not a reliable indicator of future performance and/or results. Past Performance or Forward-looking scenarios based upon the reasonable beliefs of the third-party provider are not a guarantee of future performance. Actual results may differ materially from those anticipated in forward-looking or past performance statements. IC Markets makes no representation or warranty and assumes no liability as to the accuracy or completeness of the information provided, nor any loss arising from any investment based on a recommendation, forecast or any information supplied by any third-party.
