US500 LongHello guys.
This index has been forming a bearish/ falling flag for the past few weeks and it broke out of the channel, retested it and a bullish momentum has been formed.
My entry point for this trade is at 3800. My stop loss is placed below the previous market zone at 3720 and my targets are 3880, 3960 and 4040.
My R:R is 1: 3.
Remember, move your stop loss above the entry point when the market hits the first target(if the market tends to move according to our prediction). Risk only 1-2% of your account.
Us500idea

S&P500 Already took two long positions still holding i did not put TP yet because
I'm looking to see price react @ 3765 , if it goes above it will go to @ 3807 then break , once broken it will go all the way to @ 3905 and i will close trades

S&P 500 BEARISH OUTLOOKThe major US indices, including S&P 500, are continuing to plumed after the Fed rate decision yesterday. The interest rate reached 3.25%, as it was predicted, but the forecasts are that the interest rates will keep increasing into the entire 2023 as well, reaching levels of 4.6%
The technical indicators are suggesting a downtrend as well, MACD histogram is below the 0 line and the RSI is well below the oversold 30 line.
If the trend continues the price might test its levels at 3670, but if it reverses, it might test its previous high at 3958.
Risk Disclosure: Trading Foreign Exchange (Forex) and Contracts of Difference (CFD's) carries a high level of risk. By registering and signing up, any client affirms their understanding of their own personal accountability for all transactions performed within their account and recognizes the risks associated with trading on such markets and on such sites. Furthermore, one understands that the company carries zero influence over transactions, markets, and trading signals, therefore, cannot be held liable nor guarantee any profits or losses.

S&P 500 Weekly AnalysisS&P 500 on the daily chart. The market is still under the control of the bears. This mean that we have to look for selling opportunities more than the buy once. Let us see how the market will move on Monday.

US500 LONGS 📉📉📉📈 Expecting bullish price action on US500 as price takes out weekly lows, and has a lot of liquidity that has been build on the trendline. Looks to perfect to be true, a bullish closure above weekly low will be perfect for me to confirm the entry.
What do you think ?


SPX finds floating ground for nowHello everyone, as we all know the market action discounts everything :)
_________________________________Make sure to Like and Follow if you like the idea_________________________________
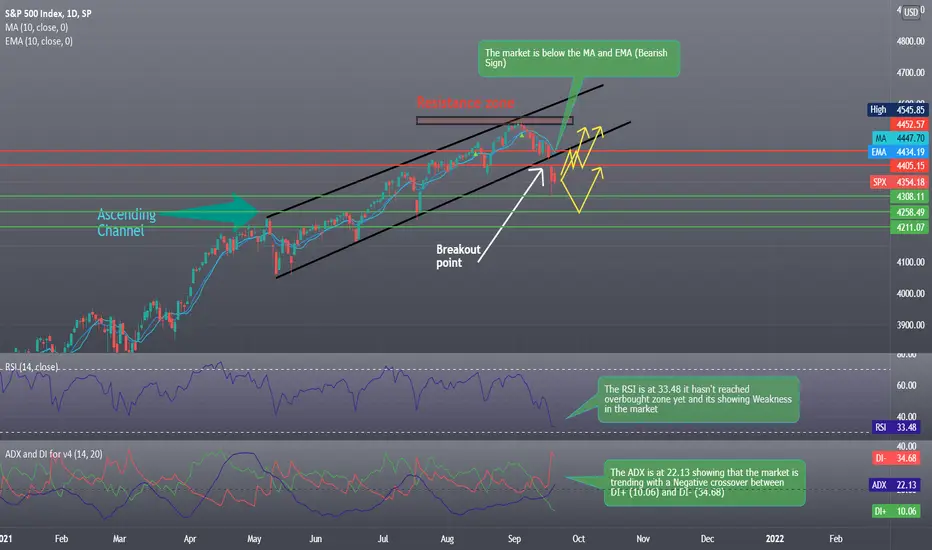
The S&P 500 index traded below its 50-day moving average, its first major breach in more than six months.
The S&P 500 was able to find a floating ground after teetering developer China Evergrande said it would pay some bond interest due on Thursday. Removing fears of a big and messy collapse that had scared investors.
The Index price has dropped 2.6% in the last couple of days but now the market seems to be stabilizing and an increase in value might start bringing the SPX back into the Ascending Channel range.
Possible Scenarios for the market if the China situation was resolved :
Scenario 1 :
If the Bulls were able to gather the force need to gain control then we will see an increase in the market that would reach the 4452.57 resistance level where we might have a small correction that will bring the price near the 4405.15 level before the index goes back into the Ascending Channel range.
Scenario 2 :
After a drop like that it could take a bit of time for the Bulls to go in and push the market up, in that time we will see the price reach the first support level located at 4308.11 where most likely the buyers will go in, but if they failed to support that line then we might see a bigger drop reaching the 4258.49 or even the 4211.07 support before going back up.
Technical analysis show :
1) The market is below the 5 10 20 50 MA and EMA (Bearish Short-Term Trend) But still above the 100 and 200 MA and EMA (Bullish Long-Term Trend)
2) The RSI is at 33.48 it hasn't reached the overbought zone yet and its showing Weakness in the market
3) The ADX is at 22.13 showing that the market is trending with a Negative crossover between DI+ (10.06) and DI- (34.68)
Daily Support & Resistance points :
support Resistance
1) 4308.11 1) 4405.15
2) 4258.49 2) 4452.57
3) 4211.07 3) 4502.19
Weekly Support & Resistance points :
support Resistance
1) 4409.33 1) 4475.22
2) 4385.67 2) 4517.45
3) 4343.44 3) 4541.11
Fundamental point of view :
Bloomberg reports that Hengda Real Estate - the main unit of troubled Chinese property developer Evergrande - will make its Thursday bond coupon payment. This hardly means Evergrande is out of the woods - indeed a restructuring at some point still remains likely - but a disorderly unwind seems off the table at the moment.
Concerns over China Evergrande Group have put investors on edge and added to recent worries over economic growth from the Delta variant.
Persistent default fears overshadowed efforts by Evergrande's chairman to boost confidence in the firm on Tuesday, while Beijing showed no signs it would intervene to stem any effects across the global economy.
Investors are waiting for the end of this week's Fed meeting that may shed light on when its massive purchase of government debt will begin to ease. According to Reuters
This is my personal opinion done with technical analysis of the market price and research online from Fundamental Analysts and News for The Fundamental point of view, not financial advice.
If you have any questions please ask and have a great day !!
Thank you for reading.
US500 1D: Possible SHORTUS500 1D: Possible SHORT
As we look at S&P500, we can see a possible fall from 4500 to 3400 in the coming months

S&P 500,LAST LEG FORMATIONUPDATED 4 hrchart of S&P 500. See how price action of 4 th leg is changing the wave pattern in to BULLISH.
if correction ends at 3818 on 11th march 12.30 (IST),BUY


SPX could MOVE UP NOW!Hey tradomaniacs,
looking at SPX500 we might get a great chance to buy very soon if the current breakout continues.
The consolidation seems to be done soon with the previous breakout and could attract more bulls to take action.
Buy-Zone would be above the resistance-zone and trendline (b) which is a high liquidity-zone looking at market-depth.
Keep in mind that LIQUIDITY and VOLUME can be very thin as US-market is closed due to Thanksgiving!
More risk on could boost Majors against US-DOLLAR.
LEAVE A LIKE AND A COMMENT - I appreciate every support! =)
Peace and good trades
Irasor
Wanna see more? Don`t forget to follow me.
Any questions? PM me. :-)

US500 - S&P500 - Sell Time - H4 ChartUS500 - S&P500 - Sell Time - H4 Chart
Blue Lines are important levels, may pull back to test highs, then down
Look for Selling Opportunities
Please support the idea with a Like 👍
Follow me to receive updates of this analysis, plus new ideas ✅
Thank you for your support 😊
Wishing you successful trading 🙏
------------------------------------------------------------------------------------
🔺 Disclaimer! The content of this analysis is subject to change at any time without notice.
🔺 It is provided for the sole purpose of assisting traders to make independent investment decisions.
🔺 You must do your own research to create your own trading plan for the market.
------------------------------------------------------------------------------------
