S&P 500 Another Alternative Bearish Perspective. 😁this chart complete over sold not go down complete all correction ready to big run 🤷 US500 .
Us500long

S&P500 (US500) - Short from bearish orderblock ✅Hello traders!
⁉️This is my analysis on US500 .
Here we are in a bearish market structure, so I am looking only for shorts. I expect a sell-off from if price fills the imbalance above and rejects from bearish orderblock.
Like, comment and subscribe to be in touch with my content!

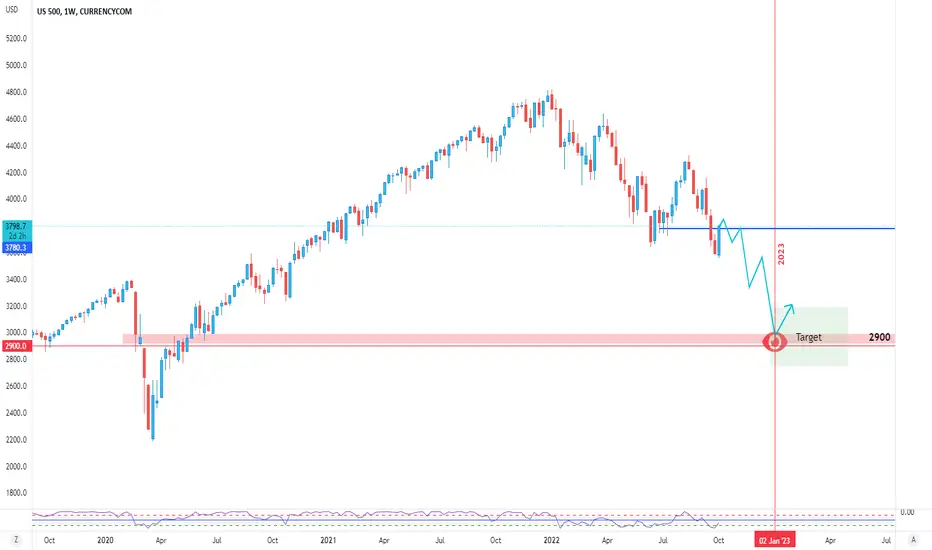
US500 long term analysI´m bearish on indicies.
We are in a seasonal bearish period with an bullish dollar that seeks yield and has also a seasonal tendecie to go higher (wich is bearish for foreign currencies and indicies)
We se commodities breaking lower lows wich is bullish for dollarn and bearish for indicies.
I think 2900 is a level that could be reach this year.
USD LongWe have reach into a bullish weekly orderblock in a seasonal bullish condition. We have a big dip in Open interest in dollar and the COT data is bullish. We are trending i everymarket so my analys says that dollar is going up this or next week.

SPX has turned positive?US500 - Intraday - We look to Buy at 3674 (stop at 3598)
Following yesterday's bullish candle, the overall trend higher looks set to continue today.
A weaker opening is expected to challenge bullish resolve.
Support is located at 3670 and should stem dips to this area.
Preferred trade is to buy on dips.
Our profit targets will be 3850 and 3900
Resistance: 3850 / 4150 / 4630
Support: 3670 / 3270 / 3000
Risk Disclaimer
The trade ideas beyond this page are for informational purposes only and do not constitute investment advice or a solicitation to trade. This information is provided by Signal Centre, a third-party unaffiliated with OANDA, and is intended for general circulation only. OANDA does not guarantee the accuracy of this information and assumes no responsibilities for the information provided by the third party. The information does not take into account the specific investment objectives, financial situation, or particular needs of any particular person. You should take into account your specific investment objectives, financial situation, and particular needs before making a commitment to trade, including seeking advice from an independent financial adviser regarding the suitability of the investment, under a separate engagement, as you deem fit.
You accept that you assume all risks in independently viewing the contents and selecting a chosen strategy.
Where the research is distributed in Singapore to a person who is not an Accredited Investor, Expert Investor or an Institutional Investor, Oanda Asia Pacific Pte Ltd (“OAP“) accepts legal responsibility for the contents of the report to such persons only to the extent required by law. Singapore customers should contact OAP at 6579 8289 for matters arising from, or in connection with, the information/research distributed.

Buying a falling knife..? SPXUS500 - Expiry in 24h - We look to Buy at 3676 (stop at 3602)
The medium term bias remains bearish.
The previous swing low is located at 3640.
Price action continues to gravitate towards crucial support levels with aggressive selling interest.
Support could prove difficult to breakdown.
We therefore, prefer to fade into the dip with a tight stop in anticipation of a move back higher.
A higher correction is expected.
Our profit targets will be 3855 and 3905
Resistance: 3855 / 3911 / 4155
Support: 3645 / 3210 / 2780
Risk Disclaimer
The trade ideas beyond this page are for informational purposes only and do not constitute investment advice or a solicitation to trade. This information is provided by Signal Centre, a third-party unaffiliated with OANDA, and is intended for general circulation only. OANDA does not guarantee the accuracy of this information and assumes no responsibilities for the information provided by the third party. The information does not take into account the specific investment objectives, financial situation, or particular needs of any particular person. You should take into account your specific investment objectives, financial situation, and particular needs before making a commitment to trade, including seeking advice from an independent financial adviser regarding the suitability of the investment, under a separate engagement, as you deem fit.
You accept that you assume all risks in independently viewing the contents and selecting a chosen strategy.
Where the research is distributed in Singapore to a person who is not an Accredited Investor, Expert Investor or an Institutional Investor, Oanda Asia Pacific Pte Ltd (“OAP“) accepts legal responsibility for the contents of the report to such persons only to the extent required by law. Singapore customers should contact OAP at 6579 8289 for matters arising from, or in connection with, the information/research distributed.


SPX 500 LONG Inverted H&SSPX 500 LONG Inverted H&S
Looking at SPX500 returning to Intraday R1 Resistance @ 4160
If market falls below 4100 trade is invalid...

BUY-SPX for 400pts wave XX to emerge as a pullback RALLY to test falling TL near 4200,
buying pressure obvious and the commodities cooled enough

SPX-turned for RecoveryEvery action there is equal and opposite reaction, 3 rd law of NEWTON.
In elliott wave theory, for every 5 wave decline there is a 3 wave recovery. up to 62%
enjoy the trend change ,and make use of it .

SPX crucial support 3636Weekly closing price is the price available for the world for two days.
It is the maximum resting time of a stock or index price, than daily or even monthly.
All investors ,traders, institutions, owners are scratching their heads for next action
So we have some logics;
Every thing is out, inflation, rate Hike, corona lock down, supply chain lock , BUT remember market is already factored in.
public is under fear of recession, market collapse ,thanks to Media for over shouting .
what they will do? they wait for Monday to sell their stocks
what smart BULLS do? they will always act fast before the public realizes
they BUY at low level (market oversold to the level of 2015 )
As per EW counts, 'Y' wave will end at 3636 (X*1.618)
as long as this level is supported by smart BULLS, we have another new Rally

Jamie Gun2Head Idea - Selling SP500Trade Idea: Selling SP500
Reasoning: Running into resistance level, time for the sellers to step in
Entry Level: 3821
Take Profit Level: 3643
Stop Loss: 3858
Risk/Reward: 4.81:1
Disclaimer – Signal Centre. Please be reminded – you alone are responsible for your trading – both gains and losses. There is a very high degree of risk involved in trading. The technical analysis , like all indicators, strategies, columns, articles and other features accessible on/though this site is for informational purposes only and should not be construed as investment advice by you. Your use of the technical analysis , as would also your use of all mentioned indicators, strategies, columns, articles and all other features, is entirely at your own risk and it is your sole responsibility to evaluate the accuracy, completeness and usefulness (including suitability) of the information. You should assess the risk of any trade with your financial adviser and make your own independent decision(s) regarding any tradable products which may be the subject matter of the technical analysis or any of the said indicators, strategies, columns, articles and all other features.

US stocks to rebound? US500
Intraday
We look to Buy at 3940 (stop at 3885)
We are trading at oversold extremes. Although the bears are in control, the stalling negative momentum indicates a turnaround is possible. This is positive for short term sentiment and we look to set longs at good risk/reward levels for a further correction higher. We look to buy dips.
Our profit targets will be 4100 and 4230
Resistance: 4105 / 4230 / 4370
Support: 3960 / 3780 / 3500
Please be advised that the information presented on TradingView is provided to Vantage (‘Vantage Global Limited’, ‘we’) by a third-party provider (‘Signal Centre’). Please be reminded that you are solely responsible for the trading decisions on your account. There is a very high degree of risk involved in trading. Any information and/or content is intended entirely for research, educational and informational purposes only and does not constitute investment or consultation advice or investment strategy. The information is not tailored to the investment needs of any specific person and therefore does not involve a consideration of any of the investment objectives, financial situation or needs of any viewer that may receive it. Kindly also note that past performance is not a reliable indicator of future results. Actual results may differ materially from those anticipated in forward-looking or past performance statements. We assume no liability as to the accuracy or completeness of any of the information and/or content provided herein and the Company cannot be held responsible for any omission, mistake nor for any loss or damage including without limitation to any loss of profit which may arise from reliance on any information supplied by Signal Centre.

Stocks to bounce today?US500
Intraday
We look to Buy at 4050 (stop at 4004)
We are trading at oversold extremes. Although the bears are in control, the stalling negative momentum indicates a turnaround is possible. A higher correction is expected. We look to buy dips.
Our profit targets will be 4180 and 4230
Resistance: 4105 / 4230 / 4370
Support: 3960 / 3780 / 3500
Please be advised that the information presented on TradingView is provided to Vantage (‘Vantage Global Limited’, ‘we’) by a third-party provider (‘Signal Centre’). Please be reminded that you are solely responsible for the trading decisions on your account. There is a very high degree of risk involved in trading. Any information and/or content is intended entirely for research, educational and informational purposes only and does not constitute investment or consultation advice or investment strategy. The information is not tailored to the investment needs of any specific person and therefore does not involve a consideration of any of the investment objectives, financial situation or needs of any viewer that may receive it. Kindly also note that past performance is not a reliable indicator of future results. Actual results may differ materially from those anticipated in forward-looking or past performance statements. We assume no liability as to the accuracy or completeness of any of the information and/or content provided herein and the Company cannot be held responsible for any omission, mistake nor for any loss or damage including without limitation to any loss of profit which may arise from reliance on any information supplied by Signal Centre.

US500 LONG IDEAGoing Busllish on S&P500
Price broke the downtrend and is at a resistance level
limiting my Stop Loss around 3900 while targeting 4680-4700 levels


S&P 500 LongPair: US500
Side: Buying Model
Entry: 4020
Stop loss: 3963
Target : 4310
Risk Ratio: 1/5

spx bottomed outc3 wave completed with negetive bias.
corrective wave A,B, completed, remaining C wave to bring SPX to maximum 62% of c3 wave.
buy above 3950 with 3895(B wave bottom) as stop loss
be cautious near neckline.
happy trading


LONG US500 ✅✅✅Here I expect bullish price action as the price took out previous daily low liquidity and rejected from bullish orderblock. The price left behind a lot of imbalances that have to be filled.

US500 LONGS ACTIVE 📉📉📉Expecting bullish price action on SP500 as price makes the draw on liquidity. Higher price action to be seen over there
What do you think ? Comment below..

US500 LONGS ACTIVE 📉📉📉Expecting bullish price action on SP500 as price makes the draw on liquidity on the weekly lows and should make a reversal move from there + h4/d1 imbalances bearish that should be filled asap.
What do you think ? Comment below..

LONG US500 ✅✅✅Here I expect bullish price action as the price took out the liquidity below previous weekly low and rejected from bullish orderblock H4, also the price has to fill the imbalances left.
