Us500. Long Targeting 4700Since Ukraine is once again the “hot topic” after the recent US comments about a possible full blown invasion from Russia here’s what we are seeing…
We lean on the optimistic scenario and we do NOT expect a meaningful escalation anytime soon, currently we are S&P500 dip buyers as we expect an easing of tensions (or simply no further escalation, which is enough to turn risk sentiment around) going forward
Obviously that can change, but right now it’s our base case, no invasion, no full conflict anytime soon, yet don’t expect it to be too straightforward, there will be plenty of volatility
Us500long

US500 LongHey traders, in the coming week we are monitoring US500 for a long term buying opportunity around 4400 zone. Once we will receive any bullish confirmation the trade will be executed.
Trade safe, Joe.

BOS - BREAK OF STRUCUTRE ✅✅✅🎯 WHAT IS BOS ?
BOS - break of strucuture. I will use market strucutre bullish or bearish to understand if the institutions are buying or selling a financial asset.
To spot a bullish/bearish market strucutre we should see a higher highs and higher lows and viceversa, to spot the continuation of the bullish market strucuture we should see bullish price action above the last old high in the strucutre this is the BOS.
🎯 BOS for me is a confirmation that price will go higher after the retracement and we are still in a bullish move
Kindly see attached photos

S&P 500 - Long as predictedAs already predicted before (see my analysis from 27.01) S&P500 is up. Now also RSI & SMA are signaling "buy" (see the intersection in the chart). The first target is the marked resistance area at 4500 and the second target is the lower line of the long-term trend channel.
If you like this analysis - thumbs up!
________
🚀 Follow for daily posts
🎯 About my posts: They are kept self-explanatory in order to avoid overcomplicating and confusion. Mostly price signals and trend analysis combined with chart patterns.
Disclaimer: This is not an investment advice

US500 LONGS 📉📉📉Expecting bullish price action on this pair as price is in a bullish trend on a HTF, taked out liquidity below 4300 closed above bullish, retraced to fill the bullish imbalance and right now we are going higher for the w1 imbalance and 4700. This is a swing entry so please remember it will take some time to capitalise
What do you think ? Comment below..

us500 long positionus500 still bullish
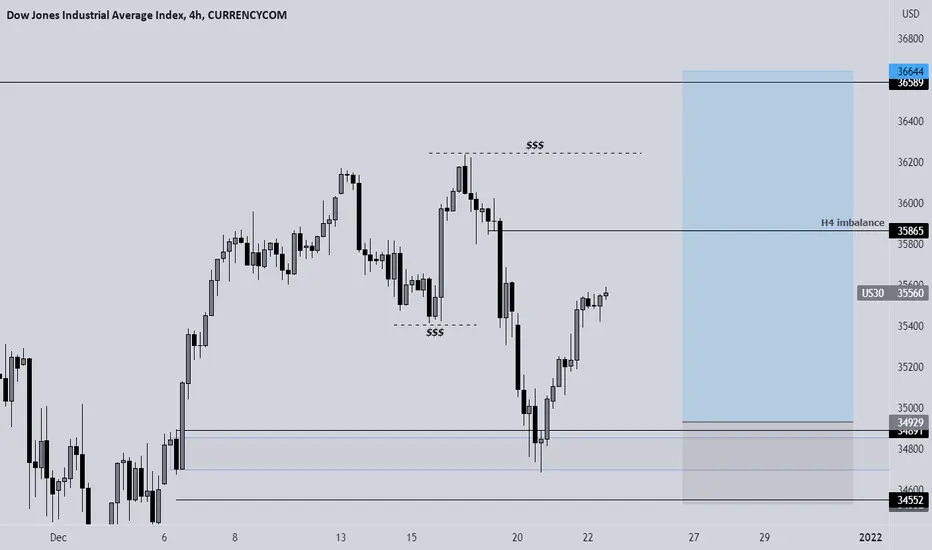
What happened?
H4 timeframe:
- bearish setup complete
- -27% , -61,8% and fib extension complete.
Daily timeframe:
- 120% Retest happened with bullish variation (always wait for h4 candle). price could go 4349.50 to test the weekly trendline as final touch
- Price "seen" to push below market structure
- Liquidity pushed price to get collect pending sell orders and stop out those who had long positions open
- Tp @ -27% and -61,8% respectively.

US500 : A simple perspective about a potential next moveUS500 : A simple perspective about a potential next move

Thoughts on s&p500 My thoughts on the us500, I recommend watching the news for any major events that could affect the chart. My main points are all annotated on the chart.

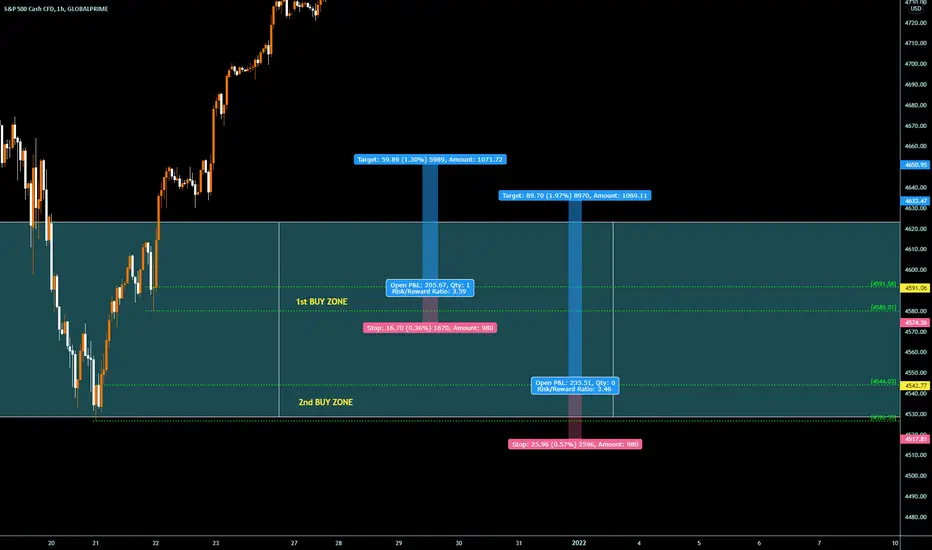
SUPPLY AND DEMAND - US500 (2-8 Jan 2022)MN Trend: Upwards
W1 Trend: price is upwards
D1 Chart:
Wait for price to retrace back to buy zone
H1 entry :
2 Buy zones identified
US500 4666.4 LONG IDEA + 0.15 % * PRICE ACTION & STRUCTUREHELLO EVERYONE
HOPE EVERYONE IS DOING GOOD HAVING A GOOD ONE, HERE'S A LOOK AT POSSIBLE SCENARIOS THAT COULD PLAY OUT IN THE COMING WEEK ON US 500 INDEX.
The index is currently trading in an ascending channel that has seen consolidation in the marked supply & demand zones.
* Tested and rejected the base of this structure creating a double bottom at the base pushing the bullish bias overall.
* A BREAK ABOVE of the circled candle and close triggers long entry on the index.
- looking for continuation with the bulls targeting the supply zone.
lets see how it goes.
IF THIS IDEA ASSISTS IN ANY OR IF YOU LIKE THIS ONE
SMASH THAT LIKE BUTTON & LEAVE A COMMENT.
ALWAYS APPRECIATED
____________________________________________________________________________________________________________________
* Kindly follow your entry rules on entries & stops. |* Some of The idea's may be predictive yet are not financial advice or signals. | *Trading plans can change at anytime reactive to the market. | * Many stars must align with the plan before executing the trade, kindly follow your rules & RISK MANAGEMENT.
_____________________________________________________________________________________________________________________
| * ENTRY & SL -KINDLY FOLLOW YOUR RULES | * RISK-MANAGEMENT | *PERIOD - SWING TRADE

VIX LONGS RISK OFF ✅✅✅Expect the VIX to close the bullish GAP right into NY session then reverse from psychological barrier 18.00
What do you think ? Comment below?

VIX SHORTS RISK ON ✅✅✅Expect the price to reach 15.00 on VIX as we have bearish momentum increasing on the H4 and santa claus rally that means markets are in a risk on market environment.
What do you think ? Comment below..

US30 LONGS UPDATE 📉📉📉We are in profit on this trade, i expect bullish price action way above liquidity pool and new ATH"s to be formed, vix is down and we are in a risk on market environment that should support our long idea.
What do you think ? Comment below..
NASDAQ LONGS UPDATE 📉📉📉Expect the price to reach weekly high and close all the bearish imbalances, vix is down we are in a risk on market environment and indexes should rise+santa claus rally that is coming next week.
What do you think ? Comment below..

US500 - swing trading plan and technical analysisThe major US index is ''suffering'' a healthy correction from around 4750 ATH set in November roughly 2 weeks ago!
The volatility is quite high, thus the risk has increased in addition to potential return. You know how it works...
...higher risk - higher return.
At the moment my total stock market exposure is around $50k and from current level I am planning to hold at least until 4900, which means around 7.2% profit potential at the time of writing.
Also I am ready to double my total speculative exposure based on the scenarios you can see on the chart.
Fundamentally we have the potential to grow.
Omicron might end the covid pandemic, due to its' not so severe effect. Tapering means that the US economy is healthy and can sustain itself without drug money.
The US yields should not grow extremely. Oil market is in balance right now and backwardation is almost gone.
Reopening economy stocks potentially can be well-bid. Major tech stocks are also having bright future earnings outlook.
Risk and money management is very important.
Patience as well.

VIX LONGS ✅✅✅I see bullish price action on VIX as we are approaching an important area of support if you will, price closed all the bullish gaps made on the last week's panic and right now its going in my opinion to close bearish gap near 28$.
This means RISK OFF in the markets this means SHORT INDEXES.
What do you think ? Comment below..

US500 Daily UpdateWe are currently stalking a long position on us500 , waiting on a crossover to green on MACD to confirm buyers

New ath on US500??Long till go wrong. This is rule n.1 after pandemic crash.
You can see on the chart, US500 is still going up with small correction. Corrections are usually around 5%.
Trading in this range is very simple.
Take long on supports and sell on resistance.
But it's also important to be carefull, bcs everybody are starting bullish and this is time to be bearish. In the market can not win everybody.
When this index is in the channel, there is still good oportunity to take longs.

SUPPLY AND DEMAND - US500As of 21 Nov 2021
WK TF - long term bias
D1 Direction
Price retracing, to continue uptrend
H4 intermediate TF
For 1H ENTRY: wait for price to retrace back into GREEN zone before setting BUY orders
For 15M ENTRY: Price must break 1H supply zone before setting BUY orders
(CLEAN VIEW)
TP: 3:1

SOME MORE FUEL LEFT IN SPXTHE RESULT season will make some extension(not beyond 1.618 of W)in wave ''Y''
EXPECT 55 failure @ 4533 or overshoot @ 4658

S&P500 over 4500 this weekIn this chart there is a GREEN area that identifies the area where buyers support the market.
Probably during this week, we could see the S&P500 going below 4435 and then over 4500.
The market seemes to be Bullish on the long run but the interest rates dynamics on the long run could affect this bullish trend. A CUT on the interest rates could be a significant event for a Bearish trend.

US Market Technicals Ahead (27 September – 1 October 2021)Expect markets to remain at last week’s levels of raised volatility for the final week of the third quarter with investors keeping an eye on fresh economic data for the US including the ISM Manufacturing PMI and PCE inflation. Fed Chair Powell will also testify on Coronavirus and CARES Act before the Senate and lawmakers will try to pass a funding plan to avoid a government shutdown on October 1st.
The Evergrande limbo is set to continue as markets expect an update on interest payment for a dollar-denominated bond and hope a default could be avoided. The 2-days ECB Forum on Central Banking will be keenly watched for more clues on the monetary policy outlook and traders will also pay attention to the outcome of the German federal election.
Here’s what you need to know to start your week.

US Market Technicals Ahead (20 September – 24 September 2021)This Wednesday’s Fed policy announcement will be the main directional driver for equity markets as investors will be expecting to hear if the central bank will begin withdrawing stimulus this year. Several policymakers have been calling for early tapering despite the recent slowdown in inflation numbers.
On the economic data front, notable publications include building permits and housing starts, the flash Markit PMI survey, new and existing home sales. Several other central banks will also hold meetings in the week ahead, including the Bank of Japan and the Bank of England.
Meanwhile, embattled Chinese property developer Evergrande (HK:3333) faces the prospect of defaulting on its debts, stoking fears of contagion that could spread to markets outside of China.
Here’s what you need to know to start your week.
S&P500 (US Market)
With stocks struggling in this seasonally weak month for the market, all three major averages are negative month to date , but still sit less than 3% below their all-time highs.
The benchmark index $SPX ended with week on consecutive losses, posting a further loss of -0.97% (-43.3 points). The Federal Reserve’s highly anticipated September meeting is set to occur this week. Fed Chair Jerome Powell will hold a press conference Wednesday at the conclusion of the two-day meeting. Investors are awaiting for more specifics about the Fed’s tapering of its easy monetary policy, particularly after mixed economic data released over the past weeks.
$SPX breached its 20DMA and 50DMA support, currently trading at the support zone of its medium term trend channel. This is the 7th occurrence since 25th March 2021, where $SPX would rebound in the immediate week and swing towards another all time high.
The immediate support to watch for $SPX this week is at 4,375 level; a significant 2ATR breakdown from its current up trend channel, a first sign of weakness in this mid-term rally.
Federal Reserve meeting
The Fed will begin its two-day policy meeting starting Tuesday ahead of its policy announcement on Wednesday afternoon and investors will be on the lookout for any details of the central bank’s plans to start paring back its $120 billion a month emergency stimulus program.
The Fed’s timeline for scaling back economic stimulus is important as it represents a first step towards eventual interest rate hikes.
Several Fed officials have said tapering should start this year, a view Fed Chair Jerome Powell may echo, while stressing a rate hike is still way off.
The Fed may stick to a cautious approach giving economic uncertainty due to rising COVID-19 cases and a weak jobs report for August.
Economic data
The U.S. data calendar for the week ahead is centered around housing figures, which are set to stabilize after a slight uptick in mortgage approvals for home purchases in recent weeks.
Data on housing starts and building permits data are due out on Tuesday, followed by figures on existing home sales on Wednesday and data on new home sales is due for release on Friday.
Market watchers will also be looking at Thursday’s report on initial jobless claims amid concerns over the hit to the economic recovery in the current quarter from the spread of the Delta coronavirus variant, especially among people who are hesitant to take vaccines.
Central bank meetings
Besides the Fed, several other major global central banks are also holding meetings in the coming days.
The Bank of Japan, which also meets on Tuesday and Wednesday, is widely expected to keep policy steady but may warn about growing risks to exports from supply disruptions.
On Thursday, Norway’s central bank is set to become the first from the developed world to hike rates since the pandemic, likely raising its main 0% rate to 0.25%.
The Bank of England is unlikely to change policy at its Thursday meeting but may indicate whether it still views inflation as transitory.
Crunch time for Evergrande
Indebted Chinese property developer Evergrande has a bond interest payment of $83.5 million due on Thursday, with investors pricing in a high likelihood of default.
That such a tiny amount could be the tipping point for a $355 billion behemoth with more than 1,300 developments across China and over $300 billion of liabilities shows how bad things are.
China’s second largest developer has been scrambling to raise cash, with fire sales on apartments and stake sales in its sprawling business network, but with little success.
Concerns that Evergrande could default on its debts is spilling over into China’s financial markets and even risks contagion that could spread to markets beyond China.
