Volume Trading Indicator ✅✅✅✅ Volume is an important indicator in technical analysis because it is used to measure the relative significance of a market move. The higher the volume during a price move, the more significant the move and the lower the volume during a price move, the less significant the move.
✅ Volume indicators are technical tools to evaluate a security's bull and bear power. Most look specifically at buying vs. selling pressure to determine which side is in control of price action. Others attempt to identify emotions that are moving the security at a particular time.
✅ A high positive multiplier with high volume indicates strong buying pressure which pushes the indicator higher. On the other hand, a low negative number with high volume indicates strong selling pressure which pushes the indicator lower.
✅ Down volume indicates bearish trading, while up volume indicates bullish trading. If the price of a security falls, but only on low volume, there may be other factors at work aside from a true bear turn
Do you use Volume Trading Indicator ?
Us500signals

VIX SHORTS ✅✅✅VIX shorts into 30.00 as i expect the flow of the markets into RISK ON assets meaning the volatility will go down.

US500 LONGS 📉📉📉📈 Expecting bullish price action on US500 as price takes out weekly lows, and has a lot of liquidity that has been build on the trendline. Looks to perfect to be true, a bullish closure above weekly low will be perfect for me to confirm the entry.
What do you think ?

EURAUD SHORTS 📉📉📉📉 I provide you in this example the market sentiment on EURAUD, during the last 2 weeks the RETAIL HEARD was LONG on this pair, i am sure they tried to catch the BOTTOM there.
A lesson for you never trade in the direction of the retail heard if you want to have a high probability trade.
If the retail heard is LONG on EURAUD you have to look only for shorts and avoid LONGS, very simple and good lesson to know.
Do you trade with market sentiment ?

Three White Soldiers Candlestick ✅✅✅Three white soldiers is a bullish candlestick pattern that is used to predict the reversal of the current downtrend in a pricing chart. The pattern consists of three consecutive long-bodied candlesticks that open within the previous candle's real body and a close that exceeds the previous candle's high.
🎯 To identify the three white soldiers pattern, look for three consecutive green or white candlesticks. Each must open and close progressively higher than the first. The candlesticks should have big bodies and very small (or no) wicks. As mentioned, you are likely to see the pattern at the bottom of a downtrend.
✅ What Do Three White Soldiers Tell You?
The three white soldiers candlestick pattern suggests a strong change in market sentiment in terms of the stock, commodity or pair making up the price action on the chart. When a candle is closing with small or no shadows, it suggests that the bulls have managed to keep the price at the top of the range for the session. Basically, the bulls take over the rally all session and close near the high of the day for three consecutive sessions. In addition, the pattern may be preceded by other candlestick patterns suggestive of a reversal, such as a doji.
✅ Limitations of Using Three White Soldiers
Three white soldiers can also appear during periods of consolidation, which is an easy way to get trapped in a continuation of the existing trend rather than a reversal. One of the key things to watch is the volume supporting the formation of three white soldiers. Any pattern on low volume is suspect because it is the market action of the few rather than the many.
To combat the limitation of visual patterns, traders use the three white soldiers and other such candlestick patterns in conjunction with other technical indicators like trendlines, moving averages and bands. For example, traders may look for areas of upcoming resistance before initiating a long position or look at the level of volume on the breakout to confirm that there was a high amount of dollar volume transacting. If the pattern occurred on low volume with near-term resistance, traders may wait until there is further confirmation of a breakout to initiate a long position.
Was this information valuable ?

S&P500 - "Fear Index" Singals ShortVIX9D crossed yesterday VIX30D, 3M and 6M. In addition, the price is bouncing off EMA 200. Signal for a potential short. If you pick short set Stop-loss above Ema 200 to close the position in case price goes up.
________
🚀 Follow for daily posts
🎯 About my posts: They are kept self-explanatory to avoid overcomplicating. Mostly price signals and trend analysis combined with chart patterns.
Disclaimer: This is not an investment advice

📍 Trading Styles 📍 Trading Styles
There are a lot of strategies and types of traders and investors in the financial markets, this doesn't mean you have to learn all of them. In my opinion you should try all trading types and then conclude which one suits more to your personality becuase there is no such thing as you HAVE TO trade intraday or swing or position, everything depends strictly on you.
✅ Scalping Traders
Holding positions for several minutes, in my opinion its not recommended for the newbies as you will see a lot of losses and wins during the day and this can hurt your emotions.
✅ Day Traders
Holding positions for couple hour or a day, they basically when to know ar the end of the day If they made money or not. Same recommendation as for scalping
✅ Swing Traders
Holding positions for a several days, intra-week trading. This is the recommendation for the newbies as you dont get the market feedback really fast and you can counter emotions + overtrading, usually they take 4-5 trades during the trading week.
✅ Position Traders
Holding positions for several weeks, usually this type of traders trade on a weekly-monthly basis with a focus on the fundamental analysis more than on the technical side. Recommended for experienced traders as you can get big returns with a iron patience
What type do you like or want to be ?

Why 90% of Traders Lose ? ❌ Going Full Margin
Risk management is the most important in this game because it keeps you alive, keeps your account fresh during bad market conditions.
Learn risk management first to understand how to protect your capital first of all and then learn a strategy
You have to know your risk numbers in terms of
• Risk per trade
• Daily Drawdown Limit
• Weekly Drawdown Limit
• Monthly Drawdown Limit
✅ Buying SIGNALS
Buying signals and expecting overnight succes could be bad for your trading journey, don't expect anything from anybody and start to be your signal generator
✅ Get Rich Quickly
Trading business its not getting rich overnight, its getting rich for sure on a long term basis. Don't expect succes overnight its not gonna happen i promise you.
• Trading is a marathon, not a sprint. Give it time and simply commit to the process
✅ Not Sticking to the Plan
Your trading plan is your trading bible and principles, you should respect it no matter what. Your trading plan its the only thing you can control in the markets as you can't control the price movement.
Make the plan and trade the plan.
What do you think ?

S&P 500 - Long as predictedAs already predicted before (see my analysis from 27.01) S&P500 is up. Now also RSI & SMA are signaling "buy" (see the intersection in the chart). The first target is the marked resistance area at 4500 and the second target is the lower line of the long-term trend channel.
If you like this analysis - thumbs up!
________
🚀 Follow for daily posts
🎯 About my posts: They are kept self-explanatory in order to avoid overcomplicating and confusion. Mostly price signals and trend analysis combined with chart patterns.
Disclaimer: This is not an investment advice

S&P 500 - Elliott WavesElliot waves identified in the S&P500 daily chart with support in the marked area. Possible long entry with resistance in the marked zone. The Second target is the lower boundary of the long-term trend channel.
________
🚀 Follow for daily posts
🎯 About my posts: They are kept self-explanatory in order to avoid overcomplicating and confusion. Mostly price signals and trend analysis combined with chart patterns.
Disclaimer: This is not an investment advice

US500 LONGS 📉📉📉Expecting bullish price action on this pair as price is in a bullish trend on a HTF, taked out liquidity below 4300 closed above bullish, retraced to fill the bullish imbalance and right now we are going higher for the w1 imbalance and 4700. This is a swing entry so please remember it will take some time to capitalise
What do you think ? Comment below..

Alert on S&P500CBOE S&P 500 9 Day crossing 30 day - sign for uncertainty at the market.
Watch the marked support area and lower boundary of the trend channel. If broken we can go short and expect a down trend to follow.
____
If you like this analysis thumps up and follow for more!

VIX LONGS RISK OFF ✅✅✅Expect the VIX to close the bullish GAP right into NY session then reverse from psychological barrier 18.00
What do you think ? Comment below?

Long on US500 on 15...Go long on us500, around area of value, possible retest.. stop loss and take profit around zones shown by trade tool...

VIX SHORTS RISK ON ✅✅✅Expect the price to reach 15.00 on VIX as we have bearish momentum increasing on the H4 and santa claus rally that means markets are in a risk on market environment.
What do you think ? Comment below..

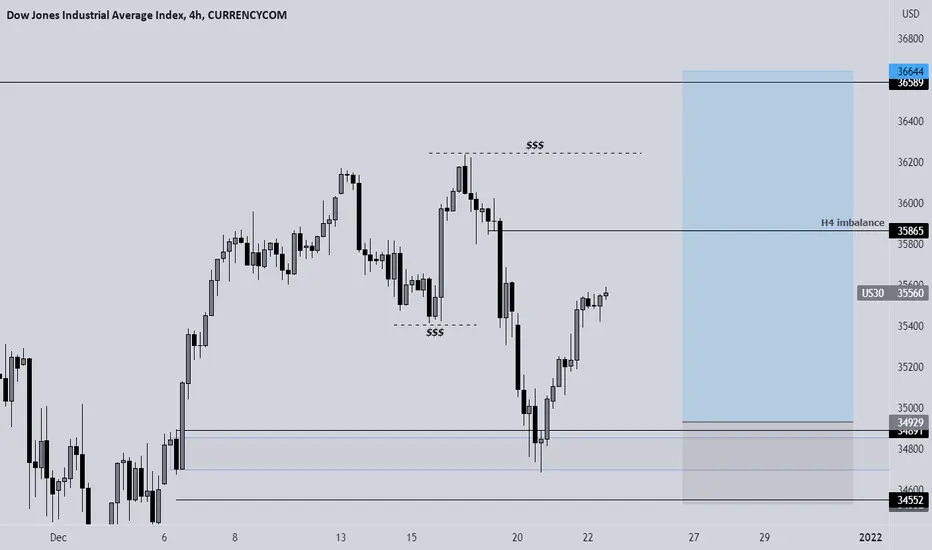
US30 LONGS UPDATE 📉📉📉We are in profit on this trade, i expect bullish price action way above liquidity pool and new ATH"s to be formed, vix is down and we are in a risk on market environment that should support our long idea.
What do you think ? Comment below..
NASDAQ LONGS UPDATE 📉📉📉Expect the price to reach weekly high and close all the bearish imbalances, vix is down we are in a risk on market environment and indexes should rise+santa claus rally that is coming next week.
What do you think ? Comment below..

VIX SHORTS 📉📉📉VIX shorts into 18.00 area, i expect price to drop there as we are in a risk off market environment.

S&P500 Solid long-term buy opportunityMy most recent S&P500 idea was a short-term one on the 4H time-frame, where I called for a pull-back and then rebound to 4740:
The target has been hit but the latest pandemic news were used as the catalyst for a new, deeper pull-back. I am switching back to the 1D time-frame where the index has just hit the 1D MA100 (green trend-line) again, for the first time since the December 03 low. As shown on the chart, this sequence has been spotted another 2 times before within this 12-month Channel Up:
a) Double Top on the Resistance, b) Pull-back, c) RSI Double Bottom and d) Rebound to the 2.0 Fibonacci Extension level
In our firm's perspective, once this formation is completed again, we expect another rebound. Our new long-term target is 4850.
--------------------------------------------------------------------------------------------------------
** Please support this idea with your likes and comments, it is the best way to keep it relevant and support me. **
--------------------------------------------------------------------------------------------------------

VIX LONGS RISK OFF ✅✅✅Looks like VIX rejected an important area of supply 18.00 psycho level and we are going to fill the bearish gap around 28.00. Risk off market sentiment in play
What do you think ? Where we head next in terms of market sentiment

VIX LONGS ✅✅✅I see bullish price action on VIX as we are approaching an important area of support if you will, price closed all the bullish gaps made on the last week's panic and right now its going in my opinion to close bearish gap near 28$.
This means RISK OFF in the markets this means SHORT INDEXES.
What do you think ? Comment below..

US500 Daily UpdateWe are currently stalking a long position on us500 , waiting on a crossover to green on MACD to confirm buyers

S&P500 Long and Short SetupS&P 500 Weekly Plan
Long Setup:
🔵 Entry Level: $4598.0
🟢 Take Profit: $4645.3 (2.05 R)
⛔ Stop Loss: $4574.9
Short Setup:
🔵 Entry Level: $4651.8
🟢 Take Profit: $4599.4 (1.59 R)
⛔ Stop Loss: $4684.7
Reasons:
1) A clear setup would be opening a long position at what was recently resistance, as it is likely to be turned into support. However, this is too obvious of a setup and I believe a lot of traders will place buy orders there, so I believe there may be a fake-out. As such, I will be waiting for a retest of that level and if it holds, I will open a long order. I am mapping this level at the moment, so that I am prepared.
2) The short order is placed at the upper trend line of the ascending channel. It has already been respected 5 times, so I will keep opening short orders until it either fails (price goes through it) or we stop testing it. With that being said, the entry may move up depending on how the price reacts in the next couple of days
