Bulls are not of the woods, not by far1. What happened yesterday?
In my weekend analysis covering US indices , I mentioned that US500 (SP500) could drop and test the ascending trend line starting back at the pandemic low. This line is confluent with the horizontal support level given by January 2022 ATH, offering a good opportunity for traders to open long positions.
Indeed, at least on CFDs and futures, this trend line was touched, and the price rebounded strongly from there.
2. Key Question:
Will we have a full V-shape recovery, or will the price drop back below 5k in the coming sessions?
3. Why I expect a continuation of the correction:
🔸 Strong Resistance: The US500 has established a robust ceiling around the 5350-5400 zone(also a gap there)
🔸 Lack of Building Momentum on Support: There's no clear indication that this resistance will be broken anytime soon with the lack of accumulation under 5k
🔸 Potential for Further Decline: Given the current market structure, a drop below 5k remains a realistic possibility in the upcoming sessions.
4. Trading Plan:
🎯 My Strategy: Playing the range.
✅ Buy near the 4800 support.
✅ Sell into the resistance zone between 5350 and 5400.
5. Conclusion:
I’m watching for market confirmations and will continue applying this range strategy until there’s a clear directional change. 🚀
Disclosure: I am part of Trade Nation's Influencer program and receive a monthly fee for using their TradingView charts in my analyses and educational articles.
Us500signals

"SPX500/US500" Index CFD Market Heist Plan (Swing/Day Trade)🌟Hi! Hola! Ola! Bonjour! Hallo! Marhaba!🌟
Dear Money Makers & Robbers, 🤑💰✈️
Based on 🔥Thief Trading style technical and fundamental analysis🔥, here is our master plan to heist the "SPX500 / US500" Index CFD Market. Please adhere to the strategy I've outlined in the chart, which emphasizes short entry. Our aim is the high-risk Green Zone. Risky level, oversold market, consolidation, trend reversal, trap at the level where traders and bullish robbers are stronger. 🏆💸Book Profits Be wealthy and safe trade.💪🏆🎉
Entry 📈 : "The vault is wide open! Swipe the Bearish loot at any price - the heist is on!
however I advise to Place sell limit orders within a 15 or 30 minute timeframe most recent or swing, low or high level.
Stop Loss 🛑: (5730) Thief SL placed at the nearest / swing high level Using the 8H timeframe swing / day trade basis.
SL is based on your risk of the trade, lot size and how many multiple orders you have to take.
Target 🎯: 5300 (or) Escape Before the Target
🧲Scalpers, take note 👀 : only scalp on the Short side. If you have a lot of money, you can go straight away; if not, you can join swing traders and carry out the robbery plan. Use trailing SL to safeguard your money 💰.
"SPX500 / US500" Index CFD Market Heist Plan (Swing/Day) is currently experiencing a bearishness,., driven by several key factors.
📰🗞️Get & Read the Fundamental, Macro Economics, COT Report, Geopolitical and News Analysis, Sentimental Outlook, Intermarket Analysis, Index-Specific Analysis, Positioning and future trend targets... go ahead to check 👉👉👉🔗
⚠️Trading Alert : News Releases and Position Management 📰 🗞️ 🚫🚏
As a reminder, news releases can have a significant impact on market prices and volatility. To minimize potential losses and protect your running positions,
we recommend the following:
Avoid taking new trades during news releases
Use trailing stop-loss orders to protect your running positions and lock in profits
💖Supporting our robbery plan 💥Hit the Boost Button💥 will enable us to effortlessly make and steal money 💰💵. Boost the strength of our robbery team. Every day in this market make money with ease by using the Thief Trading Style.🏆💪🤝❤️🎉🚀
I'll see you soon with another heist plan, so stay tuned 🤑🐱👤🤗🤩

"US500 / SPX500" Index CFD Market Heist Plan (Day or Swing)🌟Hi! Hola! Ola! Bonjour! Hallo! Marhaba!🌟
Dear Money Makers & Robbers, 🤑 💰💸✈️
Based on 🔥Thief Trading style technical and fundamental analysis🔥, here is our master plan to heist the "US500 / SPX500" Index CFD Market. Please adhere to the strategy I've outlined in the chart, which emphasizes long entry. Our aim is the high-risk Red Zone. Risky level, overbought market, consolidation, trend reversal, trap at the level where traders and bearish robbers are stronger. 🏆💸"Take profit and treat yourself, traders. You deserve it!💪🏆🎉
Entry 📈 : "The heist is on! Wait for the MA breakout (5700) then make your move - Bullish profits await!"
however I advise to Place Buy stop orders above the Moving average (or) Place buy limit orders within a 15 or 30 minute timeframe most recent or swing, low or high level.
📌I strongly advise you to set an alert on your chart so you can see when the breakout entry occurs.
Stop Loss 🛑:
Thief SL placed at the recent/swing low level Using the 2H timeframe (5600) swing trade basis.
SL is based on your risk of the trade, lot size and how many multiple orders you have to take.
🏴☠️Target 🎯: 5850 (or) Escape Before the Target
🧲Scalpers, take note 👀 : only scalp on the Long side. If you have a lot of money, you can go straight away; if not, you can join swing traders and carry out the robbery plan. Use trailing SL to safeguard your money 💰.
"US500 / SPX500" Index CFD Market Heist Plan (Swing/Day) is currently experiencing a bullishness,., driven by several key factors.
📰🗞️Get & Read the Fundamental, Macro, COT Report, Geopolitical and News Analysis, Sentimental Outlook, Intermarket Analysis, Index-Specific Analysis, Positioning and future trend targets.. go ahead to check 👉👉👉
📌Keep in mind that these factors can change rapidly, and it's essential to stay up-to-date with market developments and adjust your analysis accordingly.
⚠️Trading Alert : News Releases and Position Management 📰 🗞️ 🚫🚏
As a reminder, news releases can have a significant impact on market prices and volatility. To minimize potential losses and protect your running positions,
we recommend the following:
Avoid taking new trades during news releases
Use trailing stop-loss orders to protect your running positions and lock in profits
💖Supporting our robbery plan 💥Hit the Boost Button💥 will enable us to effortlessly make and steal money 💰💵. Boost the strength of our robbery team. Every day in this market make money with ease by using the Thief Trading Style.🏆💪🤝❤️🎉🚀
I'll see you soon with another heist plan, so stay tuned 🤑🐱👤🤗🤩

US500 CHANNELHello friends
Given that the price is in an ascending channel, now that we have a strong wave to the channel ceiling, we have corrected the price by 50%, after which we can expect the price to succeed in hitting a higher ceiling again.
*Trade safely with us*

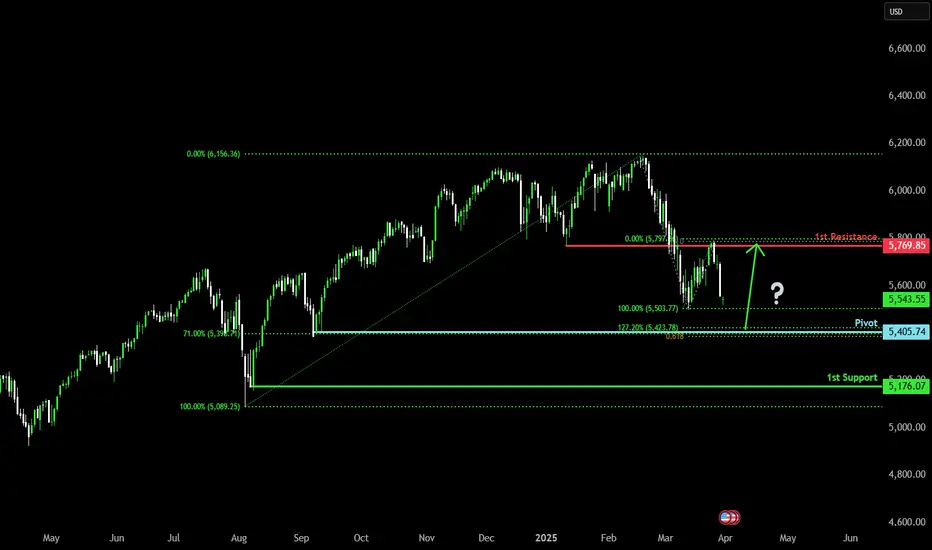
Falling towards pullback support?S&P500 (US500) is falling towards the pivot which acts as a pullback support and could bounce to the 1st resistance which is an overlap resistance.
Pivot: 5,405.74
1st Support: 5,176.07
1st Resistance: 5,769.85
Risk Warning:
Trading Forex and CFDs carries a high level of risk to your capital and you should only trade with money you can afford to lose. Trading Forex and CFDs may not be suitable for all investors, so please ensure that you fully understand the risks involved and seek independent advice if necessary.
Disclaimer:
The above opinions given constitute general market commentary, and do not constitute the opinion or advice of IC Markets or any form of personal or investment advice.
Any opinions, news, research, analyses, prices, other information, or links to third-party sites contained on this website are provided on an "as-is" basis, are intended only to be informative, is not an advice nor a recommendation, nor research, or a record of our trading prices, or an offer of, or solicitation for a transaction in any financial instrument and thus should not be treated as such. The information provided does not involve any specific investment objectives, financial situation and needs of any specific person who may receive it. Please be aware, that past performance is not a reliable indicator of future performance and/or results. Past Performance or Forward-looking scenarios based upon the reasonable beliefs of the third-party provider are not a guarantee of future performance. Actual results may differ materially from those anticipated in forward-looking or past performance statements. IC Markets makes no representation or warranty and assumes no liability as to the accuracy or completeness of the information provided, nor any loss arising from any investment based on a recommendation, forecast or any information supplied by any third-party.

Bullish momentum to extend?S&P500 (US500) is falling towards the pivot which is a pullback support and could bounce to the 1st resistance which acts as a pullback resistance.
Pivot: 5,671.90
1st Support: 5,599.90
1st Resistance: 5,843.10
Risk Warning:
Trading Forex and CFDs carries a high level of risk to your capital and you should only trade with money you can afford to lose. Trading Forex and CFDs may not be suitable for all investors, so please ensure that you fully understand the risks involved and seek independent advice if necessary.
Disclaimer:
The above opinions given constitute general market commentary, and do not constitute the opinion or advice of IC Markets or any form of personal or investment advice.
Any opinions, news, research, analyses, prices, other information, or links to third-party sites contained on this website are provided on an "as-is" basis, are intended only to be informative, is not an advice nor a recommendation, nor research, or a record of our trading prices, or an offer of, or solicitation for a transaction in any financial instrument and thus should not be treated as such. The information provided does not involve any specific investment objectives, financial situation and needs of any specific person who may receive it. Please be aware, that past performance is not a reliable indicator of future performance and/or results. Past Performance or Forward-looking scenarios based upon the reasonable beliefs of the third-party provider are not a guarantee of future performance. Actual results may differ materially from those anticipated in forward-looking or past performance statements. IC Markets makes no representation or warranty and assumes no liability as to the accuracy or completeness of the information provided, nor any loss arising from any investment based on a recommendation, forecast or any information supplied by any third-party.

US500(UPDATE)Hello friends
Given the downward trend we had, the price has reached a good support area and if the area is maintained, you can enter a buy trade and move to the specified targets with it.
*Trade safely with us*

Bullish rebound?S&P500 (US500) is reacting off the pivot and could bounce to the 1st resistance.
Pivot: 5,539.65
1st Support: 5,385.10
1st Resistance: 5,831.56
Risk Warning:
Trading Forex and CFDs carries a high level of risk to your capital and you should only trade with money you can afford to lose. Trading Forex and CFDs may not be suitable for all investors, so please ensure that you fully understand the risks involved and seek independent advice if necessary.
Disclaimer:
The above opinions given constitute general market commentary, and do not constitute the opinion or advice of IC Markets or any form of personal or investment advice.
Any opinions, news, research, analyses, prices, other information, or links to third-party sites contained on this website are provided on an "as-is" basis, are intended only to be informative, is not an advice nor a recommendation, nor research, or a record of our trading prices, or an offer of, or solicitation for a transaction in any financial instrument and thus should not be treated as such. The information provided does not involve any specific investment objectives, financial situation and needs of any specific person who may receive it. Please be aware, that past performance is not a reliable indicator of future performance and/or results. Past Performance or Forward-looking scenarios based upon the reasonable beliefs of the third-party provider are not a guarantee of future performance. Actual results may differ materially from those anticipated in forward-looking or past performance statements. IC Markets makes no representation or warranty and assumes no liability as to the accuracy or completeness of the information provided, nor any loss arising from any investment based on a recommendation, forecast or any information supplied by any third-party.

US500/SPX500 "Standard & Poor" Indices CFD Market Heist Plan🌟Hi! Hola! Ola! Bonjour! Hallo! Marhaba!🌟
Dear Money Makers & Thieves, 🤑 💰🐱👤🐱🏍
Based on 🔥Thief Trading style technical and fundamental analysis🔥, here is our master plan to heist the ˗ˏˋ ★ ˎˊ˗US500/SPX500 "Standard & Poor" ˗ˏˋ ★ ˎˊ˗ Indices Market. Please adhere to the strategy I've outlined in the chart, which emphasizes short entry. Our aim is the high-risk Green Zone. Risky level, oversold market, consolidation, trend reversal, trap at the level where traders and bullish thieves are getting stronger. 🏆💸Book Profits Be wealthy and safe trade.💪🏆🎉
Entry 📈 : "The vault is wide open! Swipe the Bearish loot at any price - the heist is on! profits await!" however I advise placing Sell limit orders within a 15 or 30 minute timeframe. Entry from the most recent or swing low or high level should be in retest.
Stop Loss 🛑: Thief SL placed at (5920.0) swing Trade Basis Using the 4H period, the recent / swing high or low level.
SL is based on your risk of the trade, lot size and how many multiple orders you have to take.
Target 🎯: 5600.0 (or) Escape Before the Target
🧲Scalpers, take note 👀 : only scalp on the Short side. If you have a lot of money, you can go straight away; if not, you can join swing traders and carry out the robbery plan. Use trailing SL to safeguard your money 💰.
📰🗞️Fundamental, Macro, COT Report, Index-Specific Analysis, Market Sentimental Outlook:👇🏻
US500/SPX500 "Standard & Poor" Indices CFD Market is currently experiencing a Bearish trend in short term,{{{(>HIGH CHANCE FOR BULLISHNESS IN FUTURE<)}}} driven by several key factors.
🔰Fundamental Analysis
Fundamental factors underpin the S&P 500’s performance:
Economic Indicators:
GDP Growth: Assumed at 2.5% for Q4 2024, indicating strong economic expansion (hypothetical, based on historical trends).
Inflation: CPI at 2.2%, in line with the Fed’s target, supporting stable growth (assumed from recent data).
Unemployment: At 3.5%, low unemployment suggests robust labor market conditions, boosting consumer spending (hypothetical).
Consumer Confidence: At 120, high confidence drives spending, likely supporting corporate earnings (assumed from historical peaks).
Federal Reserve Policy:
Rates at 3.00-3.25%, down from 4% in 2024, with one more cut expected to 2.75-3.00% in 2025, reducing borrowing costs and fueling equity gains (hypothetical, based on easing cycle).
Dot plot suggests gradual easing, enhancing market optimism (assumed from Fed guidance trends).
Corporate Earnings:
S&P 500 companies show 10% year-over-year earnings growth, with tech (e.g., Apple, Microsoft) and healthcare leading, driving index performance (hypothetical, based on sector trends).
Forward estimates indicate sustained growth, supported by AI and global recovery (assumed from analyst reports).
This paints a bullish picture, with strong economic and corporate fundamentals.
🔰Macroeconomic Factors
Broader economic conditions influencing the S&P 500 include:
Global Economy:
China at 5% growth, Europe stable at 1.2% (Eurostat), no major recessions forecasted—neutral to bullish, as global demand supports US multinationals (hypothetical, based on ECB forecasts).
Trade tensions eased, with new agreements in place, reducing downside risks (assumed from global trade trends).
Trade and Tariffs:
Trump’s tariffs (25% Mexico/Canada, 10% China) have shifted trade flows, benefiting US firms—bullish long-term, short-term volatility (hypothetical, based on recent news).
Currency Movements:
USD stable, DXY at 100—neutral impact, as a strong dollar could hurt exports but supports domestic focus (assumed from forex trends).
Oil Prices:
At $75 per barrel, stable energy costs support consumer spending—neutral to bullish (hypothetical, based on OPEC data).
Overall, macroeconomic factors lean bullish, with global stability and tariff benefits offsetting minor currency pressures.
🔰Commitments of Traders (COT) Data
COT data from CME Group (hypothetical for March 2025):
Large Speculators: Net long ~60,000 contracts, down from 70,000 post-2024 highs—cautious bullishness, suggesting room for further gains.
Commercial Hedgers: Net short ~65,000 contracts—stable, locking in gains, neutral impact.
Open Interest: ~130,000 contracts—high, indicating strong market participation, bullish signal.
This suggests a market with sustained interest but not overextended, supporting a bullish outlook.
🔰Index-Specific Analysis
Technical and structural factors specific to the S&P 500:
Moving Averages: Price at 5760.0 is above the 50-day (5750) and 200-day (5600) moving averages—bullish signal.
Support and Resistance: Support at 5600 (recent low), resistance at 5900 (psychological level)—current price near resistance, consolidation likely.
Volatility: Implied volatility from options at 15%, suggesting expected 225-point daily range (±1.5%)—neutral, room for moves.
Market Breadth: 70% of stocks above 200-day MA, advance-decline ratio at 1.5—broad participation, bullish.
Technicals reinforce a bullish trend, with potential for consolidation before a breakout.
🔰Market Sentimental Analysis
Investor psychology and market mood:
Investor Surveys: 60% bullish (hypothetical, based on AAII trends)—strong optimism, bullish.
Social Media: Positive (e.g., market analyst predicting new highs)—bullish sentiment.
Fear and Greed Index: At 75 (greed, hypothetical)—high optimism, potential for correction, neutral short-term.
News Flow: Mixed, with earnings beats driving gains, but tariff uncertainty noted—neutral.
Sentiment is overwhelmingly bullish, though greed levels suggest caution for short-term pullbacks.
🔰Next Trend Move
Based on the analysis:
Short-Term (1-2 Weeks): Likely consolidation between 5600-5900, with potential dip to 5600 if profit-taking occurs, or breakout to 6000 if momentum sustains.
Medium-Term (1-3 Months): Break above 5900 to new highs (e.g., 6100) if Fed cuts materialize and earnings beat expectations.
Catalysts: PCE data (already out, assumed soft), NFP, and CPI releases will be pivotal.
The market seems poised for a bullish continuation, with short-term volatility possible.
🔰Overall Summary Outlook
The S&P 500 at 5760.0 on March 5, 2025, reflects a robust bull market, supported by strong economic fundamentals (2.5% GDP, 10% earnings growth), a dovish Fed (rates at 3.00-3.25%, expected cuts), and broad market participation (70% above 200-day MA). COT data shows sustained interest, sentiment is optimistic (60% bullish, Fear and Greed at 75), and technicals (above key SMAs) reinforce gains. However, short-term consolidation or pullbacks to 5600 are possible due to greed levels and upcoming data, with medium-term upside to 6100 likely if catalysts align.
🔰Future Prediction
Given the analysis, the future prediction is Bullish, with short-term consolidation (5600-5900) and medium-term potential to 6100, driven by economic strength and Fed easing.
📌Keep in mind that these factors can change rapidly, and it's essential to stay up-to-date with market developments and adjust your analysis accordingly.
⚠️Trading Alert : News Releases and Position Management 📰 🗞️ 🚫🚏
As a reminder, news releases can have a significant impact on market prices and volatility. To minimize potential losses and protect your running positions,
we recommend the following:
Avoid taking new trades during news releases
Use trailing stop-loss orders to protect your running positions and lock in profits
💖Supporting our robbery plan 💥Hit the Boost Button💥 will enable us to effortlessly make and steal money 💰💵. Boost the strength of our robbery team. Every day in this market make money with ease by using the Thief Trading Style.🏆💪🤝❤️🎉🚀
I'll see you soon with another heist plan, so stay tuned 🤑🐱👤🤗🤩

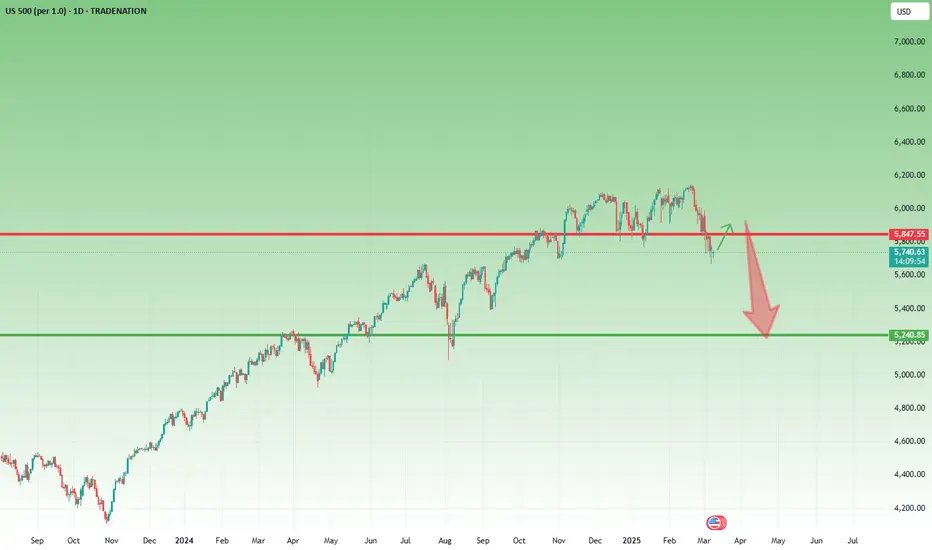
Bearish Outlook for US500: Watching 5,200 SupportAfter testing support at the end of February, the US500 fell below this key level at the start of March, signaling the potential for a deeper correction.
In my view, this scenario is likely, and any rebound this week could present a good selling opportunity for speculators.
My target for this correction is the 5,200 support zone. A stabilization above 6,000 would invalidate this outlook.
Disclosure: I am part of Trade Nation's Influencer program and receive a monthly fee for using their TradingView charts in my analyses and educational articles.
US500:UPDATEHello friends
We witnessed a price drop due to the price reaching an important resistance.
Now, buyers have entered an important support area and by maintaining the support area, we can see the specified price targets.
*Trade safely with us*

US500 NEW PRICE !hello friends
As you can see, this index tried to break its ceiling 2 times, which faced correction, but in the third encounter, it succeeded in breaking the ceiling and was able to give this signal that the price can go up to 6200 or even higher.
*Trade safely with us*

S&P500 - Long from bullish OB !!Hello traders!
‼️ This is my perspective on US500.
Technical analysis: Here we are in a bullish market structure from 4H timeframe perspective, so I look for a long. My point of interest is imbalance filled + rejection from bullish OB.
Like, comment and subscribe to be in touch with my content!

US500 BUYhello friends
Considering that the price is in the ascending channel, we expect the price to move up to our target, which is the green line.
Or break the specified support and start moving from the bottom of the channel.
*Trade safely with us*

Bullish continuation?S&P500 (US500) is falling towards pivot which has been identified as a pullback support and could bounce to the 1st resistance which acts as a pullback resistance.
Pivot: 6,034.09
1st Support: 5,984.27
1st Resistance: 6,125.76
Risk Warning:
Trading Forex and CFDs carries a high level of risk to your capital and you should only trade with money you can afford to lose. Trading Forex and CFDs may not be suitable for all investors, so please ensure that you fully understand the risks involved and seek independent advice if necessary.
Disclaimer:
The above opinions given constitute general market commentary, and do not constitute the opinion or advice of IC Markets or any form of personal or investment advice.
Any opinions, news, research, analyses, prices, other information, or links to third-party sites contained on this website are provided on an "as-is" basis, are intended only to be informative, is not an advice nor a recommendation, nor research, or a record of our trading prices, or an offer of, or solicitation for a transaction in any financial instrument and thus should not be treated as such. The information provided does not involve any specific investment objectives, financial situation and needs of any specific person who may receive it. Please be aware, that past performance is not a reliable indicator of future performance and/or results. Past Performance or Forward-looking scenarios based upon the reasonable beliefs of the third-party provider are not a guarantee of future performance. Actual results may differ materially from those anticipated in forward-looking or past performance statements. IC Markets makes no representation or warranty and assumes no liability as to the accuracy or completeness of the information provided, nor any loss arising from any investment based on a recommendation, forecast or any information supplied by any third-party.

S&P500 - Short after BOS !!Hello traders!
‼️ This is my perspective on S&P500.
Technical analysis: Here we are in a bearish market structure from 4H timeframe perspective, so I look for a short. We have hidden divergence for sell on H4 and regular divergence on H1, so after BOS I will open a short.
Like, comment and subscribe to be in touch with my content!

S&P500 INDEX (US500): Bearish Move From Resistance
Amid the uncertainty caused by the recent actions of Trump,
US500 may continue the intraday bearish movement.
The market may reach at least 5994 level soon.
❤️Please, support my work with like, thank you!❤️

us500 buyhello friends
Considering the rise we had, now with the failure of trading range, we can enter into a transaction with capital management...
*Trade safely with us*

Bullish bounce?S&P500 (US500) is falling towards the pivot and c ould bounce to the 1st resistance.
Pivot: 5,981.20
1st Support: 5,822.54
1st Resistance: 6,174.50
Risk Warning:
Trading Forex and CFDs carries a high level of risk to your capital and you should only trade with money you can afford to lose. Trading Forex and CFDs may not be suitable for all investors, so please ensure that you fully understand the risks involved and seek independent advice if necessary.
Disclaimer:
The above opinions given constitute general market commentary, and do not constitute the opinion or advice of IC Markets or any form of personal or investment advice.
Any opinions, news, research, analyses, prices, other information, or links to third-party sites contained on this website are provided on an "as-is" basis, are intended only to be informative, is not an advice nor a recommendation, nor research, or a record of our trading prices, or an offer of, or solicitation for a transaction in any financial instrument and thus should not be treated as such. The information provided does not involve any specific investment objectives, financial situation and needs of any specific person who may receive it. Please be aware, that past performance is not a reliable indicator of future performance and/or results. Past Performance or Forward-looking scenarios based upon the reasonable beliefs of the third-party provider are not a guarantee of future performance. Actual results may differ materially from those anticipated in forward-looking or past performance statements. IC Markets makes no representation or warranty and assumes no liability as to the accuracy or completeness of the information provided, nor any loss arising from any investment based on a recommendation, forecast or any information supplied by any third-party.

SPX500 SELL...Hello guys
Considering that the price reaches the resistance range, we can enter into the transaction with capital and risk management.
*Trade safely with us*

US500 sellhello friends
I hope you are well.
By forming this pattern, we can enter into a sales transaction with capital management.
If you want an analysis, send us a message.
*Trade safely with us*

"US500 / SPX500" Indices Market Bullish Heist Plan🌟Hi! Hola! Ola! Bonjour! Hallo!🌟
Dear Money Makers & Robbers, 🤑 💰
Based on 🔥Thief Trading style technical and fundamental analysis🔥, here is our master plan to heist the "US500 / SPX500" Indices market. Please adhere to the strategy I've outlined in the chart, which emphasizes long entry. Our aim is the high-risk Red Zone. Risky level, overbought market, consolidation, trend reversal, trap at the level where traders and bearish robbers are stronger. Be wealthy and safe trade.💪🏆🎉
Entry 📈 : You can enter a Bull trade after the breakout of MA level 5960 (OR) Entry in Pullback 5820
Stop Loss 🛑: Using the 2H period, the recent / nearest low or high level.
Goal 🎯: 6100 (or) escape Before the Target
Scalpers, take note 👀 : only scalp on the Long side. If you have a lot of money, you can go straight away; if not, you can join swing traders and carry out the robbery plan. Use trailing SL to safeguard your money 💰.
Warning⚠️ : Our heist strategy is incompatible with Fundamental Analysis news 📰 🗞️. We'll wreck our plan by smashing the Stop Loss 🚫🚏. Avoid entering the market right after the news release.
Fundamental Outlook 📰🗞️
Based on the fundamental analysis, I would conclude that the US500 / SPX500 is : Bullish
Reasons:
US economic growth: The US economy is expected to grow at a rate of 2.5% in 2023, driven by a strong labor market, increasing business investment, and a rebound in the housing market.
Monetary policy support: The Federal Reserve has kept interest rates at a low level of 1.5%, which is expected to support borrowing and spending in the economy.
Fiscal policy support: The US government has announced a series of fiscal stimulus measures, including tax cuts and infrastructure spending, which are expected to support economic growth.
Corporate earnings growth: US companies are expected to report increasing earnings in 2023, driven by a strong global economy and a competitive dollar.
Valuation: The US500 / SPX500 is currently trading at a relatively high valuation, with a price-to-earnings ratio of 20, but this is still below its historical average.
However, it's essential to consider the following risks:
Global economic slowdown: A slowdown in global economic growth could reduce demand for US stocks and drive down the index.
Trade tensions: Escalating trade tensions between the US and other countries, particularly China, could impact the US trade balance and economic growth.
Inflation concerns: Rising inflation could lead to higher interest rates, which could negatively impact the economy and the stock market.
Key Fundamental Indicators:
US GDP growth: 2.5% (2023 estimate)
Unemployment rate: 3.5% (2023 estimate)
Inflation rate: 2.0% (2023 estimate)
Interest rates: 1.5% (2023 estimate)
Corporate earnings growth: 10.0% (2023 estimate)
Market Sentiment:
Bullish sentiment: 75%
Bearish sentiment: 25%
Neutral sentiment: 0%
Please note that this is a general analysis and not personalized investment advice. It's essential to consider your own risk tolerance and market analysis before making any investment decisions.
Take advantage of the target and get away 🎯 Swing Traders Please reserve the half amount of money and watch for the next dynamic level or order block breakout. Once it is resolved, we can go on to the next new target in our heist plan.
Keep in mind that these factors can change rapidly, and it's essential to stay up-to-date with market developments and adjust your analysis accordingly.
💖Supporting our robbery plan will enable us to effortlessly make and steal money 💰💵 Tell your friends, Colleagues and family to follow, like, and share. Boost the strength of our robbery team. Every day in this market make money with ease by using the Thief Trading Style.🏆💪🤝❤️🎉🚀
I'll see you soon with another heist plan, so stay tuned 🫂
