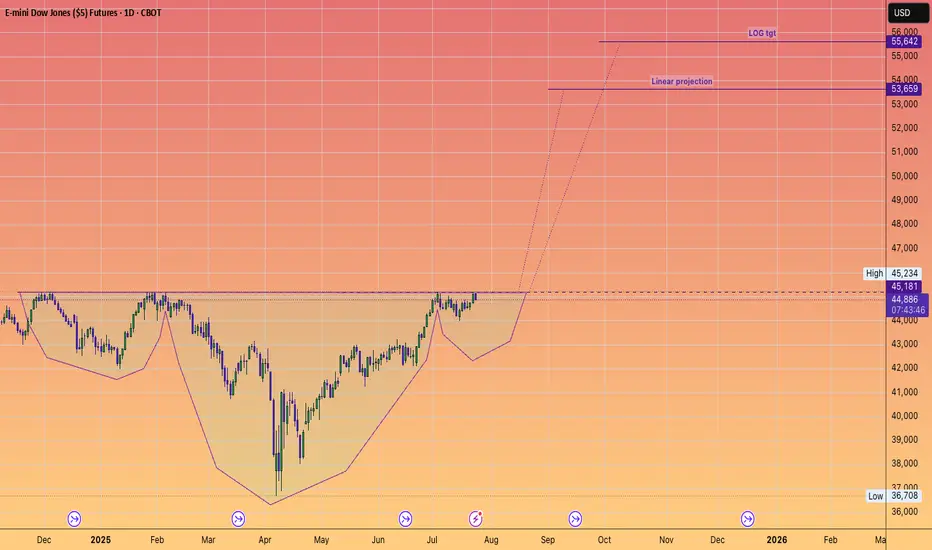
DOW JONES to 55,642#InverseHead&Shoulders
Projects record new highs.
Another stepping stone to our long held forecast of 64,000
Why?
Because AI will significantly contribute to an EXPANDING #GDP
USA
AMD 1W: If Not Now — Then When?The weekly chart of AMD looks like it’s holding its breath: a well-defined falling wedge, double bottom support, and price pressing right against long-term trendline resistance. Everything’s in place — now it just needs to break and run, preferably without tripping over nearby Fibonacci levels.
The stock is trading around $114 and attempting to hold above the 50-week MA. Just ahead is the 200-week MA (~131) — not only a technical hurdle but also a psychological pivot. A move above it could reignite talk of $150+ targets.
The wedge has been narrowing since late 2024. After repeated bounces off support, price has returned to the top of the pattern. A confirmed weekly close above the wedge could trigger a real breakout. Without that — it risks yet another scripted pullback.
Key Fibonacci levels:
0.618 — $133.60
0.5 — $151.42
0.382 — $169.25
0.236 — $191.30
0.0 — $226.95 (all-time high)
The roadmap looks clean — but only if volume follows through. There are signs of quiet accumulation at the bottom, but no explosive buying just yet.
Fundamentals:
AMD delivered solid Q1 results: revenue is growing, EPS beat expectations, and margins are holding. More importantly, the company launched a new $6 billion stock buyback program — showing clear internal confidence in its long-term trajectory.
There’s also a strategic AI partnership underway with a Middle Eastern tech group. This move positions AMD to challenge not just for GPU market share, but for future AI infrastructure dominance — long game stuff.
Analyst sentiment has turned bullish again, with new price targets in the $130–150 range. All of this makes the current chart structure more than just technical noise — it’s backed by strong tailwinds.

CNY/USD Trend since 06 2007. Channel. Reversal zone.Logarithm. Time frame 1 week. At the moment, the currency is stronger than the dollar.
The main trend is a descending channel. The price is in it now.
Secondary trend — breakout of the descending trend line. Price growth to the median of the channel, and in case of its breakthrough, to the resistance. If not, then a pullback to the lower zone of the channel.
Local trend — The nearest events and news background, which can affect (not necessarily) locally (movements to the median of the channel, i.e., the middle, if it is positive) on the yuan rate. This, in less than 1 month, namely from October 22 to 24, 2024 will be held 7.16 XVI BRICS summit (short for Brazil, Russia, India, China, South Africa) in Russia in Kazan.
Line graph for visualization.

#AN021: TRUMP Threats on Tariffs and FOREX Tensions
Global markets are waking up to a currency cold war. Hi, I'm Trader Andrea Russo, and today I want to share the latest news with you.
Donald Trump set the day alight, launching a barrage of threats from a rally in Ohio:
"If re-elected, I will impose 60% tariffs on all of China, 20% on Mexico, and 10% on the European Union. And I'm telling Putin clearly: if you continue to help China evade our embargoes, we will hit Russia too."
The words reverberated across global investment banks, triggering an immediate reaction in the dollar and emerging market currencies.
Markets React: USD Soars, GBP and NOK on Alert
The US dollar gained ground against nearly all major currencies, while the GBP collapsed under pressure from fears of a BoE rate cut and a slowing labor market.
The GBP/NOK pair, in particular, is showing signs of a structured bearish breakout: the pound is under dual pressure (domestic politics + trade war), while the Norwegian krone is indirectly benefiting from rising energy prices and pro-commodity sentiment.
US CPI at 2:30 PM: The Real Detonator
The US core inflation figure will be released at 2:30 PM Italian time. The consensus is for +3.4%, but a higher reading could push the Fed to remain more hawkish for longer. This would strengthen the dollar and create new shock waves in weak and emerging market currencies.
Specifically:
USD/JPY could break above 162.00 with strength.
GBP/USD risks a break below 1.29.
USD/SEK and USD/MXN are the key pairs to watch for explosive movements.
Trump vs. Powell: A Showdown
Meanwhile, fears are growing of a direct attack by Trump on the Fed. According to Deutsche Bank, markets are underestimating the possibility that Trump will attempt to remove Jerome Powell if he returns to the White House.
"The market is ignoring the Trump-Powell variance. If he really tries, the dollar could fall 4% in a week," – Deutsche Bank
We are about to enter the best time of the month for Forex. Those who get their timing wrong today will burn capital. Those who wait for the right signal can ride the trend arising from a predicted global crisis.

BTC/USDT HIDDEN PATTERN! SM, FIB AND MORE COMFIRMED!Price Resilience Amid Geopolitical Stress
Bitcoin demonstrated remarkable strength during the Israel-Iran conflict, briefly dipping to ~$98K but swiftly rebounding above $105K. This aligns with historical patterns where BTC initially sells off on geopolitical shocks but recovers aggressively within weeks, outperforming gold and equities by 15-60% post-crisis. There is a $96K-$94K "footprint" that coincided with institutional accumulation, evidenced by $1.37B in spot ETF inflows during the conflict week, led by BlackRock's IBIT ($240M single-day inflow) according to official information. This institutional backstop and many others might single-handedly prevented a deeper correction for now, remember that smart money psychology is to create cause out of thin air and buy during selling and indecisive times.
Critical Levels to Watch
Immediate Support: $108k area is vital. A sustained hold here maintains short-term bullish momentum. The 50-day SMA near $102.8K (tested during June 13 conflict sell-off) remains a macro support floor.
Resistance & Targets: The $112K ATH is the near-term ceiling. Breaking this requires stronger spot demand—currently, net exchange inflows are negative, indicating weak retail participation or traders that are backing off for now.There's a $120K target (0.618 Fib) aligned with Standard Chartered’s $150K year-end model if ETF inflows persist.
Risk Zones: A close below $108.3K risks a slide to $105K. Failure here opens path to $96K and a further break of this 92k to 96k zone could lead directly to 70k area or even lower if economical and social activities are not favorable in the near to medium future.Dominance above 55% (currently 65%) delays alt season, but a break below 60% could ignite alts in a positive way.
Macro Catalysts & Market Sentiment
Policy Tailwinds: Trump’s "One Big Beautiful Bill" (proposing $5T debt ceiling hike and U.S. strategic BTC reserves) could weaken the USD, boosting BTC’s "digital gold" narrative. DXY’s -9% YTD drop already correlates with BTC’s 54% post-election rally.
Fed Influence: Pressure to cut rates (amid cooling employment data) may accelerate institutional rotation into BTC. ETF inflows hit $2.75B in late June, signaling renewed institutional FOMO.
Geopolitical Cooling: Iran-Israel ceasefire talks reduced immediate panic, but residual volatility risk remains. Traders note BTC often rallies 20-40% within 60 days of conflict events.
Structural Challenges
Liquidity Fragility: Whale moves (for example: 10K BTC sell orders) now impact prices more due to ETF-driven liquidity concentration. Recent $98K flash crash exemplified this.
Regulatory Overhang: MiCA compliance costs in the EU and U.S. security-reclassification proposals could pressure smaller tokens, though BTC’s status appears secure 28.
Seasonal Slump: July historically sees 6.1% of annual crypto volume—low volatility may delay breakouts until August 4.
Strategic Outlook
A July breakout above $112K could ignite the next leg to $120K, but a retest of $107K-$105K is likely first. Altcoins remain subdued until BTC dominance breaks <55%—select projects with institutional backing (for example, ETF candidates) or real-world utility for asymmetric opportunities.
Conclusion: BTC’s resilience amid chaos confirms its institutional maturity. Trade the $108.3K-$112K range aggressively, with a break above ATH targeting $120K by September. Always hedge tail risks (escalations, regulatory shocks) in this volatility-rich asset class. While this great surge in institutional inflow is good for BTC it also indicates a reduction or slower pace of other crypto currencies.
This is my analysis for BTC, let me know what you think and I hope you like it!

TOM LEE leading the charge in this new BULL MarketThank you for providing excellent analysis,
being on the right side of the trade
and helping retail with your public speaking on your own channel, podcasts, and of course CNBC.
I wish you continued success in you Granny shots ETF which is already over $1.5 Billion in AUM!

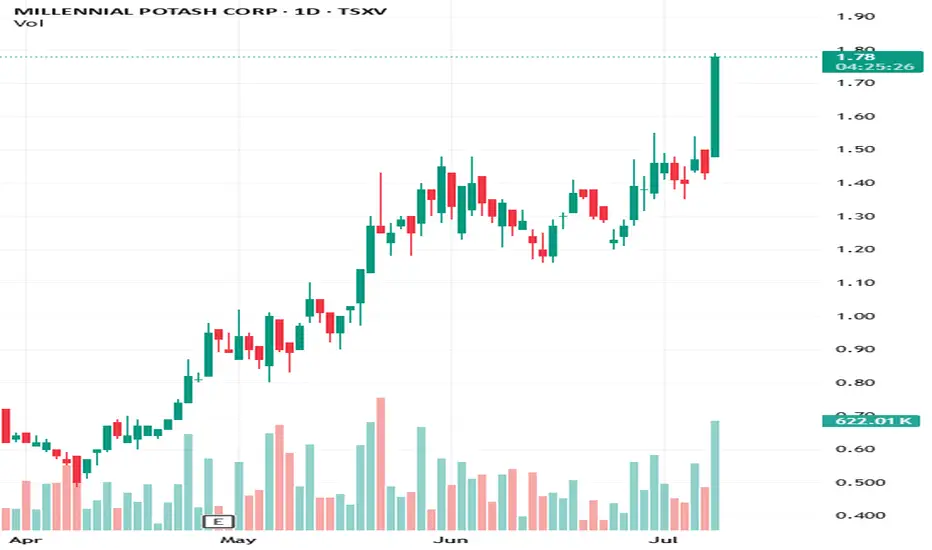
U.S. DFC Invests in $TSXV:MLP Banio Project Millennial Potash Corp. ( TSXV:MLP | OTC:MLPNF ) just announced a major development: the U.S. International Development Finance Corporation (DFC) has committed up to US$3M in project development funding for the Banio Potash Project in Gabon.
This strategic funding supports the upcoming Feasibility Study and was signed in Washington D.C. with the President of Gabon in attendance — a major signal of international and governmental backing.
Why this matters:
Potash = food security. Fertilizer is essential for crop yields, and potash demand in Africa is rising fast.
DFC backing helps derisk the Banio project and positions MLP for future development financing.
The investment arrives as Millennial moves from exploration to development — with second-stage drilling nearing completion.
Gabon's support + U.S. government endorsement puts MLP in a strong geopolitical position for long-term growth.
Follow for updates as the feasibility study unfolds and MLP potentially emerges as a cornerstone player in Africa’s potash supply chain.
BIG BEAUTIFUL BILL - Markets are Ready to PUMP Again! At the 4th of July, the Independence Day, the "One Big Beautiful Bill Act" was signed into law by President Trump. In this idea I want to take a closer look at some points of this law and explain why I consider it VERY bullish for most of financial markets, and especially for crypto.
Here are some key points of the law:
Raises the U.S. debt ceiling by $5 trillion, the largest single increase in U.S. history
Makes many Trump-era 2017 tax cuts permanent: keeps lower individual tax rates, preserves expanded standard deduction, retains corporate tax rate at 21%
Introduces new tax breaks: increases Child Tax Credit, exempts tips, overtime, and Social Security from federal income tax (with limitations)
Adds ~$150 billion to defense and another $150 billion toward border enforcement, including massive ICE budget increase
Trims SNAP food aid by ~$186–200 billion, tightening eligibility (e.g. raising work‑requirement age)
What changes can happen in the economy? Big tax breaks combined with increased expenses cause the growth of financial deficit, the projected by CBO deficit can reach $3 trillion. In this situation the only solution is increasing the national debt which makes Interest Rates climb higher (Yale’s Budget Lab forecasts a 1.2 pp increase in the 10‑year yield).
Why do I think this is bullish for most of stocks and mainly for crypto?
The increase of debt ceiling has always had a positive impact on the crypto and namely on $BTC. The best example is Fiscal Responsibility Act that was signed back in June 5, 2023. This act increased the debt ceiling for +$4.7 billion, after that Bitcoin surged upwards from $25,000 to $75,000 in ~half a year. Similar outcome can be expected now too.
Market perceives U.S. fiscal loosening as inflationary and dollar-weakening, making Bitcoin (as a decentralized and limited-supply asset) more attractive. TVC:DXY has already shown signs of weakness.
Large deficits often force future monetary easing or Fed bond buying to absorb debt. Lower interest rates and more liquidity are historically bullish for risk assets, including crypto.
Rising yields and bond sell-offs spook traditional markets. In this situation, Bitcoin becomes an attractive uncorrelated hedge for portfolios amid volatility in traditional assets.
To sum up , I believe the Big Beautiful Law is, to put it mildly, not good for US economy. However, local effects on stock & crypto markets can be considered positive for investors & traders. With this said, I believe we can expect CRYPTOCAP:BTC to reach $150,000 goal this year and mark this milestone as an ATH for the current bull cycle.

NASDAQ price dropAfter the Nasdaq price reaches around 23642.2, a historic drop will occur and the target is to drop to 16308.
Whatever happens at the highest price, the final destination is towards 16308.
I have identified the price levels in the middle of this expected drop that can cause the price to correct.
IG:NASDAQ

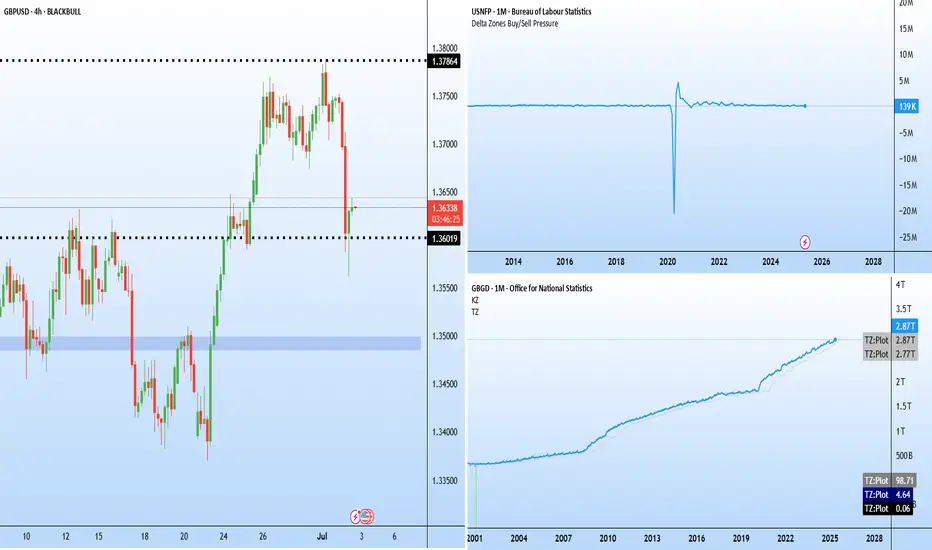
Jobs vs politics: GBPUSD caught in crossfire Two major stories are developing on either side of the Atlantic.
ADP reported a 33 k fall in June private payrolls (consensus +95 k). It is the third straight miss and sets the tone for Thursday’s early Non-Farm Payroll (NFP) release, brought forward because of the 4 July holiday.
In the UK, speculation is growing around the position of Chancellor Rachel Reeves after an emotional appearance in Parliament. Prime Minister Keir Starmer declined to confirm whether she would remain in the role, sparking questions over the government’s fiscal direction.
The political uncertainty helped accelerate the sell-off in GBPUSD, which has fallen sharply from recent highs near 1.38. The latest candles show a long lower wick around 1.3600, indicating that buyers are attempting to defend the area. If this support fails to hold, the next downside target lies near 1.3485–1.3500, which acted as a base for the late-June rally.
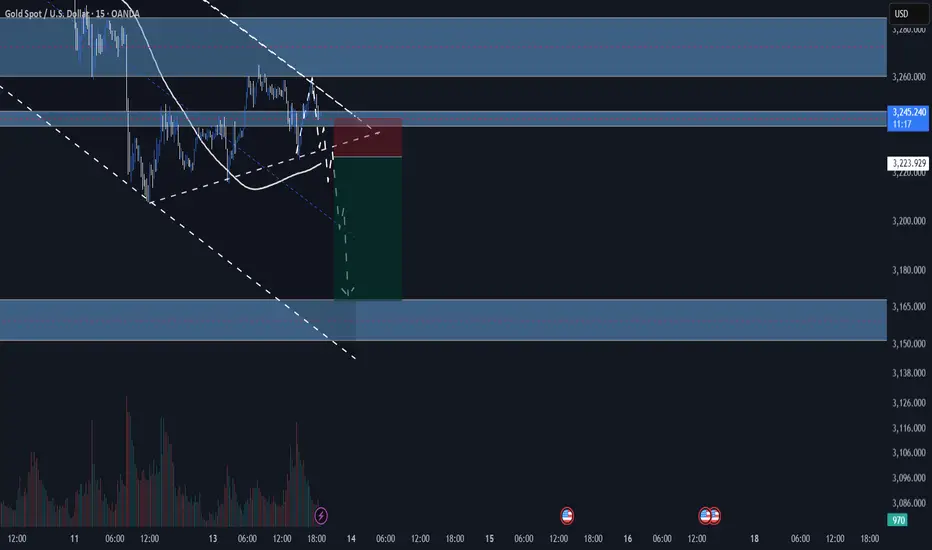
GOLD 4H: structure broken - phase reversal beginsTwo key directional signals were recorded on the gold chart: first, a breakdown of the ascending channel, followed by a confident downward exit from the triangle with a clear fixation under the $3297 boundary. Both figures worked independently, but consistently - and strengthened the impulse towards selling.
The price has already gone beyond the lower boundary of the triangle ($3297), confirming the bearish scenario. Candlesticks closing under the level and local consolidation from below is a characteristic formation before the momentum continues.
Technical parameters:
- Channel breakout: completed
- Triangle breakout: $3297 level
- Retest from below: expected as confirmation
- EMAs reversed downwards, structure broken
- Volumes strengthened at the moment of breakout
Tactical plan:
- Sell after retest of $3297
- Targets on the move: $3248 and $3201
- Stop: above $3305 (above the area of false outs).
The current structure indicates the end of the accumulation phase and the beginning of the downward momentum. As long as the price holds below $3297 - shorts are the priority.

Economic Red Alert: China Dumps $8.2T in US BondsThe Great Unwinding: How a World of Excess Supply and Fading Demand Is Fueling a Crisis of Confidence
The global financial system, long accustomed to the steady hum of predictable economic cycles, is now being jolted by a dissonant chord. It is the sound of a fundamental paradigm shift, a tectonic realignment where the twin forces of overwhelming supply and evaporating demand are grinding against each other, creating fissures in the very bedrock of the world economy. This is not a distant, theoretical threat; its tremors are being felt in real-time. The most recent and dramatic of these tremors was a stark, headline-grabbing move from Beijing: China’s abrupt sale of $8.2 trillion in U.S. Treasuries, a move that coincided with and exacerbated a precipitous decline in the U.S. dollar. While the sale itself is a single data point, it is far more than a routine portfolio adjustment. It is a symptom of a deeper malaise and a powerful accelerant for a crisis of confidence that is spreading through the arteries of global finance. The era of easy growth and limitless demand is over. We have entered the Great Unwinding, a period where the cracks from years of excess are beginning to show, and the consequences will be felt broadly, from sovereign balance sheets to household budgets.
To understand the gravity of the current moment, one must first diagnose the core imbalance plaguing the global economy. It is a classic, almost textbook, economic problem scaled to an unprecedented global level: a glut of supply crashing against a wall of weakening demand. This imbalance was born from the chaotic response to the COVID-19 pandemic. In 2020 and 2021, as governments unleashed trillions in fiscal stimulus and central banks flooded the system with liquidity, a massive demand signal was sent through the global supply chain. Consumers, flush with cash and stuck at home, ordered goods at a voracious pace. Companies, believing this trend was the new normal, ramped up production, chartered their own ships, and built up massive inventories of everything from semiconductors and furniture to automobiles and apparel. The prevailing logic was that demand was insatiable and the primary challenge was overcoming supply-side bottlenecks.
Now, the bullwhip has cracked back with a vengeance. The stimulus has faded, and the landscape has been radically altered by the most aggressive coordinated monetary tightening in modern history. Central banks, led by the U.S. Federal Reserve, hiked interest rates at a blistering pace to combat the very inflation their earlier policies had helped fuel. The effect has been a chilling of economic activity across the board. Demand, once thought to be boundless, has fallen off a cliff. Households, their pandemic-era savings depleted and their purchasing power eroded by stubborn inflation, are now contending with cripplingly high interest rates. The cost of financing a home, a car, or even a credit card balance has soared, forcing a dramatic retrenchment in consumer spending. Businesses, facing the same high borrowing costs, are shelving expansion plans, cutting capital expenditures, and desperately trying to offload the mountains of inventory they accumulated just a year or two prior.
This has created a world of profound excess. Warehouses are overflowing. Shipping rates have collapsed from their pandemic peaks. Companies that were once scrambling for microchips are now announcing production cuts due to a glut. This oversupply is deflationary in nature, putting immense downward pressure on corporate profit margins. Businesses are caught in a vise: their costs remain elevated due to sticky wage inflation and higher energy prices, while their ability to pass on these costs is vanishing as consumer demand evaporates. This is the breeding ground for the "cracks" that are now becoming visible. The first casualties are the so-called "zombie companies"—firms that were only able to survive in a zero-interest-rate environment by constantly refinancing their debt. With borrowing costs now prohibitively high, they are facing a wave of defaults. The commercial real estate sector, already hollowed out by the work-from-home trend, is buckling under the weight of maturing loans that cannot be refinanced on favorable terms. Regional banks, laden with low-yielding, long-duration bonds and exposed to failing commercial property loans, are showing signs of systemic stress. The cracks are not isolated; they are interconnected, threatening a chain reaction of deleveraging and asset fire sales.
It is against this precarious backdrop of a weakening U.S. economy and a global supply glut that China’s sale of U.S. Treasuries must be interpreted. The move is not occurring in a vacuum. It is a calculated action within a deeply fragile geopolitical and economic context, and it carries multiple, overlapping meanings. On one level, it is a clear continuation of China’s long-term strategic objective of de-dollarization. For years, Beijing has been wary of its deep financial entanglement with its primary geopolitical rival. The freezing of Russia’s foreign currency reserves following the invasion of Ukraine served as a stark wake-up call, demonstrating how the dollar-centric financial system could be weaponized. By gradually reducing its holdings of U.S. debt, China seeks to insulate itself from potential U.S. sanctions and chip away at the dollar's status as the world's undisputed reserve currency. This $8.2 trillion sale is another deliberate step on that long march.
However, there are more immediate and tactical motivations at play. China is grappling with its own severe economic crisis. The nation is battling deflation, a collapsing property sector, and record-high youth unemployment. In this environment, its primary objective is to stabilize its own currency, the Yuan, which has been under intense downward pressure. A key strategy for achieving this is to intervene in currency markets. Paradoxically, this intervention often requires selling U.S. Treasuries. The process involves the People's Bank of China selling its Treasury holdings to obtain U.S. dollars, and then selling those dollars in the open market to buy up Yuan, thereby supporting its value. So, while the headline reads as an attack on U.S. assets, it is also a sign of China's own domestic weakness—a desperate measure to defend its own financial stability by using its vast reserves.
Regardless of the primary motivation—be it strategic de-dollarization or tactical currency management—the timing and impact of the sale are profoundly significant. It comes at a moment of peak vulnerability for the U.S. dollar and the Treasury market. The dollar has been extending massive losses not because of China’s actions alone, but because the underlying fundamentals of the U.S. economy are deteriorating. Markets are increasingly pricing in a pivot from the Federal Reserve, anticipating that the "cracks" in the economy will force it to end its tightening cycle and begin cutting interest rates sooner rather than later. This expectation of lower future yields makes the dollar less attractive to foreign investors, causing it to weaken against other major currencies.
China’s sale acts as a powerful accelerant to this trend. The U.S. Treasury market is supposed to be the deepest, most liquid, and safest financial market in the world. It is the bedrock upon which the entire global financial system is built. When a major creditor like China becomes a conspicuous seller, it sends a powerful signal. It introduces a new source of supply into a market that is already struggling to absorb the massive amount of debt being issued by the U.S. government to fund its budget deficits. This creates a dangerous feedback loop. More supply of Treasuries puts downward pressure on their prices, which in turn pushes up their yields. Higher Treasury yields translate directly into higher borrowing costs for the entire U.S. economy, further squeezing households and businesses, deepening the economic slowdown, and increasing the pressure on the Fed to cut rates, which in turn further weakens the dollar. China’s action, therefore, pours fuel on the fire, eroding confidence in the very asset that is meant to be the ultimate safe haven.
The contagion from this dynamic—a weakening U.S. economy, a falling dollar, and an unstable Treasury market—will not be contained within American borders. The cracks will spread globally, creating a volatile and unpredictable environment for all nations. For emerging markets, the situation is a double-edged sword. A weaker dollar is traditionally a tailwind for these economies, as it reduces the burden of their dollar-denominated debts. However, this benefit is likely to be completely overshadowed by the collapse in global demand. As the U.S. and other major economies slow down, their demand for raw materials, manufactured goods, and services from the developing world will plummet, devastating the export-driven models of many emerging nations. They will find themselves caught between lower debt servicing costs and a collapse in their primary source of income.
For other developed economies like Europe and Japan, the consequences are more straightforwardly negative. A rapidly falling dollar means a rapidly rising Euro and Yen. This makes their exports more expensive and less competitive on the global market, acting as a significant drag on their own already fragile economies. The European Central Bank and the Bank of Japan will find themselves in an impossible position. If they cut interest rates to weaken their currencies and support their exporters, they risk re-igniting inflation. If they hold rates firm, they risk allowing their currencies to appreciate to levels that could push their economies into a deep recession. This currency turmoil, originating from the weakness in the U.S., effectively exports America’s economic problems to the rest of the world.
Furthermore, the instability in the U.S. Treasury market has profound implications for every financial institution on the planet. Central banks, commercial banks, pension funds, and insurance companies all hold U.S. Treasuries as their primary reserve asset. The assumption has always been that this asset is risk-free and its value is stable. The recent volatility and the high-profile selling by a major state actor challenge this core assumption. This forces a global repricing of risk. If the "risk-free" asset is no longer truly risk-free, then the premium required to hold any other, riskier asset—from corporate bonds to equities—must increase. This leads to a tightening of financial conditions globally, starving the world economy of credit and investment at the precise moment it is most needed.
In conclusion, the abrupt sale of $8.2 trillion in U.S. Treasuries by China is far more than a fleeting headline. It is a critical data point that illuminates the precarious state of the global economy. It is a manifestation of the Great Unwinding, a painful transition away from an era of limitless, debt-fueled demand and toward a new reality defined by excess supply, faltering consumption, and escalating geopolitical friction. The underlying cause of this instability is the deep imbalance created by years of policy missteps, which have left the world with a glut of goods and a mountain of debt. The weakening U.S. economy and the resulting slide in the dollar are the natural consequences of this imbalance. China’s actions serve as both a symptom of this weakness and a catalyst for a deeper crisis of confidence in the U.S.-centric financial system. The cracks are no longer hypothetical; they are appearing in the banking sector, in corporate credit markets, and now in the bedrock of the system itself—the U.S. Treasury market. The tremors from this shift will be felt broadly, ushering in a period of heightened volatility, economic pain, and a fundamental reordering of the global financial landscape.

June 27th, 2025 - Morning BriefFriday, June 27, 2025. Markets are on the edge, and if you thought summer would bring calm, think again. Today’s script is pure adrenaline.
Overnight, the U.S. and China finally inked a trade deal that actually matters: tariffs are coming down, and rare earths are flowing again. Tech and manufacturing stocks are already celebrating, with SP:SPX and CME_MINI:NQ1! futures inching toward fresh record highs. NASDAQ:NVDA is still the market’s favorite lottery ticket, hitting another all-time high. Meanwhile, NYSE:NKE just spiked 10% premarket after beating earnings. Never mind the $1 billion tariff punch, they’ll “manage it.” Sure.
But the real show is the May PCE inflation data dropping this morning. The Fed’s favorite gauge is expected to tick up to 2.3% year-over-year, with core PCE at 2.6%. If the numbers surprise, brace for whiplash in rates and risk assets. GDP’s third estimate confirmed a -0.5% contraction in Q1, so the “soft landing” crowd is sweating. Jobless claims and new home sales hit at 10:00 AM ET. Expect every algo on the Street to be watching.
Trump is making noise about firing Powell before 2026, which has traders betting on earlier rate cuts. If you’re looking for stability, you’re in the wrong casino.
Here’s where things stand:
- OANDA:XAUUSD : $3,280–$3,334/oz (slipping as risk appetite returns)
- BLACKBULL:WTI : $65.64–$65.82/barrel (steady, but one headline away from chaos)
- BINANCE:BTCUSDT : $107,215–$107,477 (down, but still a six-figure fever dream)
- CME_MINI:ES1! : Hovering just below the 6,144 record
Today’s takeaway: The market’s running on hope, caffeine, and denial. Stay sharp, one bad print and the rally could turn into a stampede for the exits. Welcome to the volatility vortex.
Been building something for US swing traders — if you’re one, I’d really appreciate your feedback. Free to test, link in Bio

WTI Short PositionBelieve stability within the Middle East market will bring the price down so it could rebound back up once liquidity has been cleared

Oil panic buying after Iran Strikes?President Donald Trump has confirmed that the U.S., in coordination with Israel, has conducted three strikes on Iranian nuclear facilities.
Will there be panic buying of WTI and Brent at the open?
In response, Iran’s parliament has approved a proposal to close the Strait of Hormuz, a key global oil shipping route. The final decision lies with Iran’s Supreme National Security Council and Supreme Leader Ayatollah Ali Khamenei.
If a blockade is enforced, oil prices could rise sharply. ClearView Energy Partners estimates a short-term closure could add between $8 and $31 per barrel. JP Morgan has suggested that a full-scale conflict and complete shutdown could drive prices to $130.

Can 6 Holes in a mountain move gold this week? 23-27 June 2025Hello fellow traders of OANDA:XAUUSD
All about last week here
Since Israel's attack on Iran on Friday, June 13th, aimed at destroying all facilities for potential nuclear weapons production, the gold price initially rose to $3450. This surge lasted until Monday, June 16th, during the European session, but then began to fall from there. 📉🔻
Signs of potential peace talks and a swift end to the conflict largely made investors hesitant to invest. Throughout the week, the gold price mostly reacted negatively to higher prices due to investor uncertainty. This was further exacerbated by the fact that the US had not yet entered this war, which Israel initiated. 🕊️😟
However, since the US attack with bunker-busting bombs on the nuclear facilities on June 21st, they are now part of the conflict. Not least for this reason, they might become the target of retaliatory strikes, as already announced by the Iranian regime. 💣💥
If one looks at the timeline of news and announcements regarding potential US involvement in this war, and the two-week waiting period announced by President Trump, it will certainly become clear that this was nothing more than tactics. It was foreseeable that the US would become involved in the conflict, not least because the Israelis lack the appropriate weapons. The possibility of the US providing these weapons to the Israelis was also in the news; however, it then became clear that this specific bomb could only be used by the Stealth Bomber B2. This made it evident that it was only a matter of timing when it would happen, and they naturally wanted to keep that secret – anything else would be nonsensical anyway. 🤫✈️
What's to be expected next? Regarding this conflict, I hope for a swift end. 🕊️🙏 As for the gold price, well, I still believe in a new All-Time High (ATH). 🚀🌟 Will it come this week? Possibly. But the much more important question is whether the Iranian regime will truly dare to attack the US and exact revenge. 🤔⚔️
Market Structure:
The chart shows a clear shift from bullish 🐂 to bearish 🐻 structure. We see a significant high around June 13th at approximately $3,451, followed by a break of structure with lower highs and lower lows forming. 📉
Key Levels: 🔑
Premium levels: The area around $3,440-$3,451 represents premium pricing where institutional selling likely occurred. 💎
Fair Value Gaps: There appear to be several imbalances/gaps that price may seek to fill, particularly around the $3,380-$3,400 zone. 🎯
Order Blocks: The consolidation areas around $3,320-$3,340 and $3,380-$3,400 represent potential institutional order blocks. 🧱
Institutional Levels: 🏦
Psychological resistance: $3,450 level acted as significant resistance. 🚧
Current support cluster: $3,320-$3,340 area showing multiple touches. 🛡️
Liquidity zones:
The recent lows around $3,293 represent buy-side liquidity that institutions may target. 💧
Fibonacci Analysis: 📏
Based on the major swing from the low around June 9th ($3,300) to the high on June 13th ($3,451):
50% retracement: ~$3,375 (already tested and failed) 📉
61.8% retracement: ~$3,357 (near current price action) ✨
78.6% retracement: ~$3,337 (aligns with support cluster) ✅
Gann Concepts: 🔢
The timing shows potential significance around the June 13th high, with subsequent price action following geometric price relationships. The current price action around $3,328 suggests we're testing important Gann square relationships from the cycle highs. 📐
Cycle Timing: ⏰
The approximately 10-day cycle from low to high to current retracement suggests we may be in a corrective phase that could extend into late June, with potential for cycle lows around the June 25-27 timeframe based on typical precious metals cycles. 🗓️
Current Assessment:
Price appears to be in a corrective phase testing the $3,320-$3,340 institutional support zone. A break below could target the cycle lows, while a hold here with reclaim of $3,380 could indicate accumulation for the next leg higher. ⚖️🔍
Please take the time to let me know what you think about this. 💬
-------------------------------------------------------------------------
This is just my personal market idea and not financial advice! 📢 Trading gold and other financial instruments carries risks – only invest what you can afford to lose. Always do your own analysis, use solid risk management, and trade responsibly.
Good luck and safe trading! 🚀📊

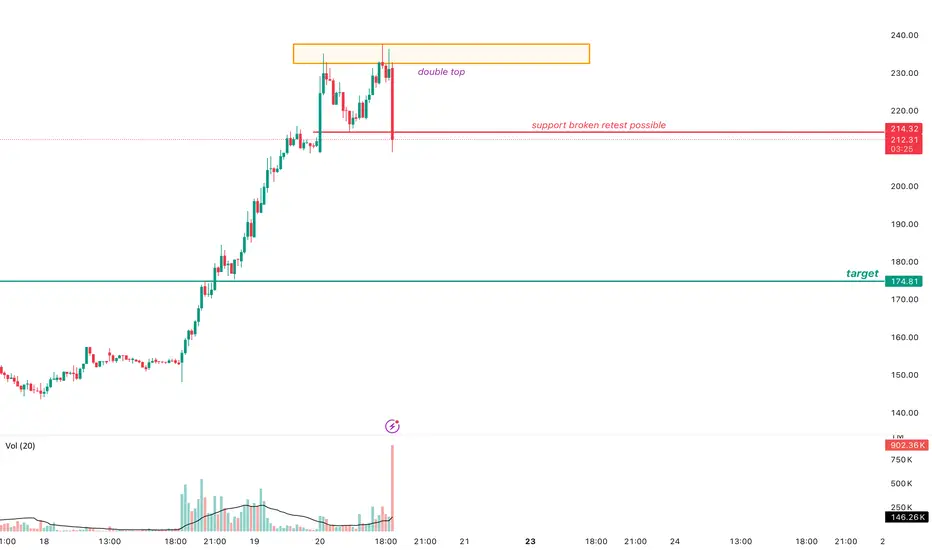
CRCL LOOKS OVERBOUGHTAs you can see after a good ride from 102 to 234 now the stock looks overbought. and on shorter time frames the price action shows a classic pattern of double top and breaking the previous support. simply if the stock closes 15 m candle below the support you might see a short retest to the support from downside that is a good point to short.
(jasmy) jasmy "array"I can't share my indicator ideas unless I publish them publicly. I don't feel like sharing my indicators with the public is necessary so I guess I will not be publishing many new ideas because the Trading View website is removing features where unpublished custom indicators are allowed to be included in sharing. Trading View is too strict and they keep choking the freedoms of watchlist, now indicators, what's next to be taken away from users of the website?

Nasdaq will reach 25'000 still no body see it?Current level: 21,876
Previous ATH: 22,222.61
Next stop? Well… if you ask the pivot levels they're whispering "23347.20, baby."
What we’re looking at is not just a strong recovery it’s a market that refuses to take a breather. With weekly candles forming higher lows and pivot zones behaving like polite suggestions rather than resistance, it’s hard not to think the index is gearing up for a proper breakout.
Sure, skeptics will say we’re overextended. Bears will point to the volume spikes and say “exhaustion.” But momentum? She's dancing in stilettos on top of R3 like it's a catwalk.
Now, here's the fun part:
If this rhythm keeps up and if inflation, rates, and the Fed behave like decent background characters then 25,000 by the end of the year isn’t just possible. It's that slightly overconfident friend at the party who's already halfway into a celebratory toast.
So… who dares to trust the trend?
Because let’s be honest: being early is painful, being late is expensive but being in the trend? That’s just good business.
📈 Trade safe, manage risk, and don’t fight the trend. Unless you're into that kind of thrill.
#tradehills #Pscarfo

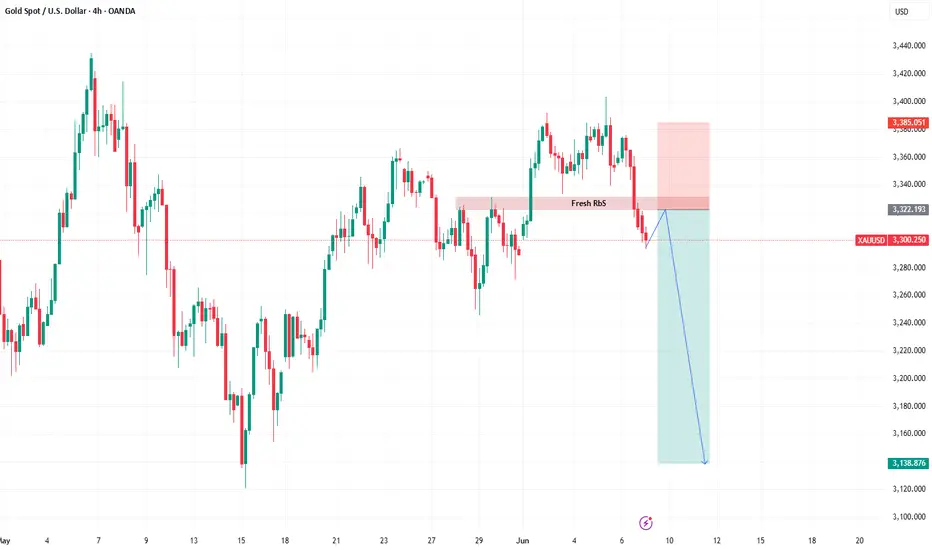
XAUUSD after NFPBased on chart
Price already break the RbS area
So for now the plan is to wait the price to retest the RbS area then drop
NVIDIA 1D — When “Head & Shoulders” Aren’t Just for the GymOn the daily chart, NVDA has broken out of the descending channel and reclaimed the 50-day moving average (MA50), triggering a classic inverted head and shoulders formation. Price is now holding above the key $113–$114.50 zone, confirming a structural shift. As volume picks up, buyers are eyeing the next levels of resistance.
Near-term upside targets: – $119.80 (0.5 Fibonacci) – $127.62 (0.382) – $137.28 (0.236) — primary resistance zone – Extended target — $152.91 (1.0 Fibonacci projection)
Technical setup: — Breakout from channel + above MA50
— Inverted head and shoulders pattern completed
— $114.50–$118.00 now acts as buyer support
— EMA and MA convergence supports trend reversal
— Increasing volume on rallies supports bullish momentum
Fundamentals: NVIDIA remains the AI and semiconductor sector leader. Growing demand for high-performance GPUs in AI and data centers positions NVDA as a core tech play. Expectations of strong earnings and continued institutional accumulation support the bullish narrative.
The confirmed breakout and inverted H&S setup mark a clear structural reversal. As long as price stays above $114.50, the path toward $127–$137 remains the primary target zone, with $152.91 in sight if momentum continues.

EUR USD Trade Setup 1 hour timeframe EUR USD has formed a demand level around price 1.12600 and the market is slowly approaching this level, we need to wait for price to tap on the demand zone before making any trading decisions.

XAUUSD SHORTIt's a beautiful setup , as we see here gold is going down since 6TH of may and it forms a bearish channel , it just tested the lower high of the channel and a resistance . I'm waiting for the market to break and retest the trendline beneath it , then i'll take a short position targeting this support level