Currency most likely to rebound against USD next week? Next week's Federal Reserve interest rate decision possibly just got a lot more interesting.
Last night we got PPI data. In February, the producer price index, a key gauge of wholesale inflation, surged by 0.6%, surpassing expectations by more than double.
The big question now is whether traders will reassess their expectations for the timing of a Fed rate cut. Currently, the market is pricing in less than a 15% chance of a rate cut in May and a 60% likelihood in June.
This PPI report marks the final significant economic data released before the Federal Reserve's forthcoming policy meeting scheduled for March 19-20.
The USD dollar knocked back all its pairs after the PPI announcement. But which pairs are likely to stage a comeback?
The Japanese yen is possibly one of the best prospects in this regard. Traders will be looking for serious talk on Monday about the Bank of Japan ending it decades of extremely low-interest rates (or God-forbid an actual rate hike). The BoJ's Interest Rate Decision is slated for 11 pm on Monday.
Next week, we will also see the release of inflation data from Canada and the UK, adding potential volatility to USDCAD and GBPUSD pairs.
USA

🚨 Bitcoin NOT at all-time high yet! 🚨🚨 Bitcoin NOT at all-time high yet! 🚨
I developed this formula a long time ago and have been observing it. When the founder of ADA (Charles Hoskinson) said that the previous Bitcoin all time high was $69,000 based on the value of the dollar in 2021, I remembered my formula.
The essence is quite simple: multiply the sum of the Fed's liabilities, the US budget balance, and the debt-to-GDP ratio by the dollar index and divide by the price of Bitcoin.
From an economic point of view, this formula attempts to correlate US monetary and fiscal indicators, as well as the strength of the dollar, with the price of Bitcoin. It is my attempt to measure the "fundamental value" of Bitcoin relative to the indicators of the US economy and the strength of the dollar.

EURUSD: Addressing Temporary WeaknessGreetings Traders,
Bullish Channel: We're currently observing a bullish channel, with the price nearing its ceiling.
Key Levels: Pay attention to the concise of this month's R1, which has been broken, and the VAH of volume profile. These levels are pivotal for longer-term long positions and suggest refraining from short-term shorts.
Temporary Weak Bearish Phase: Despite a temporary weak bearish phase, expectations point to a strong rise by the middle of next week.
LTF Analysis: On lower time frames, watch for deeper corrections, offering opportunities for short trades.
CPI News Impact: Stay updated on CPI News, as surprises here could alter market dynamics significantly.
Wishing you profitable trades ahead!
Warm regards,

weekly analysis of gold with my personal st based on WMPwe made almost 530 pips from our area on gold by 2-3 positions a day on NEWYORK session last week with just 50 pips SL .
gold make an uptrend move from 2079 to 2195 on friday now we have some plan to trade gold this week. we trade on newyork session by our new area and i wish more profit from last week.
"Using the data we get from the gold weekly chart and my special calculation program, we identify these waypoints as key gold points and based on that we can enter long and short positions. In this method, stoploss setting is based on your personal money management and is flexible, but the most logical stop is between 20 and 35 pips from the entry point on the drawing lines.
Every week we will recalculate and send you the lines and we hope to get between 200 and 500 pips of profit with this strategy.
Until further notice, this program will be run for free and after you believe in our method, the supplementary strategy along with the calculation program will be available for sale . and for those people who are not interested in calculation and training in the coming weeks of the channel, We will have a daily trading signal on gold."
HIGH WMP = 2195.06
LOW WMP = 2079.42
MID WMP = 2137.24
MID U WMP = 2166.15
MID D WMP = 2108.33
ADDED U WMP = 2223.97
ADDED U WMP = 2252.88
ADDED D WMP = 2050.51
ADDED D WMP = 2021.60

Massive US Unemployment Move Inbound
On the FRED:UNRATE dataset, we can see that since 1953, every time the unemployment rate make a significant move above the 24 months SMA, with the sole exception of October '67, we saw a large spike in unemployment allong with a recession.
Currently, FRED:UNRATE rose above the 24 months SMA in August 2023 and has been stochastically moving higher ever since. Historically, this means that we can expect an aggressive move in unemployment in the following months.

USDJPY H4 6 March 2024USD/JPY, H4 6 March 2024
The USD/JPY pair continues to trade within a consolidation range, fluctuating between the 150.80 and 149.75 levels. Notably, Mitsubishi UFJ Financial Group, Japan's largest bank, is reportedly adjusting its positions in anticipation of a potential move by the Bank of Japan (BoJ) in March. Senior management at the bank has suggested that there is a 50% chance the BoJ may shift its monetary policy, a move that could have significant implications for Japanese government bonds and the strength of the Japanese Yen.
USD/JPY eases slightly but remains trading sideways within its consolidation range. Suggesting bearish momentum may be forming.
Resistance level: 150.80, 151.70
Support level: 149.40, 147.60

📊 Upcoming PMI Report Analysis 📈PMI Report Update
The PMI Services report is due out in approximately 2 hours. Last month, the index rose from 50.6% to 53.4%. This month, the forecast is slightly lower at 53%.
There is not a significant difference between the actual figure from last month and the forecast. However, the key point is that the figure is above 50.
In general, a higher than expected reading is likely to lead to a rise in the dollar index, while a lower than expected reading is likely to lead to a fall in the dollar index.
If the actual figure is in line with the forecast or there is no significant difference from last month, we do not expect any major market reaction.
Additional Information:
The PMI (Purchasing Managers' Index) is a survey-based measure of economic activity.
A reading above 50 indicates expansion, while a reading below 50 indicates contraction.
The PMI Services report focuses on the services sector of the economy.
The services sector is the largest sector of the economy in most developed countries.
__________
This information is provided for general knowledge purposes only and should not be considered as investment advice. Please consult with a qualified financial advisor before making any investment decisions.

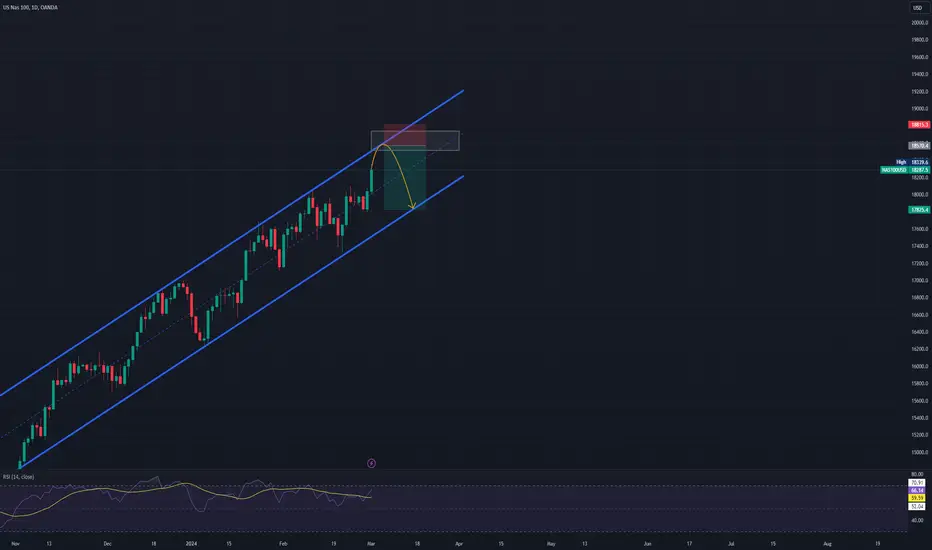
Strong Bullish Trend Continues for US NAS 100The US NAS 100 has shown strong upside potential in a channel-like pattern on the daily chart. We expect it to smoothly rise towards the top of the channel and after reaching the channel roof, experience a slight downtrend towards the bottom of the channel. 📈📉
Republican-led shutdown: What's at Stake for the USD?? Republican-led shutdown: What's at Stake for the USD??
We are four days away from a potential partial government shutdown, and negotiations among lawmakers have yet to produce a resolution.
On Monday, Senate Majority Leader Chuck Schumer, Senate Minority Leader Mitch McConnell, House Speaker Mike Johnson, and House Minority Leader Hakeem Jeffries meet in the Oval Office with the president and vice president to negotiate the conditions to keep the government operational beyond March 1.
Senate Democrats have been expressing frustration, placing blame on House Republicans, particularly criticizing leader Mike Johnson, for the current impasse. Senator Jon Tester, a Montana Democrat, voiced displeasure, stating, "We're doing this every six months. This is bullsh*t.... we need to do what we were elected to do, fund the government, not shut it down," in an interview with CNN.
If no resolution is reached, a partial shutdown is set to commence at 12 a.m. on Saturday.
Notably, the last time the US government was on the precipice of a shutdown (Sept- Oct 2023), the USD kept strengthening against major partners like the Euro, with the USD being seen as a safe haven play.
But last year, there were a few other factors that could have been compounding this USD-buying activity, including the US interest-rate differential and comments from some Fed members making it clear that policy won’t be changing anytime soon. This time, it's maybe not as clear that there are as strong a set of factors pushing for a robust USD.

DXY - Bearish => Bullish 📈📉Hello TradingView Family / Fellow Traders. This is Richard, also known as theSignalyst.
📉 As per my last analysis, attached on the chart, DXY rejected the upper bound of the red channel and traded lower.
Currently, DXY is hovering around the lower red trendline acting as a non-horizontal support.
📈 For the bulls to take over, and start the next impulse that would lead to 105.2, a break above the last major high in blue is required.
📉 Meanwhile , DXY would be bearish and can still break the red trendline downward, in this case a continuation till the 103.0 support would be expected.
📚 Always follow your trading plan regarding entry, risk management, and trade management.
Good luck!
All Strategies Are Good; If Managed Properly!
~Rich

JPM, SOME UPSIDE AND A WHOLE LOTTA DOWNSIDEJPM might have a bad week?
Maybe bad Feb?
idk yet, however, from technicals, it seems like after 181 or so, and especially after $210, there isn't much upside showing.
Likely meaning, the risk far outweighs the reward at those levels.
IT could be big, and it could be fairly quick.
if you're shorting, yeah, these are great times to consider entering.
The downside shows all the way to $69 (nice)
Does that mean enter short right now this minute? nah
but be ready because things could really drop quickly in the coming month or so.
idk maybe this?

TARGET REACHED - And ongoing to Target 2 - 40,0042The trade analysis we had for Dow Jones couldn't have played out better.
On paper and theory, this just rocked to its first target 37,242.
But then, it entered into a trending market. This is where it's very tough for breakout traders to get in.
This is very tough for reversal traders to trade.
This is very tough for range bounded trades to buy and sell.
So, all we can do is wait for the trend to continue up and form a new pattern. Or continue holding and raising the trailing stop loss each week.
But it looks like the next target is set for 40,0042.
I'll wait and observe as it feels top heavy and I don't really have a good strategy to get in right now.

SPY (S&P500) - Trendlines, Support, Resistance - Weekly chartSPY (S&P500 etf) has been in an uptrend for one year, and is currently seeking to create a higher-high pivot point in price action.
Weekly support levels are: $484, $477, $462.
Weekly resistance levels are: $502, $510, $517.
Livestream Announcement: My Livestreams will be postponed until approximately March 2024 due to covid illness. Thank you for following and supporting.

S&P500 INTRADAY LEVELS FOR 12/02/2024BUY ABOVE - 5030
SL - 5020
TARGETS - 5045,5060+
SELL BELOW - 5015
SL - 5020
TARGETS - 5008,5000,4992
NO TRADE ZONE - 5015 to 5030
Previous Day High - 5030
Previous Day Low - 5000
Based on price action major support & resistance's are here, the red lines acts as resistances, the green lines acts as supports. If the price breaks the support/resistance, it will move to the next support/resistance line. White lines indicates previous day high & low, high acts as a resistance & low acts as a support for next day.
Trendlines are also significant to price action. If the price is above/below the trendlines, can expect an UP/DOWN with aggressive move.
Please NOTE: this levels are for intraday trading only.
Disclaimer - All information on this page is for educational purposes only,
we are not SEBI Registered, Please consult a SEBI registered financial advisor for your financial matters before investing And taking any decision. We are not responsible for any profit/loss you made.
Request your support and engagement by liking and commenting & follow to provide encouragement
HAPPY TRADING 👍

S&P 500 - INTRADAY LEVELS 09/02/2024BUY ABOVE - 5000
SL - 4990
TARGETS - 5015,5030,5045
SELL BELOW - 4985
SL - 4995
TARGETS - 4975,4958,4940
NO TRADE ZONE - 4985 to 5000
Previous Day High - 5000
Previous Day Low - 4985
Based on price action major support & resistance's are here, the red lines acts as resistances, the green lines acts as supports. If the price breaks the support/resistance, it will move to the next support/resistance line. White lines indicates previous day high & low, high acts as a resistance & low acts as a support for next day.
Trendlines are also significant to price action. If the price is above/below the trendlines, can expect an UP/DOWN with aggressive move.
Please NOTE: this levels are for intraday trading only.
Disclaimer - All information on this page is for educational purposes only,
we are not SEBI Registered, Please consult a SEBI registered financial advisor for your financial matters before investing And taking any decision. We are not responsible for any profit/loss you made.
Request your support and engagement by liking and commenting & follow to provide encouragement
HAPPY TRADING 👍

S&P Kissed 5000 levelUSD: S&P 500 at 5000
US asset markets are having a good few weeks. Equity benchmarks are pushing up to fresh highs
and last night's US 10-year Treasury auction saw decent demand. Leading the charge in US
equities has been the big tech stocks. Just looking across the consensus price targets of the
'magnificent seven', the targets remain anywhere from 6% (AAPL) to 20% (AMZN) above last
night's closing levels. The only one of the seven with a lower price target is Nvidia, where this
year's 50% rally has overshot a price target largely there since last summer. Whether the
psychological 5000 level in the S&P 500 now proves something of a hurdle remains to be seen. But from the equity analyst community anyway, the consensus is that there is more to come.
After the Fed/Powell pushed back hard on a rate cut in March, and, the payrolls data
reinforced the message, the market's attention is shifting to the May meeting
probabilities.
We believe the Fed’s hiking cycle is complete and that the Fed will remain on hold at the current Fed funds rate range of 5.25-5.5% until the first 25bp cut in May,
after which we expect 25bp cuts in June, July, and September followed by quarterly
cuts until the terminal rate range reaches 3.25-3.5% in September 2025, although
the risks are skewed toward a June start to rate cuts. On balance sheet policy, we
expect the Fed to announce that it will start tapering the pace of balance sheet
runoff in May and to end runoff in 1Q25.

XAUUSD_GOLD_1D📊Gold analysis
Mid-term and long-term time frames
Elliott wave analysis style
The market is attempting a correction towards the 1900 channel
Currently, the 5-wave correction triangle is ABCDE
The main and important range and the border between the rise and fall is $2040

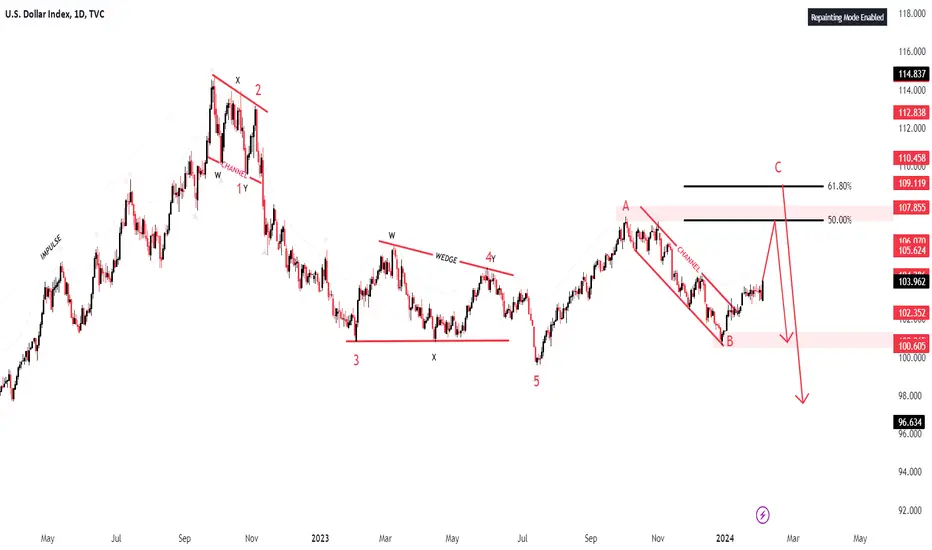
DXY Index New Week MovePair : DXY Index
Description :
Impulse Correction Impulse
Breakout the Upper Trend Line of the Corrective Pattern " BULLISH CHANNEL " in Short Time Frame
According to ELLIOT WAVES , It has completed " 12345 " Impulsive Waves and Corrective Waves " AB "
HEAD & SHOULDER as an Corrective Pattern in Long Time Frame
USACAD, 4x but not 4x more like four and for and x and exTrends marked
Price Targets marked
All of these trends are fairly strong on their own
but it looks like this wants to head down before up
maybe to 1.08?
1.22 in the near term sound reasonable?
This chart was requested. I don't pay much attention to this chart so let me know if I'm missing something I'd normally pick up had I been monitoring this more frequently.
But, I think I got all the important trends and longer term price targets.
again, I was hesitant to draw a line, but I think it better shows the downside potential. I wouldn't follow it, I'd expect it to be incorrect, instead focus should be with the trends and price targets.

DEFENSE WINS CHAMPIONSHIPS (Global Conflict Summary EDITION)Per the council of foreign relations, these are the following current global conflicts. I've included a brief description of each conflict. It's important to understand these if you're planning or already are investing in defense stocks.
Per TA, I've labeled bearish price targets, bullish price targets, relevant trends. It looks overvalued from analysis on ITA, but there is upside. I'd say that short term probably favors bulls (talking maybe weeks if not less), mid term probably favors the bears (multiple months), long term will likely favor bulls, but it will depend on the movement we see over FEB and March.
Global Conflict Summary
Americas
Criminal Violence in Mexico
The criminal violence in Mexico involves various organizations such as Sinaloa, Los Zetas, Tijuana/AFO, Juárez/CFO, Beltrán Leyva, Gulf, La Familia Michoacana, the Knights Templar, and Cartel Jalisco Nuevo Generación (CJNG). The violence is attributed to the increase in crime rates and the limited interventions by the state and municipal police.
Instability in Haiti
The instability in Haiti involves the government, opposition parties, and the international community. The crisis revolves around the dispute over the presidential term and the government’s inability to control skyrocketing prices of commodities.
Instability in Venezuela
Venezuela is facing an unprecedented social and humanitarian collapse due to poor economic policies, political conflict, and the international community’s unsuccessful attempts to bring about positive change. The conflict involves the government under President Nicolás Maduro and opposition groups.
Asia
Instability in Afghanistan
Since the Taliban reclaimed control of Afghanistan in 2021, the country has further plunged into political and economic instability. The conflict involves the Afghan government, the Taliban, and various local and international actors.
Territorial Disputes in the South China Sea
China’s sweeping claims of sovereignty over the sea have antagonized competing countries. The key parties involved in this territorial dispute are China, the Philippines, and the US.
North Korea Crisis
North Korea could resort to nuclear weapons in a crisis as it is making significant progress toward implementing a more robust nuclear strategy. The crisis involves North Korea, South Korea, the United States, Japan, and other international actors.
Instability in Pakistan
Pakistan continues to face multiple sources of internal and external conflict. Extremism and intolerance of diversity and dissent have grown, threatening the country’s prospects for social cohesion and stability. The conflict involves the Pakistani government, opposition groups like the Pakistan Muslim League and the Pakistan Peoples Party, and militant groups like the Tehrik-e-Taliban Pakistan (TTP).
Conflict Between India and Pakistan
Since 1947, India and Pakistan have been involved in a number of wars, conflicts, and military standoffs, with the Kashmir conflict serving as the catalyst for every war between the two states. The conflict primarily involves India and Pakistan, with the disputed region of Kashmir being a major point of contention.
Confrontation Over Taiwan
Tensions are rising over Taiwan as China’s power and assertiveness grows, competition between the U.S. and China spreads, and the Taiwanese people develop a distinct identity increasingly disassociated from the mainland. The key parties involved in this conflict are China, Taiwan, and the US.
Civil War in Myanmar
The civil war in Myanmar escalated significantly in response to the 2021 military coup d’état and the subsequent violent crackdown on anti-coup protests. The conflict involves the National Unity Government, People’s Defence Force, Chinland Defence Force, Chin National Defence Force, Karenni Nationalities Defence Force, and other ethnic armed organizations against the State Administration Council and Tatmadaw.
Europe and Eurasia
War in Ukraine
The war in Ukraine involves Ukraine and Russia. The conflict is over the sovereignty of Crimea and parts of eastern Ukraine, which Russia annexed in 2014.
Nagorno-Karabakh Conflict
The Nagorno-Karabakh conflict involves Armenia and Azerbaijan. The dispute is over the Nagorno-Karabakh region, which is internationally recognized as part of Azerbaijan but is governed by ethnic Armenians.
Middle East and North Africa
Conflict in Syria
The conflict in Syria involves the Syrian government, opposition groups, and various international actors. The civil war began in 2011 as part of the Arab Spring protests and has since escalated into a multi-sided conflict involving numerous factions and foreign powers.
Instability in Iraq
The instability in Iraq involves the Iraqi government, various ethnic and religious groups, and international actors. The conflict stems from sectarian tensions, political instability, and the presence of ISIS.
Israeli-Palestinian Conflict
The Israeli-Palestinian conflict involves Israel, Palestine, and various international actors. The conflict is over the sovereignty of the Palestinian territories and the establishment of a Palestinian state alongside Israel.
Sub-Saharan Africa
Conflict in the Central African Republic
The conflict in the Central African Republic involves the government, various rebel groups, and international actors. The conflict stems from political instability, ethnic tensions, and control over the country’s rich natural resources.
Conflict in Ethiopia
The conflict in Ethiopia involves the Ethiopian government, the Tigray People’s Liberation Front, and various ethnic and regional groups. The conflict stems from political tensions, ethnic disputes, and disagreements over the country’s system of ethnic federalism.
Please note that this is a brief summary and does not cover all aspects of the conflicts. For more detailed information, please conduct further research.

US Government's Planned $118M Bitcoin SaleThe United States government's announcement of a planned $118 million Bitcoin sale has sparked discussions and debates within the crypto community. The planned sale comes in the wake of the Jan. 8 sentencing of Silk Road Xanax dealer Ryan Farace and his father Joseph Farace for money laundering conspiracy. While some express concerns about the potential impact of this sale on the market, market commentators argue that it's merely a drop in the bucket compared to the recent outflows from Grayscale's Bitcoin Trust (GBTC).
Grayscale's Dominance:
The magnitude of the US government's planned sale becomes apparent when compared to the outflows from Grayscale's Bitcoin Trust (GBTC). According to Steven Lubka, managing director at Bitcoin exchange Swan Bitcoin, the government's sale of 2,934 CRYPTOCAP:BTC is nothing more than "peanuts" when considering that GBTC has sold a staggering 106,575 CRYPTOCAP:BTC worth $4.2 billion since its conversion to a spot Bitcoin exchange-traded fund on Jan. 11. The latest outflow, totaling 10,871 CRYPTOCAP:BTC on Jan. 24, underscores the dominance of Grayscale in terms of Bitcoin holdings.
Comparing the Numbers:
The planned government sale constitutes just 1.5% of the total estimated 194,188 CRYPTOCAP:BTC , equivalent to $7.7 billion, it holds from three seizures in criminal cases. This figure is still less than 1% of Bitcoin's circulating supply. The three major Bitcoin hauls and sales by the US government involve 94,643 CRYPTOCAP:BTC seized in January 2022 from the 2016 Bitfinex hack, 69,369 CRYPTOCAP:BTC seized in November 2020 from the Silk Road, and 51,326 CRYPTOCAP:BTC seized from Silk Road hacker James Zhong. Additionally, around 41,000 CRYPTOCAP:BTC is scheduled for offloading in four sales throughout 2023.
Historical Perspective:
The US government has a history of auctioning seized Bitcoin, with one of the most notable instances being the 2014 auction where venture capitalist Tim Draper acquired nearly 30,000 $BTC. However, recent trends indicate a shift toward selling seized crypto on exchanges instead of through traditional auctions. The last known sale of 9,118 CRYPTOCAP:BTC occurred in March 2023, emphasizing the evolving methods employed by the government to liquidate confiscated cryptocurrencies.
Conclusion:
While the announcement of the US government's planned $118 million Bitcoin sale has raised eyebrows, experts and market commentators are quick to downplay its significance. In the context of Grayscale's massive outflows and the overall scale of Bitcoin holdings by the government, the planned sale appears to be a minor event in the broader cryptocurrency landscape. As the crypto market continues to evolve, the methods of selling seized assets by the government are adapting, reflecting the maturation of the industry.

QQQ TRENDS AND PRICE TARGETS, HOW MANY Q's SHOULD ONE HAVE?Technicals
RSI is overextending, however, a little cool down would reset the indicators and trigger buy signals across the board.
Bears should be looking for an entry, but not entering yet. Plan out a trade.
Bulls should be locking in profits and looking to buy the dip.
There are two super short term trends that are taking the price up. They are both rejection trends, which are trending in the bullish direction, in other words, price is going up following those trends.
There is a huge rejection trend labeled.
There is a mega support trend labeled.
There is a strong support trend labeled, which should likely trigger a buy signal should it fall to that support or possibly dip under for a brief period of time.
Above 480 starts to increase risk.
it can go higher to 500, and then possibly even to 600.
500 is way more likely than 600 on this run.
short term, again, could use a cool down to like 393.
I would suggest to wait for this cool down to enter expecting bullish movement. With price falling to multiple strong support lines, it is a favorable trade.
Price can keep going up. Don't expect it to go down. But understand, if it does, you'll be prepared for that movement, and have a trade with a high potential of profit.
If you miss out on a run because you were caution, simply wait for a rejection point and jump in short. Ride the wave down, then enter your long position. In other words, don't chase the movement, let the movement come to you, let it move past you, then ride the movement in your desired direction.
Linking my other QQQ posts and SPY posts
I usually don't TA these because I tend to trade the 3x leveraged (FNGU FNGD is one of my favorites), and I tend to get predictions wrong on these two. Will link some old ones talking about spy to 480 in the election year. MY MISTAKE was I thought the election year was 2023, so it was way off.

⚡️Strifor || GBPUSD-25/01/2024Preferred direction: SELL
Comment: The British currency completely duplicates the situation with the EURUSD currency pair. Here, we also continue to stick to sales. The main target according to our previous trading ideas is the level of 1.25000 . Technically, and according to volume analysis, we have both an entry point and a resource in the form of bid-accumulations, due to which we assume a downward impulse will be generated.
On Thursday, that is, today a large number of economic events from the EU and the USA are expected. . Therefore, most likely today will be decisive and the instrument will finally shoot down, as we expect.
Thank you for like and share your views!
