Oil - Almost time to short?Oil is running into some pretty pivotal resistance.
You have to imagine Powell and elected officials want to get the price per barrel lower heading into election campaign and this inflation regime.
A bearish daily divergence just started but does not mean its time to short. A quick scan at these levels may be attainable but I think if we get one more final move into the next Fib level it would be a better R&R setup .
USA

Raytheon will succeed in WW3Raytheon Technologies Corporation is in a wonderful position, and will likely benefit heavily in the coming years. They are a company with strong fundamentals, plenty of employees, and constant demand from the US military. Missile defense systems will be sought after for decades to come.
Russian missiles have reportedly struck Poland today during a massive strike on Ukraine's infrastructure. US aid to Ukraine has reached over $5 billion, and does not seem to be stopping anytime soon. The attack will seemingly increase tensions between Russia and NATO, possibly leading to more sanctions or war.
Raytheon has plenty of room to decrease in the short term, but I personally think it is a great long-term play. The small dividend allows for more growth, and the profits are rising. I could surely see it hitting $100 in 2023.
This is in no way financial advice, I am not responsible for any losses taken. Invest at your own risk, this is an extremely volatile market.

LIQUIDITY MATTERS! Global liquidity vs #BitcoinLook at how the bullish green arrows and bearish red arrows show how global liquidity correlates HEAVILY with the direction of Bitcoin. T
You don't have to be a genius to see how beautiful this correlation is.
And how sensitive #BTC is to excess capital in the system.
As a risk on asset
When ppl have easy money to gamble with , a portion of that ends up in the #Crypto markets.
Currently you can see how aggressive the withdrawal of liquidity is across the globe
In the USA, EU, China & Japan.

Pandemic Champion Zoom will be back!In this work, I will analyze Zoom Video Communications, Inc., a leading company in the cloud communication and collaboration sector, which offers online videoconferencing, chat, telephony, webinars, among other services, for different segments and audiences. My investment thesis is that Zoom is an innovative and profitable company that has the potential to remain a leading video-based unified communications platform well into the future. To support this thesis, I will evaluate the qualitative and quantitative aspects of the company. In the qualitative part, I will describe Zoom's business model and strategy, showing how it differs from its competitors, what are its strengths and weaknesses, the opportunities and threats it faces in the global market. In the quantitative part, I will present Zoom's financial and operational data, demonstrating how it has grown in recent years, and what its projections are for the future, for a well-structured technical analysis based on Wyckoff, structures and volume delta.
_____ _____ _____
Company History
The company emerged in 2011, as a result of the vision of Eric Yuan, a former engineer at Cisco Systems, who recognized the need to create a simpler, reliable, and high-quality communication platform. The company launched its main product, Zoom Meeting, in 2013, and has since been growing rapidly in terms of customers, revenue, and profit. The company went public on the NASDAQ stock exchange in April 2019, with an initial public offering (IPO) of $36 per share. In June 2019, the company became part of the Russell 2000 index, which comprises smaller-cap companies in the United States. In April 2020, the company was promoted to the Russell 1000 index, which includes larger-cap companies in the United States. In august 2020, the company surpassed a market value of $100 billion, becoming one of the most valuable technology companies in the world.
Company's Sector of Operation
The company operates in the software as a service (SaaS) sector, which is a business model that provides information technology solutions over the internet, without the need for customers to install or maintain hardware or software. The SaaS sector is a growing and competitive industry, benefiting from digitization, mobility, and cloud trends. Within the SaaS sector, the company excels in the cloud communication and collaboration (CCaaS) segment, which offers online services to facilitate remote work, distance education, and social interactions. The CCaaS segment is dynamic and innovative, adapting to technological changes and consumer demands. It is also a challenging and regulated segment, facing competition from major market players like Microsoft Teams, Google Meet, Cisco Webex, and Skype.
Diversification and Innovation Strategy
The company's strategy is to diversify and innovate its products and services to meet customer needs and differentiate itself from competitors. The company aims to become an open and flexible platform that integrates various cloud communication and collaboration solutions. Some examples of products and services that the company has launched or acquired in recent years include:
Zoom Phone: a cloud telephony system that allows users to make and receive calls using the same Zoom Meeting application.
Zoom Rooms: an integrated system that transforms any physical space into a virtual meeting room with video, audio, and screen sharing.
Zoom Webinar: an online service that enables users to host virtual events with up to 50,000 participants and 100 speakers.
Zoom Chat: an online service that allows users to exchange instant messages with other Zoom users or external contacts.
OnZoom: an online platform that allows users to create, host, and monetize interactive virtual events, such as classes, shows, workshops.
Kites: a startup specialized in real-time automatic translation for video conferences.
SWOT Analysis
It is an essential tool for evaluating a company to invest in, as it offers a broad and organized view of the company's current situation. It consists of identifying the Strengths, Weaknesses, Opportunities, and threats that affect the company's performance. This is a qualitative analysis and does not replace technical or fundamental analysis.
The company's SWOT analysis is as follows:
Strong points:
Freemium model: Zoom offers a free basic plan that allows up to 100 participants and unlimited sessions of up to 40 minutes, attracting those looking for an affordable and quality solution for online communication. Ease of use: It is known for its simple and intuitive interface, which allows participants to start and join sessions with just a few clicks. The company also offers features such as virtual backgrounds and video retouching to enhance the look and feel of those involved during sessions. Global Usage: The platform has a global presence, with more than 300 million daily session participants and more than 213,000 enterprise customers worldwide. It also supports multiple languages and currencies, meeting the needs of diverse audiences. Financial strength: The company has experienced significant revenue and profit growth in recent years, driven by the high demand for online communication during the COVID-19 pandemic. Zoom's total revenue for fiscal 2023 was $4,393 billion, up 7% year-over-year. Business revenue was US$2.409 billion, an increase of 24% compared to the previous year. Brand name: The solution has become a household name and synonymous with online communication, thanks to its popularity and recognition among consumers. Zoom has also received several awards and recognition for its quality and innovation, such as the Webby Award for Best Mobile App in 2020.
Weak points:
Security issues: The company has faced many security and privacy issues in the past, such as “zoom bombing”, which is the unauthorized invasion of sessions by malicious people who interrupt or share inappropriate content. It has also been criticized for sharing consumer data with third parties without proper consent. They don't offer end-to-end encryption: Despite claiming to offer end-to-end encryption, the platform actually uses a type of encryption that allows the company to access session data if it wants to. This raises concerns about the confidentiality and integrity of participant communications. Zoom Rooms: Zoom rooms are a feature that allows stakeholders to create dedicated physical spaces for online communication using specialized Zoom or partner hardware. However, this feature is expensive and requires an additional monthly subscription, which may limit its adoption among customers.
Opportunities:
Growing demand: Demand for online communication is set to continue to grow in the future as more people embrace remote work and hybrid work models. The company can capitalize on this opportunity by expanding its customer base and offering customized solutions for different industries and needs. Up-selling: It can increase its revenue by encouraging basic plan consumers to upgrade to paid plans, which offer more features and benefits, such as longer sessions, more participants, recording and cloud storage, Zoom Phone and Zoom Rooms. Diversification: The platform can diversify its offer of products and services, exploring new markets and segments, such as health, education, entertainment, and e-commerce. The company can also develop new technologies and features, such as augmented reality, artificial intelligence and machine translation, to improve the user experience and differentiate itself from the competition.
Threats:
Intense competition: The company faces strong competition from other players in the online communication market, such as Microsoft Teams, Google Meet, Cisco Webex, Skype, and Facebook Messenger. These competitors have greater financial, technological and marketing resources than it does and can offer integrated and competitive solutions to customers. Regulatory changes: The platform is subject to various laws and regulations in different countries and regions, which may affect its operations and revenues. For example, it may face restrictions or bans from operating in certain markets due to national security, data privacy or human rights concerns. The company may also face fines or penalties for violating these laws and regulations. Dependence on network infrastructure: The quality and performance of Zoom services depend on the availability and reliability of network infrastructure, such as bandwidth, internet speed and stability. Any interruption or degradation of these factors could negatively impact the user experience and the reputation of the solution.
Final qualitative analysis opinion
ZM benefits from its freemium model, ease of use, global usage, financial strength and brand name. But, it also faces challenges such as security issues, lack of end-to-end encryption, cost of Zoom rooms, intense competition, regulatory changes and dependence on network infrastructure. The company can take advantage of videoconferencing demand growth, up-selling and diversification opportunities to overcome its weaknesses and threats. The platform must invest in improving its security and privacy, innovating its products and services and expanding its presence in new markets and segments. Zoom has the potential to remain one of the leading video-based unified communications solutions in the future.
_____ _____ _____
Fundamental Analysis:
We will introduce fundamental analysis, focusing on the company's financial health and performance. For this, we will use financial data from the second quarter of the fiscal year 2024 (ended on July 31, 2023). The financial indicators we will consider are: EBITDA, CFO, ROE, ROIC, Gross Margin, and Operating Margin.
Description of fundamentals:
Source: Yahoo Finance
The company has good liquidity, as it has a high ratio of liquid assets in relation to liquid liabilities, which indicates a low default rate on its basic obligations and low default rates. Furthermore, the company has a large loss in relation to equity and this further reduces its potential market value.
Source: Yahoo Finance
The company has excellent financial health and strong performance. The company demonstrates high operating profit (EBITDA), good cash generation (CFO), good return on equity (ROE) and invested capital (ROIC), and good gross and operating margins. These results show that the company is efficient, profitable, sustainable, and competitive in the video conferencing and online collaboration market.
Other Fundamentals indicators
We will address other economic indicators that are not as necessary but can be incorporated into our fundamental analysis.
Source: Yahoo Finance
The data in this table shows that the company has a good financial performance, but also faces some problems. For one, Zoom Meeting has a high P/E Ratio, which indicates that investors expect future earnings growth from the company. Zoom Meeting also has a high Enterprise Value, which represents the company's total value in the market. These indicators suggest that Zoom Meeting is a successful and innovative company, offering a high-quality and in-demand communication service. On the other hand, Zoom Meeting has a low P/B Ratio and a low PSR, which indicate that the company is trading at a price well above its book value and sales. This could mean that Zoom Meeting is overvalued or faces strong competition in its industry. Furthermore, Zoom Meeting does not pay dividends to its shareholders, which may discourage some investors looking for a stable and secure income. These indicators propose that Zoom Meeting is a risky and volatile company that depends heavily on market expectations and industry trends.
Final opinion of fundamental analysis
It has significant potential for growth and generating value for shareholders, especially in a scenario of increased demand for digital solutions, but it needs to face the threats mentioned previously in the company's SWOT analysis. .
Technical Analysis
To begin the study, first, we observe that the stock was launched in April 2019, and in January 2020, there was a significant increase, as we can see in the weekly chart. With this, we will divide this technical analysis into three parts. In this chart, we have the presence of three volume profiles. It calculates volume by price level based on the Gaussian curve and is excellent for measuring long-term position buildups, especially in a weekly chart like this.
Analysis of the first profile:
ZM Weekly Chart
Note that, since the IPO process, the stock appreciated by 671.09%, which is quite substantial. Many companies were negatively affected during the pandemic, but this one inadvertently benefited from the COVID-19 pandemic. In this first profile, we see the largest position buildup right at the range of 68.75 to 76.95. You can already see 2 candles of aggression, as shown in the second graph, causing significant drops.
Analysis of the second profile:
ZM Weekly Chart
Observing the second profile, we see a lack of demand from buyers and a position buildup on the selling side, unlike what we observed at the beginning.
Analysis of the third profile:
ZM Daily Chart
Upon examining the last profile, we see that despite the market coming from a downtrend channel, we can observe a drastic increase in volume per price level, which is a characteristic of a position buildup. As we gradually see, the seller has been reducing their position, and furthermore, the stock is in a downtrend channel that if it surpasses 78.50, combining it with the fundamentals, we could potentially have an upward trend.
Macroeconomics and Technical Analysis
Surprisingly, Zoom is not the only one that experienced a drop that significantly devalued its stock. Several companies listed on the Nasdaq Composite, including the Nasdaq Composite itself, suffered from a drop that impacted the United States economy.
E-mini Nasdaq Weekly
This was motivated by high inflation, which reached around 9%, which is indeed a very concerning figure for the US economy. By February, inflation had already reached 7.5%, which was already a very high percentage, as technology companies react poorly to inflation. This explains the poor performance of these stocks.
February table
Source: Tradingview Economic Calendar
These data explain the drop in assets listed on the Nasdaq, but surprisingly, Zoom was affected much more than the other companies. Later, when the price started to increase slightly;
And the year 2022 contributed even further to the devaluation of ZM shares. But as we can see, the asset was already in the process of falling long before:
ZM Daily Chart
There was the beginning of a bearish rally there.
Even if the current data are not so favorable, the deflation process that occurred in the United States, together with the artificial intelligence race, could also be a detail that will greatly help in the ZM valuation process.
September table updated
Source: Tradingview Economic Calendar
September's data clearly reveals a drop in inflation, but with several very significant drops, in addition to some negative points such as the reduction in job creation and economic development. Look at the table below:
Source: Tradingview Economic Calendar
Based on this table, Zoom Communications could have a positive result as the company recorded a drop in inflation in September, implying that the costs of products and services decreased. This can benefit consumers and businesses that use the Zoom Service.
Conclusion
Zoom Video Communications Inc. is a company with good financial and market performance, despite the broad devaluation it suffered in 2021/2022. It demonstrates good fundamental analysis with strong revenue and profit growth, a high net margin, low debt and a good market value.
The company also presents good technical analysis. It is undervalued, having been at an all-time low since its IPO, building a position for a likely long-term upward trend. Although the macroeconomy does not favor the variable income market due to a high interest rate of 5.5% (possible readjustment to 5.75% in September), it can also benefit from the ongoing economic deflation, which should stabilize in the end of 2024.
It also has the potential to recover from the decline it has experienced and stand out in the technology market, especially in the videoconferencing segment, which has been less and less in demand post-pandemic and in times of remote work. Demonstrating its ability to innovate and adapt to changes in the economic and social panorama, offering quality and safe solutions to its customers. Therefore, it is believed that Zoom is a good investment option for those seeking long-term profitability and growth.
I hope you enjoyed this article and found it helpful. Thank you for your attention, and until next time!


PayPal added to the watchlistShares of PayPal lost nearly 82% of their value since the top in July 2021, and judging solely by this metric, one could consider the stock cheap. Nonetheless, there is more to it. In 2022, PayPal saw its revenue increase by 8% on a yearly basis and transaction volume grow by 16%. In addition to that, the company processed 22.3 billion payments and $1.36 trillion in total payment volume, with active accounts rising by 2% YoY to 435 million. However, its operating margin dropped by 10% and net income by 42% (using GAAP accounting).
In the first quarter of 2023, the company delivered better results compared to the first quarter of 2022, with net revenue growing 9% YoY, operating income by 41% YoY, earnings per share by 62% YoY, and net income by 56% YoY. As for the second quarter of 2023, the company reported a further increase in net revenues by 7% YoY, operating income by 48% YoY, and earnings per share by 414% YoY. In this quarter, PayPal generated $1.029 billion in net income compared to the loss of $341 million a year earlier.
Based on some of the fundamental improvements and cheap valuation, we think PayPal is growing increasingly attractive and worth watching out for. However, we would like to emphasize that the stock keeps making lower lows and lower highs. Thus, entering the trade is still quite risky. One alternative to approach this situation is to wait for a price to break above the upper bound of the channel and place a long entry there with stop-loss below the bound.
Illustration 1.01
Illustration 1.01 displays the daily chart of PayPal and its losses since the top in July 2021.
Technical analysis gauge
Daily time frame = Bearish
Weekly time frame = Bearish
*The gauge does not necessarily indicate where the market will head. Instead, it reflects the constellation of RSI, MACD, Stochastic, DM+-, ADX, and moving averages.
Please feel free to express your ideas and thoughts in the comment section.
DISCLAIMER: This analysis is not intended to encourage any buying or selling of any particular securities. Furthermore, it should not be a basis for taking any trade action by an individual investor. Therefore, your own due diligence is highly advised before entering a trade.

#XAUUSD#XAUUSD
REASON
XAUUSD
1)DOWNTREND
2) REVERSAL
UP
1) in a DOWN trend
2) In CHANNEL Breakout
3) HighXAUUSD volume
Signal Type:SHORT
TRADE WITH YOUR OWN RISK

Why Nasdaq growing along line and when this end 📏Since the beginning of year, Nasdaq index has been growing literally along the line, and the largest companies are dragging it in turn: NASDAQ:NVDA , NASDAQ:TSLA , NASDAQ:GOOG , NASDAQ:MSFT .
According to the classics of "hamster races", each new ruler increases the angle of inclination.
Since May of this year, the angle has increased as buybacks from companies and a “big bull” with options with an expiration date of zero from individuals investors have come into play.
And here we are again approaching the lilac line, now the index should again surprise everyone and increase the degree of upward slope OR a protracted fall will begin already from the current levels, since all fundamental and technical reasons have long been ripe for a reversal 🫡
Already on Thursday, we can see strong volatility and a break in the trend, as the last major mammoths report: NASDAQ:AAPL and NASDAQ:AMZN
In the medium term, it is not their numbers in reports and forecasts that are extremely important, but the volume of the buyback program, which usually drags the market up.
However, past reported mammoths have not issued buyouts, which means there is a high chance that we are already very close to the peak.
⚔️ Nearest resistance: 16500p. - ATH!
🛡️ Nearest support to start purchasing techs: 15000p; 13550p.

FrogAlgo: USA Economy💥It is important to understand that the US economy represents approximately 25% of the global GDP, despite having just 334 million people, which is around 4.25% of the global population. This context is crucial for comprehending various narratives prevalent in media and politics. Here are a few examples to illustrate this point 🧵:
♦️China, with 1.45 billion people (18.5% of the global population), contributes $18 trillion (18%) to the global GDP.
♦️India, with 1.4 billion people (18% of the global population), generates $3.4 trillion (3%) of the global GDP.
♦️Russia, with 146 million people (1.87% of the global population), produces $2 trillion (1.9%) of the global GDP.
💥When the BRICS nations (Brazil, Russia, India, China, South Africa) are combined, their 3.3 billion people (43% of the global population) contribute $26 trillion (26%) to the global GDP.
💥Despite the large population of the BRICS nations, their economic output barely matches that of the 334 million Americans. However, it would actually be beneficial for the US if the BRICS nations were to increase their GDP. As these 3.3 billion people become wealthier, they would become potential customers for American high-end goods and services. Consequently, the US would see increased profits. It is worth noting that the US dollar would strengthen in such a scenario, considering the 334 million Americans would have significantly more affluent customers to cater to.
💥Comparatively, Russia's 1.9% share of the global GDP pales in comparison to the US's 25% share. This is also true when considering the collective economic power of the 32 NATO member nations or the 50 countries supporting Ukraine. By engaging in actions detrimental to its own economy, such as the annexation of Crimea or involvement in Ukraine, Russia's leadership, under Putin, has effectively committed economic suicide on behalf of its people. This situation has created a humanitarian crisis without any tangible benefits for Russia. Even if Russia were to conquer Ukraine and the former Soviet bloc, the strategy of scorched earth is not conducive to maintaining a healthy and vibrant economy.
💥These examples serve to demonstrate how understanding this piece of information can help individuals better contextualize and discern between the plethora of narratives, whether accurate or unfounded, that circulate constantly in various domains.

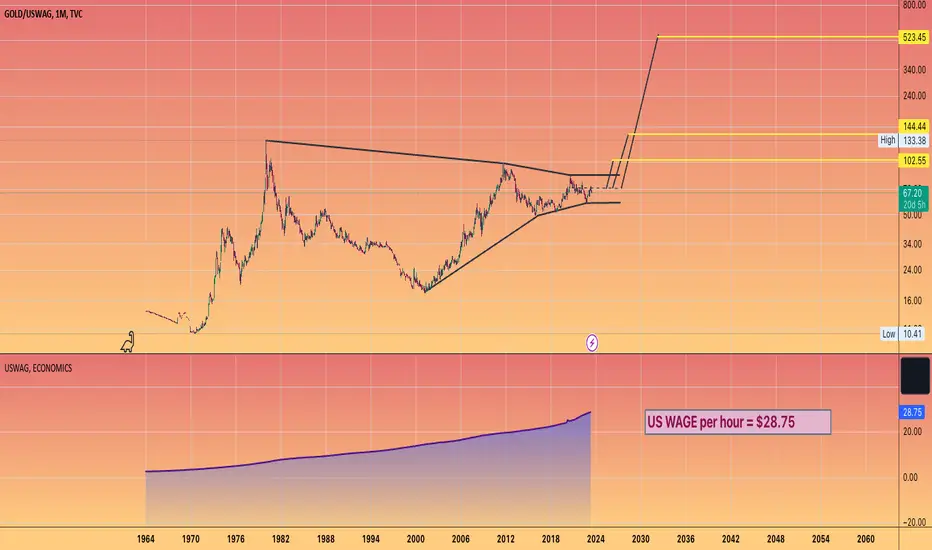
BEFORE 1971 u could acquire 1 #Gold Oz for 10 hours of labourThe erosion of wealth via #fiat debasement is clear for you to see on this chart
With the price of gold denominated us avg salary per hour
* The BLS actually has a higher number of $32 ... but the data on that price has less historical data.
NOW it takes nearly two weeks of labour to acquire 1 oz
(pre tax and living expenses obviously)
But this chart also perilously points how painful the end of US dollar dominance could be.
Pointing to an astronomical level of over 500 hours of work to get one gold ounce.
Clearly adding #PreciousMetals to your portfolio could be one the great wealth builders in the coming years.
NDX- 3 Possible CountsHello traders!
We are now analizing possible NDX Elliott Wave counts possibilities.
Starting from October's low, price created a leading diagonal (or triple three), labeled as wave W, followed by a double zig zag.
This movement stopped at 15280, declining in a corrective wave and now retracing towards previous top.
This outlines three possibilities:
1.- The whole movement from October's low is a triple three correction in wave (B) to the upside, and now wave (C) is starting towards lower lows. This count will now require an impulsive wave down to break 14200.
2.- The whole movement from october's low is a leading diagonal in wave 1/A, and now a deep retrace is expected, wave A of this retracement should be a flat (3-3-5) , and thus a 5 wave down is expected
3. The whole movement from October's low is the beginning of uptrend resumption, the one labeled in the chart as wave W is a leading diagonal wave 1 and we are currently in wave iv of 3. This will imply either that wave 4 of 3 is finished and we are going for higher highs, or either wave c of iv is about to unfold towards 14300.
In most cases, a 5 wave down to at least 14300 is about to unfold, that's why we opened a short position looking to tp at 14300, sl at 15290

Analysis of the US stock market , NAZDAQAnalysis of the US stock market
Fortunately, according to the analysis, 3.5% of the growth index has been achieved from 4%.
According to the status of the RSI indicator and the volume and candles, it is logical to save profit and exit the market for a new entry in a suitable position.
The first suitable point for re-entry is the previous entry range of the index (about 13333).
And this time for 6% profit.
Don't forget capital management and compliance with risk to reward
Good luck and profitable

Dollar Index (DXY)dxy tested trend line and can't break trend line i think now rise to test supply zone and resistance if can't break resistance can drop to bottom of trend line and if can break we can get another drop to support zone drop after pullback to trendline or resistance

#NZDUSD - ORDER BLOCK POTENTIAL 7:1 RRR Guys use short stop of 6 pips
The price of entry is 0.6097, enjoy with this Orderblock

EURUSD - Reversal on Thursday new your sessionEURUSD will rise until the previous weekly high, and reverse on thursday new york session going lower for a very long short

American stock exchangeAmerican stock exchange
According to the previous analysis, the stock index was able to touch the ceiling of its 170-day ascending channel.
Currently, the current candle is being modified.
You can wait until the yellow line to enter again.
And if you are a risk taker, wait until the purple line.
Or enter 50% on the yellow line and the remaining 50% of the position you want on the purple line.
- Considering the fundamentals and the stoppage of the increasing trend of bank interest rates, one can hope for a small correction to the mentioned lines and then continue the upward trend.

Eur Dollar Long Term These are long term expectations relative to the Eurodollar and the most important levels that will be affected by it in the future

Sp500 Forecast: Unusual day and last hope for bull 🧙♀️ On third Friday of March, June, September and December, most options and futures expire.
Already today there will be a large quarterly expiration, popularly called "Quadruple Witching",
In total there are 4 of them per year (at the end of each quarter).
In last hour of a trading session, trading volume and market volatility usually increase sharply.
💫 As a rule, this is followed by a medium-term trend change or strengthening of the previous one.
Since March expiration, SP500 has grown by as much as +10%!
Almost 90% of this growth was provided by just few companies: NASDAQ:NVDA , NASDAQ:MSFT , NASDAQ:AAPL , NASDAQ:TSLA , NASDAQ:META .
And since beginning of year, it has grown by +15%, that is, there has already been an increase in the growth trend.
The whole quarter went up.
For your convenience, I put the witches on chart.
The picture clearly shows that magic happens on “witch days” and medium-term extremes of market 🪄
There is extreme greed in USA market right now - the perfect moment for a market reversal!
At such moments, unjustified pumps are visible in some unprofitable companies: NYSE:SPCE , NYSE:AI , etc.
If you are stuck in these papers, now is a good time to sell.
But from next week you can already start wearing shorts, summer is coming ☀️🩳
Now, the US Ministry of Finance and FED are also playing on side of the bears, which are withdrawing liquidity from the market.
Market reversal is 99% ready ✅
🎯 Targets for a set of medium-term long positions: 4000p, 3800p.
You can find even more profitable ideas in the profile header 🎩
If you are interested in analysis of any other asset - write in the comments and I will do it.

US10Y - INMINENT SELL OFF US10Y - 10 YEAR BOND WEEKLY TENDENCY ANALYSIS
THE 10 Year Bond Started Buying from Weekly Demand (green)
Then reached Monthly Supply that generated a new/fresh weekly Supply to start reversing the price
Destiny: Weekly demand (green)
Stages/Weekly tendency - Stan Weistein
- STAGE I: Price consolidate Between SMA 30 @ Weekly TF
- STAGE II: Price break consolidation and make highs above SMA 30 @ Weekly TF
- STAGE III: Price consolidate Between SMA 30 @ Weekly TF
- STAGE IV: Price break consolidation and make lows below SMA 30 @ Weekly TF

AUDUSD THE BIG SHORT IS READYThe AUD/USD pair is consolidating near the critical resistance level of 0.6800, following a recent climb to a one-month high. Mixed economic data and anticipation surrounding the Federal Reserve's statement have led to a need for consolidation or a possible correction. The Australian dollar received support from the People's Bank of China's decision to ease short-term policy rates. In the US, consumer inflation eased, solidifying expectations of a Fed pause. The pair's near-term direction hinges on the performance of the US dollar and overall risk sentiment. Technical indicators suggest the potential for a correction, although a daily close above 0.6800 would indicate further upside potential. Key support levels to monitor are at 0.6745, 0.6710, and 0.6680, while resistance levels can be found at 0.6780, 0.6820, and 0.6845. Traders should conduct thorough analysis before making any trading decisions.
Nicola, CEO of Forex48 Trading Academy

XAUUSD PULLBACK BEFORE THE BIG SHORTThe price of gold has experienced a reversal, dropping below $1,950 after briefly surpassing $1,970 earlier in the day. This decline can be attributed to the benchmark 10-year US Treasury bond yield, which is currently rising and approaching 3.8%. The increase in bond yield comes as a result of the recent drop in US CPI data, which has had a negative impact on the XAU/USD (gold/US dollar) pairing.
The price of gold took a downward turn, slipping below the $1,950 mark after briefly surpassing $1,970 earlier in the day. This reversal was driven by the sharp rise in the benchmark 10-year US Treasury bond yield, which is now approaching 3.8%. The surge in bond yield was triggered by the weaker-than-expected US CPI data, putting pressure on the XAU/USD (gold/US dollar) pair.
Nicola, CEO of Forex48 Trading Academy

Brazilian bank with space potential 🚀
Warren Buffett is famous for his investments, which he makes right at very bottom, and then holds them for many years and stocks bring him > 1000%!
There is a high probability that history will repeat it self with this cryptocurrency bank, in which he invested $ 1 billion a couple of years ago.
In fact, this is the only bet on the cryptocurrency of an elderly investor.
🏦 Nu provides digital banking services.
Every year the revenue of this bank grows by 100-200%!
The company attracts between 4 and 10 million new customers every quarter.
Given population of Latin America, the fintech company boasts significant growth potential in medium term by capturing market share.
But it should be remembered that while the bank is unprofitable, but as soon as the first profit appears, this rocket will not be stopped!
According to technical analysis, the stock found a bottom in region of $3-4 per share.
Now a new growing channel has been formed, which is confirmed by high volumes, so there is every chance that the uptrend will continue.
60% remains to the historical maximum, we will probably see this goal already this year.
💳 Nubank
Ticker: NYSE:NU
🔰 Entry price from: 7.3$
📊 Repurchase price: $5.6, $4.
🎯 Goals: $12, $15, $18
💼 Volume per trade: up to 0.5-3% per portfolio
📈 Potential return: up to 150%
It is better to keep this deal for the medium term.
You should enter the deal gradually, without rushing.
Initially at 0.5-1% of deposit.
If the stock falls, then you can average the position by 1-2%.
If the stock grows, then the entry point was good and you can increase the position by 1-2%.
You can find even more profitable ideas in the profile header 🎩
If you are interested in analysis of any other asset - write in the comments and I will do it.

🔥 Bitcoin's Last Hope For The BullsOver the last two days, Bitcoin has been dumping on Bearish SEC news from the USA. In the short-term, the bears are 100% in control and are actively pushing the price down.
However, the bulls might have a last trick up their sleeve.
We're rapidly approaching a massive zone of support that has been established around a year ago. If there's any big buyers left, they are waiting within this zone. A bullish reversal from this zone could signal an end to the ~2 month bearish trend. This would be in line with my long-term bullish Elliot Waves analysis on Bitcoin below.
However, if this zone fails to hold the price, I'd expect that there's more selling to come.
Seeing that this is a news-related selling event, it's hard to determine whether we're going to reverse or not. Technical analysis has a lot less impact once trading is based on pure emotion.
Nevertheless, keep a close eye on this zone since it will likely cause some heavy volatility, either to the upside or downside.
