The FED continues to imply a recessionYesterday, the FED hiked interest rates by 25 basis points, causing an initial rally in the U.S. stock market, followed by a selloff after FOMC’s press release. In his speech, Jerome Powell acknowledged the persistence of high inflation (replacing the tone of “easing inflation”), banking sector problems, and a strong labor market. Furthermore, he reiterated FED’s commitment to bringing the inflation rate back to 2%, adding that “some additional policy firming” may be required to achieve this goal (translating to the possibility of more rate hikes).
As for projection materials, the median forecast for the unemployment rate in 2023 is 4.5% (and 4.6% in 2024). We discussed a few months ago that historically, each 1% increase in the unemployment rate was always accompanied by a recession. Therefore, considering that the unemployment rate was 3.4% in January 2023, we could argue that the FED implies a recession over the course of the current year (even though it has been implying it at least since September 2022 through its forecasts).
In addition to that, the FED’s documents show a median forecast for FED’s fund rate at 5.1% in 2023, which is higher than the current target range of 4.75% to 5% (telling us that interest rates should be higher at some point). In our opinion, this means only more stress for the already weak U.S. economy. Due to that, we will stick to our previous assessment of more downside for the stock market in the coming months. Accordingly, we maintain our price target for SPX at $3 400.
Illustration 1.01
Illustration 1.01 displays the 5-minute chart of ES1! continuous futures. Yellow arrows indicate particular events in the market. Vicious whipsaws in the price can be observed.
Technical analysis
Daily time frame = Bearish (Weak trend)
Weekly time frame = Neutral
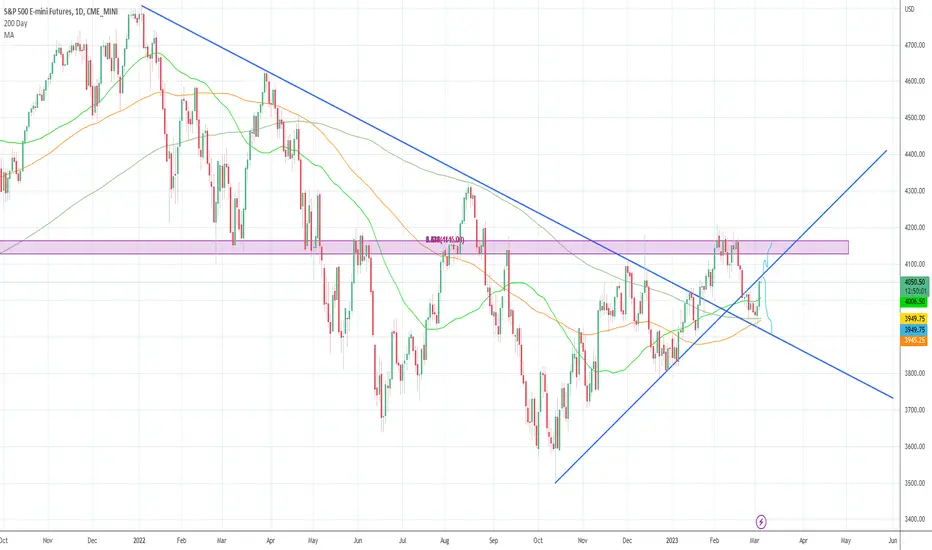
Illustration 1.02
Illustration 1.02 shows the daily chart of SPX and the bullish breakout, followed by invalidation after Jerome Powell’s speech. We will pay close attention to today’s price action in SPX. To confirm a bearish bias, we would like to see the price stay below the sloping resistance (ideally, manifesting more weakness).
Please feel free to express your ideas and thoughts in the comment section.
DISCLAIMER: This analysis is not intended to encourage any buying or selling of any particular securities. Furthermore, it should not be a basis for taking any trade action by an individual investor. Therefore, your own due diligence is highly advised before entering a trade.
USA

XAUUSD Technical Analysis 23.03.2023 1h chart– Previous Daily candle closed Bullish at 1970.100 forming new Daily Support at 1940.600.
– Buys on close above 1974.500 targeting 4h Resistance at 1981.500, Leaving Runners to the Daily Resistance formed at 1988.500.
– Sells on close below 1961.000 targeting 1h previous Resistance formed at 1953.500, Leaving Runners to the 1h Support at 1946.200.
– We have High Impact News data ahead on the New York session with Unemployment Claims and New Home Sales

Collapse of the Dollar???DXY is approaching very important and critical zones on a monthly timeframe.
Could this zones finally weaken the dollar?
Have in mind that this analysis is done on a monthly timeframe so don't expect anything to happen in just a few days....

UNG - Natural Gas ETF - Potential Double Bottom Support PlayUNG (US Natural Gas ETF) has formed a double-bottom price pattern on the Daily chart.
The Price has found temporary support above $8.21.
Support Price Targets are: $8.21, $8.16, $7.72, $6.11.
Resistance Price Targets are: $8.99, $9.93, $10.97, $11.97.
UNG etf does not always correlate & follow technical analysis charts.
Be aware of global fundamental news changes regarding energy assets (government policies, corporate policies, supply & demand, etc).

BREAKDOWN ANALYSIS NASDAQ 17/03/2023dear traders nasdaq was up trend and the daily candle closed bullish so i expect nasdaq will correct this move
follow my instruction and respect the levels of price wait for the good opportunity
trade safe

JP Morgan Bank will have a big crashJB Morgan Bank will collapse we are already at the beginning of a financial global crisis and it will be affect even on stock prices and we may see stocks fall by 90-95% of current prices. The gold is the only one safest in this next collapse. Even Bitcoin will not survive this collapse and will be pricely affected significantly and can see it on 1k or lower, so be careful and prepare new liquidity to enter

GOLD CPI NEWSToday we have HIGH impact NEWS.
We have this 2 profitable scenarios.
1-HIGH CPI GOLD, STOCK MARKET bears (FED ACTIVE)
2-BETTER THAN EXPECTED GOLD, STOCK MARKET bull (FED slow down)

SPX retest the uptrend, if rejected we go lower SPX seems to test the uptrend broken in Feb. If we can get back up, we could expect the rally to continue. If we fail, we will probably go visti 3.9k.
NFA.

S&P500 - When will the upside finish?From a while we have been following the idea of SP500 following a double zigzag to the upside targeting 4300+. We believe this upside to be temporary as per the structure of the downside leg from January's top and the low volume of the recent upside.
In this previous post we outlined the idea of the last C wave of the second zigzag to be about to start, and a possible microcount is showed in the main chart.
The microstructure of the last bounce suggest it to be the beginning of another leg up (5-wave). We will therefore search for another long entry in micro wave ii, ideally with a retest of the greenzone. A breach of 3900 will suggest the bearish scenario and the possibility of the primary wave (B) to the upside to already be finished.
We will update below.
Happy trading!

Could we even see the 70's for matic/usd??????
The charts don't like and we know the US and crashing BTC on purpose.

S&P 500- In the target boxHello traders!
As per previous posts, we believe the SP500 to be in a primary wave (B) to the upside correcting the donwtrend from January's 2022 top.
Here is the count on the daily time frame:
Price action shows this primary wave (B) unfolding as a double zig-zag. The structure of the last decline from 4194 seems a 3-3-5 that would complete wave B of the last zig-zag, thus providing a setup for trading the last leg up of primary (B) to 4300+.
From a pattern perspective, we can see the bearish wolfe wave target at the main downtrendline in blue.
Will search from long setups lower in the green target box and will update below.
Happy trading!
GMR

Federal Reserve Declaration About Interest Rate Affedcted DXYTwo Weeks Ago , Federal Reserve has confirmed that they will continue incresing the interest rate progressively , sso that will affect the metal gold to go down deeper and deeper , and all technical’s indicators confirm this . What do you thing so ?

A brief history of DXY and the RSIThere are just some of the Key points on the chart but the real trick is to watch the RSI here ( the blue line above the US inflation index at bottom of chart)
The US inflation indicator shows RED after 1995, when inflation is above the 2% dictated by the FED as Good. Inflation peaks are marked on chart with thin solid vertical lines.
Compre these to RSI and PA levels
The USA was in an inflation explosion from 1979 to 1984 and it reached a height of 14% before turning down
The Thing to note here is the value of the $, as inflation rises, so does the value of the $, logically I suppose.
As inflation is fought with higher interest rates ,the $ becomes a money earner, for the banking industry and savers
Look at the RSI, See how it rises, Ranges and then eventually dips
Then RSI Ranges, as does the $ till we get to July 1995 and the Barings banks Saga.
This was a banking collapse and yet, Look. the $ GAINS value and RSI drives higher, Tops out and Drops,
Then again in 2008, another banking crash, this time Leman Brothers cause a Loan repayment Surge, bit like a bank run
Again, at a time of Stress, the $ Pushes up in value, RSI Runs high and Tops
Since then, RSI has remained mid / high and topped out again in July 2022
Since then, it has retraced and has recently tried turning again
But now, the $ has less demand globally as Countries around the world Stop using the $ as international trading currency, including Oil
So the question is, Where for the $ now
Technically, It has been up in the higher range RSI for a long time, inflation is High and as we can see from the past, PA tends to drop

easyMarkets Dow Jones Daily - Quick Technical OverviewAfter a recent decline, the DJIA index found support near the 32700 area, which is near the lowest point of December. If, eventually, that support area surrenders, this could clear the path towards the 31740 zone.
Alternatively, a break above a short-term tentative downside resistance line, drawn from the high of February 14th, could help attract the bulls back into the game. More of them may join on a move above the 200-day EMA.
Disclaimer:
easyMarkets Account on TradingView allows you to combine easyMarkets industry leading conditions, regulated trading and tight fixed spreads with TradingView's powerful social network for traders, advanced charting and analytics. Access no slippage on limit orders, tight fixed spreads, negative balance protection, no hidden fees or commission, and seamless integration.
Any opinions, news, research, analyses, prices, other information, or links to third-party sites contained on this website are provided on an "as-is" basis, are intended only to be informative, is not an advice nor a recommendation, nor research, or a record of our trading prices, or an offer of, or solicitation for a transaction in any financial instrument and thus should not be treated as such. The information provided does not involve any specific investment objectives, financial situation and needs of any specific person who may receive it. Please be aware, that past performance is not a reliable indicator of future performance and/or results. Past Performance or Forward-looking scenarios based upon the reasonable beliefs of the third-party provider are not a guarantee of future performance. Actual results may differ materially from those anticipated in forward-looking or past performance statements. easyMarkets makes no representation or warranty and assumes no liability as to the accuracy or completeness of the information provided, nor any loss arising from any investment based on a recommendation, forecast or any information supplied by any third-party.

USOIL (CRUDE OIL) PERFECT BEARISH SETUPTVC:USOIL
HI , TRADER'S ... AS YOU CAN SEE IN CHART , MARKET IS TRADING BETWEEN MAJOR SUPPORT & RESISTANCE LEVEL
According to detailed analysis , Market is in bearish trend and in higher time frame's making h&s pattern
Which suggesting further decline in price's , So it will be profitable to take Sell entry after retesting of Major resistance level
Target will be 400 pip's

Blackstone. Long The company NYSE:BX has been in the downstream channel for a year now.
Nevertheless, the $90 level formed a support, trading above which prepared a springboard for exiting the channel up 🔺
Release timing 4-6 months

S&P500 - Temporarily exhaustedHello traders!
As presented in previous posts, we believe that price has showed to be in a primary wave (B) to the upside to correct all the downtrend from January 2022 high. Price is likely to ungoing the last leg up of this upside correction. Low volumes and over entusiasm about the soft landing narrative suggest us that this rally can go up to 4300+ before reversing, but we do not take higher highs as our base case.
However, price arrived at a big resistance, with the blue wlfe wave still valid, and managed to exhaust the upside steam creating multiple divergences e lower lows. Also, VIX seems to be about to breakout a bullish wolfe wave :
We sometimes get insights by looking at VVIX, which is the same algorithm of the Vix applied to the VIX itself:
Here we can see that VVIX already broke out, suggesting bullishness for the VIX and bearishness for the index.
We are therefore short from @4152. Our stop loss is already placed on entry. Our first target is 3940, we will re evaluate the price action if we get there.
Breaking 4090 confirms more downside.
Happy trading!


S&P500 - Resuming leg upIt seems that this correction in wave 4 of C of primary (B) to the upside (targeting 4300+) finished before what we were expecting, at 4054. Price action in the descent looks choppy and a descending broadening wedge has formed. Nasdaq already broke its 4H bull flag.
We therefore closed our short and got long at 4120.3. Stop loss 4100 risk 0.4%

Bears surrounded the DXYAfter given breakout from the parallel bearish channel, DXY has found it self in heavy waters as it struggles to close above MA50 and subsequent horizontal resistance line. It is likely that DXY will retest lower support lines as hidden bearish divergence is also evident.
