ProShares Ultra VIX ETF (USA: $UVXY): Good Area To Accumulate 👌UVXY offers daily leveraged exposure to short-term VIX futures, designed to capture the volatility of the S&P 500, in a commodity pool wrapper. As a geared product with daily resets, UVXY is designed as a short-term trading tool and not a long-term investment vehicle. Returns over holding periods greater than one day can be, and often are, significantly different from 1.5x. Like its peer products, UVXY does not deliver leveraged returns on the VIX index itself, but on front- and second-month futures contracts. As a commodity pool, investors will get K-1 at tax time but avoid the counterparty risk of an exchange-traded note. Prior to February 28, 2018, the fund provided 2x leveraged exposure.
USA

EURUSD ShortHey traders. in today's trading session we are monitoring EURUSD for a selling opportunity around 1.099 zone, once we will receive any bearish confirmation the trade will be executed.
Trade safe, Joe.

XAUUSD LongHey traders, in today's trading session we are monitoring XAUUSD for a buying opportunity around 1920 zone, once we will receive any bullish confirmation the trade will be executed.
Trade safe, Joe.

BEARISH DXYHey traders, in this week we are monitoring DXY for a selling opportunity around 98.9 zone, once we will receive any bearish confirmation the trade will be executed.
Trade safe, Joe.

Keep your eye on Xtiggers are apparent hopping for bust through! need some infrastructure bill! come on Uncle Biden Keep your Eye on the Ball

Apple looks pretty goodAfter a necessary correction, Apple looks positive again. If Apple breaks out of the triangle, a bullish upward movement could follow.
Let's hope for the best!

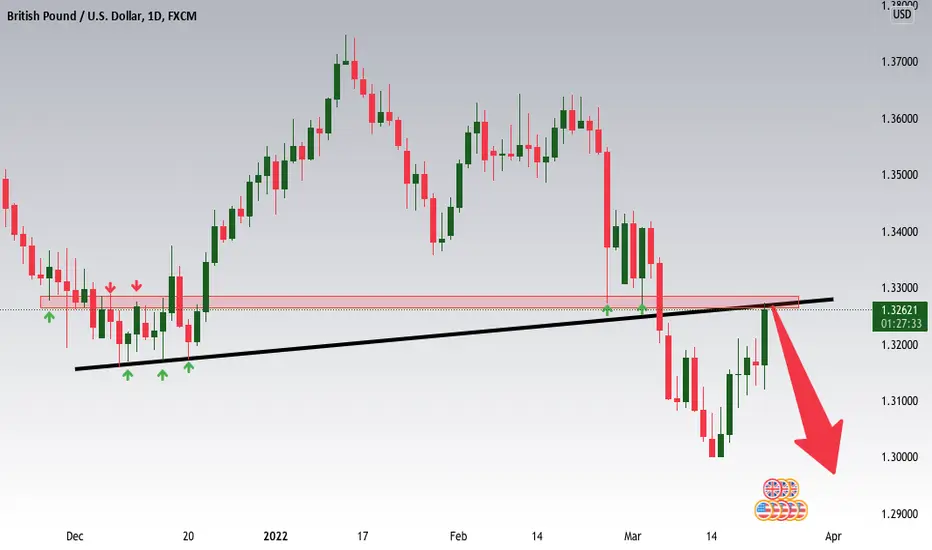
GBPUSD ShortHey traders, in the coming week we are monitoring GBPUSD for a selling opportunity around 1.322 zone, once we will receive any bearish confirmation the trade will be executed.
Trade safe, Joe.

audusd shortBy forming a corner pattern, it is ready after a strong spike, now it is ready to fall. My apologies are ready for you.


Channel Breakup Hawk SetupUSDT.D will break up its channel.
Dominance sits on a set of support trendlines now.
According to chart pattern rules (falling channel), target is the green circle.
AI recommends long on USDT.
(Short on Bitcoin.)

US30 shortHey traders, in the coming week we are monitoring US30 for a selling opportunity around 34900 zone, once we will receive any bearish confirmation the trade will be executed.
Trade safe, Joe.

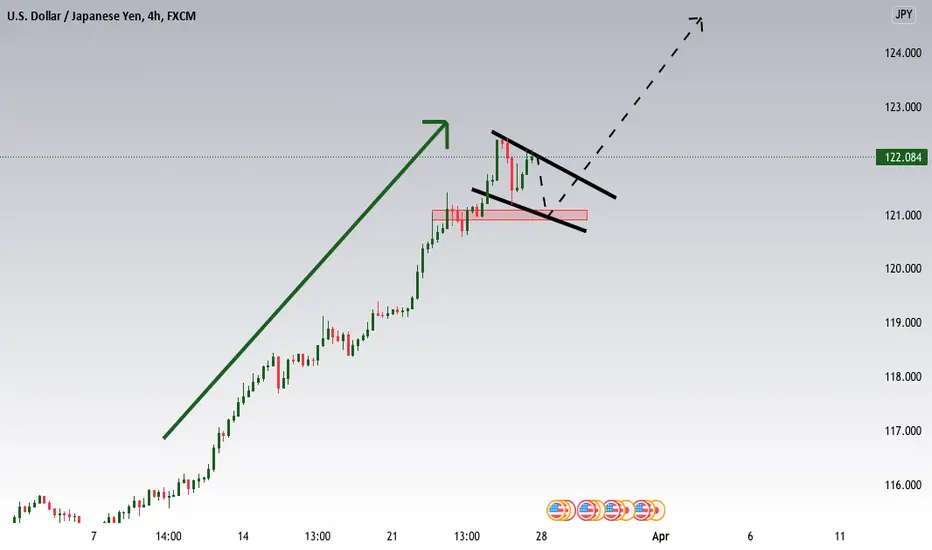
USDJPY LONGHey traders, in the coming week we are monitoring USDJPY for a buying opportunity around 121 zone, once we will receive any bullish confirmation the trade will be executed.
Trade safe, Joe.
GBPUSD ShortHey traders, in today's trading session we are monitoring GBPUSD for a selling opportunity around 1.321 zone, once we will receive any bearish confirmation the trade will be executed.
Trade safe, Joe.

USDCAD ShortHey traders, in today's trading session we are monitoring USDCAD for a selling opportunity around 1.25500 zone, once we will receive any bearish confirmation the trade will be executed.
Trade safe, Joe.

EURUSD Mar. 24, 2022Not legal and financial advice;
Any information provided here is only the personal opinion of the author.

USDCHF LongHey traders, in today's trading session we are monitoring USDCHF for a buying opportunity around 0.93 zone, once we will receive any bullish confirmation the trade will be executed.
Trade safe, Joe.

US30 ShortHey traders, in today's trading session we are monitoring US30 for a selling opportunity around 34900 zone, once we will receive any bearish confirmation the trade will be executed.
Trade safe, Joe.

GBPUSD ShortHey traders, in today's trading session we are monitoring GBPUSD for a selling opportunity around 1.327 zone, once we will receive any bearish confirmation the trade will be executed.
Trade safe, Joe.
EURUSD ShortHey traders, in today's trading session we are monitoring EURUSD for a selling opportunity around 1.10100 zone, once we will receive any bearish confirmation the trade will be executed.
Trade safe, Joe.

USDCAD shortHey traders, in today's trading session we are monitoring USDCAD for a selling opportunity around 1.26 zone, once we will receive any bearish confirmation the trade will be executed.
Trade safe, Joe.

USDJPY Is heading to 120 levels.Hey traders, in today's trading session we are monitoring USDJPY for a buying opportunity around 119 zone, once we will receive any bullish confirmation the trade will be executed.
Trade safe, Joe.

USA COVID-19 Spike as reported...... to spike in April!
Already media is openly speaking of that expectation. No surprises, will happen.
Data (MACD histogram) projections align.
Apparently, NY and FL are already spiking.
This is likely the Omicron wave, and it can get out of hand pretty quickly as we have seen in many other countries. Hope that enough preparations have been made!

GBPUSD ShortHey traders, in today's trading session we are monitoring GBPUSD for a selling opportunity around 1.32 zone, once we will receive any bearish confirmation the trade will be executed.
Trade safe, Joe.
