SBUX, Short, 1D✅ SBUX rejected the key resistance at 114.30, signaling a bearish reversal. The price is currently overbought and expected to move lower toward the target price.
SHORT 📉
✅ Like and subscribe to never miss a new analysis! ✅
USA

Trump's Golden RatioTrump has launched his own personal token that he will use solely for his own benefit for bribes and money laundering. He's not a politician, he's a businessman who knows how to make money. Creating his own cryptocurrencies is direct proof of that. The $TRUMP token plays a role as the president's personal token for the Republicans to donate to him and a legal way to get money from other politicians. The whole saga with his token is just beginning, it is one of the few steps in building the Trump family the greatest business ever.
As far as the chart is concerned, we should wait for a bounce into the golden section area. Now there was a FUD regarding the ByBit hack, it's like a fake attempt to panic the crowd, but it didn't work with smart people. Only the strongest are left here, who have survived everything they can.
Horban Brothers.

(ALGO) ALGORAND "gravestone doji"At the peak of price of Algorand the chart pattern formed a gravestone doji candle before depleting and falling into the reckoning wave of losses along with most other cryptourrency.

Dont fall for the panic sellThe price has settled at a really good level, around 0.7, after a panic sell. This is a really good sign. There is almost nothing to lose by waiting a bit longer for the European and U.S. exchanges to open.
See you soon, guys.

Ford seems to easy of a buyThoughts on the Ford recall vs price action
I'm personally watching as buying is heating up

(SOL) solana "big gulp"The price of Solana is looking like it is going to go into a big gulp phase with a potential for a bottom (buying zone) and a recovery (ramp up) out of the big gulp moment.

USD/JPY (1H)USDJPY: Strongly broke out the support level, which now becomes a resistance zone:
When the price returns to the red zone, sellers could push the price down again.

EURUSD - PoVThe EUR/USD exchange rate is influenced by several economic and political factors, suggesting that the euro may continue to weaken in the coming weeks. On one side, the United States is implementing expansive fiscal policies that could strengthen the dollar, such as economic stimulus and increased public spending. These factors, along with potential protectionist measures like tariffs on Europe, could further weaken the euro by reducing the competitiveness of European exports. Additionally, the **Federal Reserve's** monetary policy, which has raised interest rates to combat inflation, makes the dollar more attractive to investors, increasing demand for the U.S. currency. The United States' energy independence, due to increased domestic production of gas and oil, has also reduced its reliance on imports, which further strengthens the dollar compared to the euro.
On the other hand, the Eurozone is facing a series of economic and political challenges that are putting pressure on the single currency. High inflation is eroding purchasing power across the Eurozone, and despite the European Central Bank (ECB) raising interest rates to combat it, economic growth remains slow. This divergence from the United States, where growth has been more dynamic, amplifies the euro's weakness. Moreover, the ongoing energy crisis in Europe, worsened by the war in Ukraine and reduced gas supplies from Russia, has increased costs and slowed the competitiveness of European businesses. In this context, political uncertainties in some Eurozone countries and the ECB’s less aggressive economic management compared to the Fed further contribute to the euro's weakness.
Therefore, the strengthening of the dollar, driven by U.S. policies and growing energy independence, and the structural weakness of the Eurozone, are likely to continue pushing the EUR/USD lower in the coming weeks.

Trump-Putin Ukraine Deal: Impacts on Forex
Hello, I am Professional Trader Andrea Russo and today I want to talk to you about an important news that is shaking up the global markets: Donald Trump has apparently reached an agreement with Vladimir Putin to end the war in Ukraine, with an agreement that includes Ukraine's exit from NATO. The historic meeting between the two leaders will take place in Saudi Arabia and this move is expected to have a profound impact on the global geopolitical and financial landscape, especially on the Forex market.
Geopolitical and Economic Impact:
The announcement of a possible agreement between Trump and Putin could mark a significant turning point in the war in Ukraine. If Ukraine were to actually leave NATO, it would open a new phase of stability for the region, but at the same time it could create uncertainty on the geopolitical borders. This decision will directly affect the currency markets, in particular the currencies of the countries involved, the main European currencies and the US dollar.
In the current context, the war in Ukraine is one of the main causes of economic instability worldwide. Any end to hostilities could lead to a reduction in economic sanctions and a revival of trade flows between Russia, Europe and the United States. These changes will be closely monitored by traders, as any geopolitical fluctuations could affect the dynamics of currencies globally.
Implications for Forex:
A possible agreement between Trump and Putin could have a direct impact on Forex, especially on the following currencies:
Russian Ruble (RUB): A peace agreement would lead to a possible revaluation of the ruble. International sanctions against Russia could be gradually removed, boosting the Russian economy and supporting demand for the ruble in global markets.
Euro (EUR): Ukraine's exit from NATO could lead to greater stability for European countries involved in the conflict, but it could also reduce the risk associated with energy and military security. In the short term, the Euro could appreciate against riskier currencies, but the situation could vary depending on the political reactions in Europe.
US Dollar (USD): The dollar could react positively if the Trump-Putin deal is seen as a stabilization of international relations, but it will also depend on how the Federal Reserve responds to evolving economic conditions. A slowdown in the conflict could reduce the uncertainty that has pushed markets towards the dollar as a safe haven.
British Pound (GBP): The pound could benefit from a possible de-escalation of the crisis, but again, domestic political factors in the UK, such as its post-Brexit negotiations, will continue to influence the currency.
What to expect in the coming days:
News of the Trump-Putin meeting in Saudi Arabia will be watched closely by the markets. If the details of the deal are confirmed, we can expect an immediate reaction in the currency markets. Forex is likely to see increased volatility in the currency pairs tied to the nations involved, with shifts in capital flows that could reflect a new perception of risk or stability.
Conclusions:
In summary, the Trump-Putin deal could be a turning point in the war in Ukraine and have a significant impact on financial markets, especially Forex. Investors will need to carefully monitor geopolitical developments and prepare for possible currency fluctuations. With the end of hostilities, stability could return to favor some currencies, but the situation remains delicate and constantly evolving.

Bitcoin at a Crossroads: Breakout or Crash?Greetings to everyone, this is RONIN! 🔥
In this article, we will try to analyze the current trends in both the crypto market as a whole and specifically Bitcoin.
I believe you might have noticed a certain calming of movements within the price range of $100,000 to $94,000. Over the past few weeks, Bitcoin has been fluctuating within this range, gradually and slowly recovering 📈 but quickly returning to the price level 📉. Based on the chart, I can make a clear assumption that the market is in a local sideways range, which has locked our movements in anticipation of a further impulse and a breakout of the $103,000 level 🚀. However, we haven’t seen the price consolidate above this level.
📊 Level analysis shows that the market has attempted to break through the key support zone at $92,400 six times, but each time it approached this zone, massive buybacks occurred, pushing Bitcoin slightly upwards.
🤔 What is the market waiting for? Why isn't it surging to $120,000–$150,000 or dropping to $88,000?
The answer is simple: the market is currently driven by two emotions—fear and greed 😨🤑, as always, but now we have a very interesting situation that the crypto market has never been in before!
🧐 Let’s dive deeper into what’s happening here
We have the Trump effect 🇺🇸, which has awakened the American public and economy. More than 20 states are already planning to create Bitcoin reserves, and there are active discussions about establishing a national federal cryptocurrency reserve 🏦💰.
However, alongside this, we face the risk of economic instability and potential trade wars ⚔️ between the U.S. and China 🇺🇸🇨🇳 as well as the U.S. and Europe 🇺🇸🇪🇺.
❓ But why should trade wars concern us when we’re talking about cryptocurrency?
The answer is simple: these trade wars won’t directly impact crypto, but they will have an indirect effect.
📌 When the world is stable, investors are open to risk. They actively invest in cryptocurrencies, stocks, and ETFs 📈.
📌 When instability looms, they shift their capital into safe-haven assets 💰, such as gold 🏆, which has been breaking records over the past few months.
🔥 We’ve already witnessed how trade wars can indirectly influence the crypto market. For example, the recent Ethereum crash 🚨 from $3,200 to $2,100 overnight 😱—a 30% drop in market capitalization.
🔍 What’s actually happening?
💡 There are no specific negative news events for crypto, but there are technical liquidation imbalances.
Exchanges can manipulate liquidity 💹—for example, by selling or buying assets worth billions of dollars, forcing futures traders into liquidations 🚀💥.
That night alone, $8,000,000,000 was liquidated—setting a record for altcoin liquidations in a single day! 💣
🔑 What’s next?
Right now, there’s a strong fundamental trend:
✔️ Institutional investors are entering crypto 🏛️
✔️ The U.S., EU, and major countries are getting involved in cryptocurrency regulation and adoption 🌍
✔️ Futures ETFs and other financial instruments are making market entry easier 📊
But! 🤨
There are three "black swans" that could temporarily change the trend:
1️⃣ The U.S.-China Trade War ⚔️
– If tensions escalate, major players might use this for market manipulation 🎭
– I personally plan to hold through and buy assets at key support levels 🔄
2️⃣ Delays in the establishment of the federal Bitcoin reserve 🇺🇸🏦
– If there are delays and political disagreements, this could temporarily weaken investor interest ❄️
– However, this is only a matter of time, as the process is inevitable.
3️⃣ Geopolitical tensions 🕊️⚠️
– Conflicts in the Middle East, Europe, and other regions could create economic uncertainty.
– However, a swift resolution of the Russia-Ukraine war could be perceived positively by the market, boosting capital inflows into crypto 🚀
📈 Chart-Based Forecast
🔹 Key support level — $92,473 📍
🔹 If the price breaks below and consolidates for 2-3 daily candles, the market could enter a medium-term correction toward $80,000 – $72,000 😰
🔹 However, a bounce from $92,400 and a move toward $100,000 is a more likely scenario 🚀
At the moment, big players benefit from keeping the market in suspense, triggering stop-losses and liquidations for traders using leverage 💥.
📢 My conclusion: There is no fundamental reason for a major crash, but short-term manipulations are possible.
🔔 Follow me on TradingView! 📊
💡 Or check out my analytical resource, which will be fully operational soon! 💻🚀

COST, Short, 4h✅ COST is overbought and is pulling back to retest the key support at 1007.80 before determining its next move.
SHORT 🔥
✅ Like and subscribe to never miss a new analysis! ✅

BABA, Short, 4h✅ BABA is overbought and has rejected the key resistance at 115.45. A bearish move is expected as the price shows signs of weakness.
SHORT 🔥
✅ Like and subscribe to never miss a new analysis! ✅


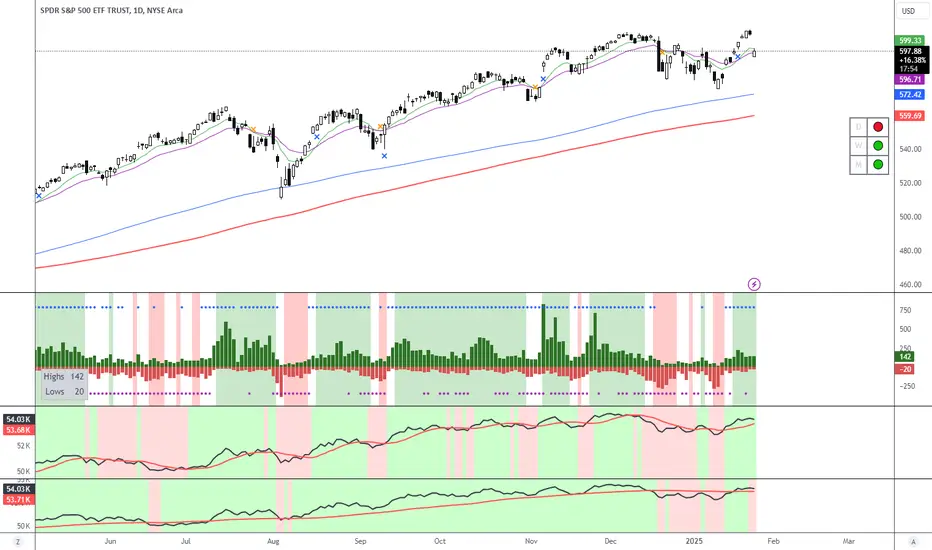
S&P 500 - exciting trading week aheadThe S&P remains in a range. On the last trading day of last week we saw a stronger sell-off, which formed a bearish engulfing. Today's opening will be decisive.
The last high and low pivots should be kept in mind.
The range is an expression of the current indecision. I will pay particular attention to individual stocks that have shown high relative strength in order to recognize early signals here.
A good trading week to all!

China-US Tariffs: Impact on Forex
Hello, I am professional trader Andrea Russo and today I want to talk to you about a hot topic that is shaking up global markets: the introduction of new tariffs by China towards the United States and the impact that this news is having on the Forex market.
A New Chapter in the US-China Trade War
For weeks, the investment world has been monitoring the evolution of tensions between two of the world's largest economies: the United States and China. After months of negotiations, China has decided to implement new tariffs on US products, intensifying the trade war that began a few years ago. The news had an immediate effect on global markets and, as always, Forex is one of the markets most sensitive to these geopolitical developments.
Direct Impact on USD Currency Pairs
The US dollar (USD) suffered a strong backlash after the announcement. In fact, the tariffs can reduce US exports to China, negatively affecting the US trade balance and fueling uncertainty among investors. The immediate result? A weakening of the dollar against several currencies.
The most affected currency pairs were:
EUR/USD: The euro gained ground, rising to levels not seen in weeks. Economic uncertainty resulting from tariffs has prompted investors to flee to currencies deemed safer, such as the euro.
GBP/USD: The British pound followed a similar trajectory, gaining against the dollar. Although Brexit remains a hot topic, the weakness of the dollar has given the British currency some respite.
USD/JPY: The Japanese yen, traditionally considered a safe haven, benefited from the uncertainty, appreciating against the dollar. A flow of capital into Japan was a direct result of the change in risk perception.
Effects on the Chinese RMB
The Chinese currency, the renminbi (RMB), has also fluctuated significantly. While China is trying to limit the effect of tariffs on its domestic market, the market response has been cautious. In particular, investors are preparing for a possible controlled devaluation of the renminbi, with the intention of maintaining the competitiveness of Chinese exports, which could suffer from higher tariffs.
The Role of Central Banks
Another factor that cannot be ignored in this context is the approach of central banks. The US Federal Reserve (Fed) could decide to review its monetary policies to counter the negative effects of tariffs on the dollar. We could see an easing of monetary policy or even a reduction in interest rates, unless the Fed wants to contain the rising inflation caused by tariffs.
On the other hand, the People’s Bank of China (PBoC) could be forced to take measures to support the Chinese economy. The possibility of a currency intervention could have significant effects not only on Forex, but also on other asset classes such as commodities and stock markets.
How to Capitalize on the Situation in Forex Trading
The developments surrounding the US-China trade war are a boon for Forex traders, provided they are able to carefully monitor the news and react quickly. Here are some strategies to consider:
Breakout Trades: The news of the tariffs has triggered significant movements, and experienced traders can look to enter breakout trades on the most volatile currency pairs. This involves looking to enter long or short positions when a currency pair breaks out of certain support or resistance levels.
Risk-Based Strategies: The uncertainties surrounding the trade war can force traders to be more selective in their trades. Careful risk management strategies, such as risk-reward ratios and stop-loss orders, are essential to navigate the turbulent waters.
Monitoring Central Bank Statements: Any signals from the Fed or the PBoC are crucial. Traders should be prepared to react quickly to any changes in monetary policies, as they can immediately impact the value of the currencies involved.
Final Thoughts
China’s decision to impose new tariffs on the United States marks a new phase in the trade war between the two economic powers. In an already volatile Forex market, this move adds further uncertainty, with the USD likely to face a period of weakness while other emerging currencies, such as the renminbi, could suffer mixed effects.
Happy trading to all.
Andrea Russo

The Tariff War: America, Mexico, Canada, and China
Dear readers, my name is Andrea Russo, and I am a trader. Today, I want to talk to you about a significant shift that is shaking global markets: the United States has decided to freeze tariffs on Mexico and Canada, while China has introduced counter-tariffs. This strategic move is likely to have significant repercussions on international trade and global economic dynamics, with direct effects on currencies and the Forex market.
Freezing Tariffs on Mexico and Canada: A Change in Strategy?
Under the Biden administration, the United States has decided to freeze tariffs on Mexico and Canada, two vital trading partners. This move may seem like a de-escalation in the trade war, but it is actually an attempt to strengthen ties with neighboring countries, thus facilitating trade flow and stimulating the internal economy. With rising commodity prices and the ongoing energy crisis, Washington aims to avoid escalating tariffs that could further aggravate an already fragile economic situation.
A Strategic Choice in an Unstable World
Despite the good intentions, the global context remains uncertain. The decision to suspend tariffs is partly motivated by the need to slow down inflation and mitigate the negative effects on global supply chains, especially in North America. However, this could also be a signal that the United States is focusing on internal challenges before shifting its focus to a larger battle — the one with China.
China’s Response: Counter-Tariffs and Retaliation
On the other side, China has not delayed in responding by imposing new tariffs on U.S. goods, particularly in key sectors such as technology, agriculture, and automotive. These tariffs are expected to have a direct impact on U.S. companies that export to China but may also influence global trade dynamics. China has clearly made a strategic move, one that goes beyond economic revenge: it's a signal that Beijing is not willing to make concessions on an issue that is critical for its geopolitical standing.
Impact on Financial Markets and Forex
Now that we've outlined the key strategic moves, let's take a look at how these developments will affect financial markets, especially the Forex market. The combination of the potential tariff freeze on Mexico and Canada and the tightening tariffs on China will undoubtedly affect currency dynamics, creating both opportunities and risks for traders.
1. Impact on the U.S. Dollar (USD)
The dollar may be influenced in contrasting ways by these developments. On the one hand, the tariff freeze on Mexico and Canada could be positive for the dollar, as it may favor a stronger North American economy, stimulating trade flows and reducing uncertainty. In particular, sectors such as automotive, energy, and agriculture may benefit from lower costs.
On the other hand, tensions with China could continue to create geopolitical uncertainties, which historically have led to greater volatility in the dollar. In the event of escalation, the effect could be an increase in demand for safe-haven assets like gold and the Japanese yen, leading to a temporary weakness in the dollar.
Forex Trading Strategy:
If the tariff freeze leads to economic stabilization in North America, the dollar could appreciate against riskier currencies such as the Mexican peso (MXN) and the Canadian dollar (CAD). However, traders should monitor China's reactions, as an escalation could lead to a more significant dollar rally.
2. Impact on the Mexican Peso (MXN) and Canadian Dollar (CAD)
The tariff freeze on Mexico and Canada will likely have a positive impact on both currencies. These countries will benefit from reduced costs on goods exported to the United States, which could stimulate economic growth and improve the trade balance.
However, the situation remains delicate. If China continues with new tariffs, Mexico and Canada could be indirectly affected, as overall global uncertainty could reduce trade and slow down growth. Nevertheless, both countries could continue to see appreciation in their currencies against emerging market or riskier currencies.
Forex Trading Strategy:
If the Mexican peso and Canadian dollar appreciate, traders might consider going long on these currencies against others like the Brazilian real (BRL) or South African rand (ZAR), which tend to be more volatile and vulnerable to global crises.
3. Impact on the Chinese Yuan (CNY) and Emerging Market Currencies
The escalation of the trade war between the U.S. and China will have a direct impact on the Chinese yuan. If more counter-tariffs are imposed, the yuan could weaken further, particularly against the dollar. This weakening could also increase volatility in emerging market currencies as capital might seek safety in assets like the dollar or Japanese yen.
Another potential effect will be the increase in commodity demand, particularly for metals and energy, which could benefit currencies linked to the export of raw materials, such as the Australian dollar (AUD) and the New Zealand dollar (NZD).
Forex Trading Strategy:
Traders expecting a weakening of the yuan could consider short positions on the CNY against the dollar or other major currencies. Additionally, monitoring commodity price trends will be crucial, as they could provide leading indicators for currencies tied to their export.
Conclusion: A New Chapter in the Tariff War with Forex Impacts
In summary, the tariff war between the United States, Mexico, Canada, and China is entering a new phase that will have long-lasting effects on financial markets, especially on Forex. Currency fluctuations will be influenced by a combination of trade policies, geopolitical uncertainties, and global economic dynamics. Investors and traders need to prepare for a period of high volatility, closely monitoring the moves of key players and their repercussions on the currency markets.
In this environment, adopting a flexible and diversified strategy is crucial, ready to adapt to rapid and unpredictable developments. Forex, as always, offers great opportunities but also significant risks. The key will be to read between the lines of global economic policies and act with timing.

The Stablecoin Revolution: Is the Dollar's Reign Over?
The Future of the Global Cryptocurrency Market: Navigating the Rise of Stablecoins and the Shifting Sands of Global Finance
The cryptocurrency market has exploded in popularity over the past decade, evolving from a niche interest to a global phenomenon. While Bitcoin remains the dominant player, the landscape is rapidly diversifying, with stablecoins like USDC and Tether playing an increasingly crucial role. This article explores the future of the global cryptocurrency market, examining the growing influence of stablecoins and their potential impact on the traditional financial system, particularly in relation to the US dollar and the DXY index.
The Rise of Stablecoins: Bridging the Gap Between Crypto and Fiat
Stablecoins are cryptocurrencies designed to maintain a stable value, typically pegged to a fiat currency like the US dollar. This stability makes them attractive for everyday transactions and as a safe haven within the volatile crypto market. USDC and Tether are the two largest stablecoins, with market capitalizations in the tens of billions of dollars.
The appeal of stablecoins lies in their ability to combine the benefits of cryptocurrencies – such as speed, low transaction costs, and 24/7 availability – with the stability of traditional currencies. This makes them ideal for a variety of use cases, including:
• Remittances: Sending money across borders using stablecoins can be faster and cheaper than traditional methods.
• Payments: Stablecoins can be used for everyday purchases, both online and in physical stores.
• Trading: Stablecoins provide a stable asset for traders to use when navigating the volatile cryptocurrency market.
• Decentralized Finance (DeFi): Stablecoins are a key component of DeFi protocols, where they are used for lending, borrowing, and trading.
The Impact on the US Dollar and the DXY Index
The growing adoption of stablecoins has raised questions about their potential impact on the US dollar and the DXY index, which measures the dollar's strength against a basket of other major currencies. Some analysts believe that the widespread use of stablecoins could weaken the dollar's dominance in global trade and finance.
However, it's important to note that most stablecoins are currently pegged to the US dollar. This means that their value is directly tied to the dollar's performance. As a result, the rise of stablecoins could actually strengthen the dollar's position in the short term.
In the long run, the impact of stablecoins on the dollar will depend on several factors, including:
• Regulation: Governments around the world are beginning to pay close attention to stablecoins. The regulatory frameworks that are developed will play a significant role in shaping the future of these digital assets.
• Adoption: The widespread adoption of stablecoins will be a key factor in determining their impact on the dollar. If stablecoins become a major force in global finance, they could challenge the dollar's dominance.
• Competition: The emergence of other stablecoins pegged to different currencies, or even central bank digital currencies (CBDCs), could reduce the reliance on dollar-pegged stablecoins.
Opportunities and Challenges in the Cryptocurrency Market
The future of the cryptocurrency market is full of opportunities and challenges. The continued growth of stablecoins is likely to play a significant role in shaping this future. Other key trends to watch include:
• Institutional adoption: More and more institutional investors are entering the cryptocurrency market. This is bringing increased legitimacy and liquidity to the market.
• Technological innovation: The cryptocurrency market is constantly evolving, with new technologies and applications being developed all the time. This innovation is driving the growth of the market.
• Regulatory clarity: As governments around the world develop clearer regulatory frameworks for cryptocurrencies, this will help to reduce uncertainty and encourage further adoption.
However, there are also challenges that the cryptocurrency market must overcome, including:
• Volatility: The cryptocurrency market remains highly volatile, which can make it risky for investors.
• Security: There have been a number of high-profile hacks and scams in the cryptocurrency market, which have raised concerns about security.
• Environmental concerns: The energy consumption of some cryptocurrencies, such as Bitcoin, has raised concerns about their environmental impact.
Conclusion
The future of the global cryptocurrency market is bright, with stablecoins playing an increasingly important role. While the impact on the US dollar and the DXY index remains to be seen, it's clear that stablecoins are changing the landscape of global finance. As the market continues to evolve, it will be important to keep an eye on the latest developments and to be aware of the opportunities and challenges that lie ahead.

Avax analysis and review: another rise or fall?hello guys
We came with Avax analysis.
This coin has been suffering for almost 35 days after its price drop, and now that the price is at the bottom of the trading range, it is expected that we will have an upward movement by maintaining the support range up to the ceiling of the trading range.
In case of failure, we will give you a new update.
*Trade safely with us*

(JASMY) jasmy - gray lineWhen the pivot line touches the price the price is moving into higher price targets according to the last few months. (gray line)

QQQ still in rangeQQQ continues to move in a range since the December high 2024.
In my opinion, today's sell-off is also no cause for concern.
Only in the event of a downward breakout can things become critical for individual stocks.
I continue to keep an eye out for strong individual stocks that show relative strength in order to recognize potential breakouts at an early stage. NASDAQ:QQQ

Nothing bad happendThe US markets fell sharply today. The S&P500 lost almost 2%. Many investors, especially on social media, are wondering whether the “Trump Rally” is now over. I think this is extremely unlikely. As is so often the case, markets tend to exaggerate, both upwards and downwards.
The price slide was triggered by news from China. Th AMEX:SPY ere, the start-up “DeepSeek” has announced that it has AI models that work just as well as their US counterparts at a much lower price and with less data.
This will certainly not have a lasting impact, but it should make us aware that the AI party will be over at some point.
EURUSD 26/01/2025EU this week giving us the bullish bias that we carried over from the Tuesday morning bias change. of course Orion told us as soon as the bias changed and we stayed on its tall the whole way to its current position. as it stands we are looking for longs into the target highs we have marked on our chart, but of course without a pullback we expect price to keep running and hit our targets . if we do carry the bullish move to our targets without hitting an entry low we will look for a new low to be created to then trade up into the highs once again. but our plan currently is the lows to be ran and the current targets remain in place giving us a strong target high to aim for.
Trade safe stick to your plan and always follow Orion!

Trump next big rally to $200+identified previous bull flags, and using fib retracement revealed new trump price to pump to $200+
etf for trump coin filed. with executive orders to reduce elations on crypto, etf may be approved at time when trump coins are unlocked in April. ETF approval means a ticker symbol for trump coin on the NYSE and nasdaq, and ETF issuers like black rock, fidelity, and grayscale will need to buy and hold a SIGNIFICANT amount of trump coins.
executive orders signed by trump will allow financial institutions to accept crypto payments. Another bullish event.
