2023.7.20 USD and US crudeoil rose and fell2023.7.20 USD and US crude oil rose and fell
Hello, I'm Older Duan. Today is Thursday, July 20th 2023.
Now it's 17pm Beijing time.
Let me give you a quick comment on the technical forms of the current international mainstream varieties!
First, what we see is the daily graph of the dollar index.
As shown in the figure, the U.S. Dollar Index rose yesterday and fell back today. It is still fighting for space around 100!
Now, let's look at gold.
Now you can see the daily chart of gold.
The figure superimposes the combination of gold's recent bottom-up golden section and Fibonacci parameter mean square!
As shown in the figure, gold showed a long downward trend yesterday and continued to break above the previous month's peak (1983.33 US dollars) today! Then, in the following time today, just use this position as an important point in the day for Bitwise operation! Above this position, bulls dominate; Below this position, bears dominate!
Let's take a look at American crude oil.
What you are now seeing is daily level candle chart of US crude oil. The graph superimposes the recent bottom-up golden section of US crude oil and the Fibonacci parameter mean square combination!
As shown in the picture, US crude oil rose and fell yesterday, with a long shadow on the daily line! Then, the opening price of yesterday (US $75.7) will be taken as the important Bitwise operation of the day later today! Above this point, bulls dominate; Below this point, bears dominate!
Let's look at EURUSD.
What you can see now is the daily chart of EURUSD.
The figure superimposes the combination of European and American currencies against the recent bottom of the golden section and Fibonacci parameter mean square!
As shown in the figure, the euro against the US dollar showed a long downward trend yesterday and a long upward trend the day before yesterday. This is a standard signal that a relatively high contraction triangle consolidation pattern is about to start! Then, in the future period of this day, we can take today's opening price (1.12042) as an important Bitwise operation of the day! Above this position, bulls dominate; Under this position, bears dominate!
Finally, let's take a look at GBPUSD.
Now you can see the daily chart of GBPUSD.
The figure superimposes the combination of the recent bottom of the GBPUSD against the golden section and the Fibonacci parameter mean square!
As shown in the figure, the pound almost hit the daily level of 21MA at its lowest point against the US dollar yesterday, and there is a high probability of a sideways consolidation between small areas today! Then in the future, we can use today's opening price (1.29363) as the Bitwise operation of the day! Above this position, bulls dominate; Under this position, bears dominate!
Well, the above is a quick inventory of the technical forms of the international mainstream varieties in today's European period!
Special reminder, Today is Thursday.The August futures of NYMEX New York crude oil were affected by the transfer of positions and months. The final trading on the market was completed at 2:30 am on July 21, and the final trading on the electronic disk was completed at 5:00 am. Please pay attention to the risk control announcement of the expiration of the trading venue for months. In addition, the expiration date of some trading platforms' American Oil contracts is usually one day earlier than the official date of NYMEX. Please pay more attention.
Im Older Duan. Wish you happy win . Goodbye!
Uscrudeoil

2023.7.19 USD has returned to 1002023.7.19 USD has returned to 100
Hello, I'm Older Duan. Today is Wednesday, July 19th 2023.
Now it's 17pm Beijing time.
Let me give you a quick comment on the technical forms of the current international mainstream varieties!
First, what we see is the daily graph of the dollar index.
As shown in the figure, the U.S. Dollar Index has returned to the top of the 100 integer level, but it is unlikely to rise directly in the short term!
Now, let's look at gold.
Now you can see the daily chart of gold.
The figure superimposes the combination of gold's recent bottom-up golden section and Fibonacci parameter mean square!
As shown in the figure, gold rose sharply yesterday, swallowing up the decline of the past two months. Today, it is at the start of short selling in June 2023 (around $1977) and also at the opening price on June 2, 2023, engaging in a long short competition! Then, in the following time today, we can take $1977 as the important Bitwise operation of the day! Above this position, bulls dominate; Below this position, bears dominate!
Let's take a look at American crude oil.
What you are now seeing is daily level candle chart of US crude oil. The graph superimposes the recent bottom-up golden section of US crude oil and the Fibonacci parameter mean square combination!
As shown in the figure, US crude oil surged yesterday, but both yesterday's and the day before yesterday's highs were suppressed by the opening price of May 1, 2023 ($76.00)! Then, in the following days today, we can take $76.00 as the important point of the day for Bitwise operation! Above this point, bulls dominate; Below this point, bears dominate!
Let's look at EURUSD.
What you can see now is the daily chart of EURUSD.
The figure superimposes the combination of European and American currencies against the recent bottom of the golden section and Fibonacci parameter mean square!
As shown in the figure, the euro rose and fell against the US dollar yesterday, forming a short-term top! Then, in the future, we can use today's opening price (1.12274) as the Bitwise operation of the day's important point! Above this position, bulls dominate; Under this position, bears dominate!
Finally, let's take a look at GBPUSD.
Now you can see the daily chart of GBPUSD.
The figure superimposes the combination of the recent bottom of the GBPUSD against the golden section and the Fibonacci parameter mean square!
As shown in the figure, the pound fell against the US dollar after yesterday's cheat line, and accelerated to break below today! In the subsequent period of this day, the opening price (1.29952) on July 13, 2023 will be taken as the important Bitwise operation of the day! Above this position, bulls dominate; Under this position, bears dominate!
Well, the above is a quick inventory of the technical forms of the international mainstream varieties in today's European period!
Special reminder, Today is Wednesday, and there is US crude oil inventory data tonight. Please be aware of the risks!
Im Older Duan. Wish you happy win . Goodbye!

2023.7.18 USD continues to weaken2023.7.18 USD continues to weaken
Hello, I'm Older Duan. Today is Tuesday, July 18th 2023.
Now it's 17pm Beijing time.
Let me give you a quick comment on the technical forms of the current international mainstream varieties!
First, what we see is the daily graph of the dollar index.
As shown in the figure, the daily closing line of the U.S. Dollar Index yesterday showed a small cross star, which is a standard turning signal!
Now, let's look at gold.
Now you can see the daily chart of gold.
The figure superimposes the combination of gold's recent bottom-up golden section and Fibonacci parameter mean square!
As shown in the figure, yesterday's low point of gold hit the daily long short divide of 55MA (1946 US dollars), and today it begins to break against the upper limit! Then, later today, just use $1960 as an important Bitwise operation in the day! Above this position, bulls dominate; Below this position, bears dominate!
Let's take a look at American crude oil.
What you are now seeing is daily level candle chart of US crude oil. The graph superimposes the recent bottom-up golden section of US crude oil and the Fibonacci parameter mean square combination!
As shown in the figure, the long shadow line of US crude oil yesterday was due to the influence of false news in the market, and US crude oil began to weaken today! Then, the opening price (74.11) of today will be taken as the Bitwise operation of the important point in the day later today! Above this point, bulls dominate; Below this point, bears dominate!
Let's look at EURUSD.
What you can see now is the daily chart of EURUSD.
The figure superimposes the combination of European and American currencies against the recent bottom of the golden section and Fibonacci parameter mean square!
As shown in the figure, the daily closing of the euro against the US dollar showed a long down shadow line and a small positive line yesterday. Today, it continues to break and rise sharply against the upper limit! Then in the subsequent period of this day, the 1.13000 integer pass will be taken as the important Bitwise operation of the day! Above this position, bulls dominate; Under this position, bears dominate!
Finally, let's take a look at GBPUSD.
Now you can see the daily chart of GBPUSD.
The figure superimposes the combination of the recent bottom of the GBPUSD against the golden section and the Fibonacci parameter mean square!
As shown in the figure, the pound against the US dollar has been suppressed for four consecutive trading days by the bottom up gold split's 2.382 level (around 1.31300)! Then this position will be used as the Bitwise operation operation of the important point in the day in the future! Above this position, bulls dominate; Under this position, bears dominate!
Well, the above is a quick inventory of the technical forms of the international mainstream varieties in today's European period!
Special reminder, Today is Tuesday, and tonight there is "horror data" on the monthly retail rate in the United States. Please be aware of the risks!
Im Older Duan. Wish you happy win . Goodbye!

2023.7.17 US crude Oil falls!2023.7.17 US crude Oil falls!
Hello, I'm Older Duan. Today is Monday, July 17th 2023.
Now it's 17pm Beijing time.
Let me give you a quick comment on the technical forms of the current international mainstream varieties!
First, what we see is the daily graph of the dollar index.
As shown in the figure, the U.S. Dollar Index has fought for long and short positions near the daily level 610MA in the last two trading days!
Now, let's look at gold.
Now you can see the daily chart of gold.
The figure superimposes the combination of gold's recent bottom-up golden section and Fibonacci parameter mean square!
As shown in the figure, gold has been trading at the daily level long short divide of 55MA ($1947) in the past two trading days, as well as the bottom up gold split of 2.000, which is also the highest point on February 2, 2023 ($1959.69), engaging in long short competition! Then, the following time today, just continue to use these two positions as the important points of the day Bitwise operation operation! Above these two positions, bulls dominate; Below these two positions, bears dominate!
Let's take a look at American crude oil.
What you are now seeing is daily level candle chart of US crude oil. The graph superimposes the recent bottom-up golden section of US crude oil and the Fibonacci parameter mean square combination!
As shown in the figure, the lowest point of US crude oil today hit the daily level of 144MA (74.21 US dollars)! Then, in the following time today, just use this position as an important point in the day for Bitwise operation! Above this point, bulls dominate; Below this point, bears dominate!
Let's look at EURUSD.
What you can see now is the daily chart of EURUSD.
The figure superimposes the combination of European and American currencies against the recent bottom of the golden section and Fibonacci parameter mean square!
As shown in the figure, the euro has shown a high sideways trend against the US dollar in the past two trading days, with a sluggish trend among bulls! Then, in the future period of this day, take today's opening price (1.12265) as the important Bitwise operation of the day! Above this position, bulls dominate; Under this position, bears dominate!
Finally, let's take a look at GBPUSD.
Now you can see the daily chart of GBPUSD.
The figure superimposes the combination of the recent bottom of the GBPUSD against the golden section and the Fibonacci parameter mean square!
As shown in the figure, the highest point of the pound against the US dollar last week was suppressed by strong pressure, which is the bottom of the gold split at 2.382 (around 1.31300)! Then this position will be used as the Bitwise operation operation of the important point in the day in the future! Above this position, bulls dominate; Under this position, bears dominate!
Well, the above is a quick inventory of the technical forms of the international mainstream varieties in today's European period!
Special reminder, Today is Monday, and tomorrow night there will be "horror data" on the monthly retail rate in the United States. Please pay attention to the risks!
Im Older Duan. Wish you happy win . Goodbye!

2023.7.14 USD has fallen below the 100 integer mark2023.7.14 USD has fallen below the 100 integer mark
Hello, I'm Older Duan. Today is Friday, July 14th 2023.
Now it's 17pm Beijing time.
Let me give you a quick comment on the technical forms of the current international mainstream varieties!
First, what we see is the daily graph of the dollar index.
As shown in the figure, the U.S. Dollar Index has fallen below the 100.00 integer level, coming near the daily level of 610MA!
Now, let's look at gold.
Now you can see the daily chart of gold.
The figure superimposes the combination of gold's recent bottom-up golden section and Fibonacci parameter mean square!
As shown in the figure, gold has been trading at the bottom against the 2.000 level of the gold split in the past two trading days, and it is also the highest point on February 2, 2023 ($1959.69), engaging in long short competition! Then, we can continue to use this position as an important Bitwise operation in the day later today! Above this position, bulls dominate; Below this position, bears dominate!
Let's take a look at American crude oil.
What you are now seeing is daily level candle chart of US crude oil. The graph superimposes the recent bottom-up golden section of US crude oil and the Fibonacci parameter mean square combination!
As shown in the figure, US crude oil yesterday broke through the bottom of the bullish 1.618 and daily level 233MA, and today's low hit the daily level 233MA ($76.35)! Then, in the following time today, just use this position as an important point in the day for Bitwise operation! Above this point, bulls dominate; Below this point, bears dominate!
Let's look at EURUSD.
What you can see now is the daily chart of EURUSD.
The figure superimposes the combination of European and American currencies against the recent bottom of the golden section and Fibonacci parameter mean square!
As shown in the figure, the euro rose sharply against the US dollar again yesterday, with the next strong pressure at 1.12800! Then, in the future, we can use today's opening price (1.12228) as the Bitwise operation of the day's important point! Above this position, bulls dominate; Under this position, bears dominate!
Finally, let's take a look at GBPUSD.
Now you can see the daily chart of GBPUSD.
The figure superimposes the combination of the recent bottom of the GBPUSD against the golden section and the Fibonacci parameter mean square!
As shown in the figure, the pound has reached a strong pressure level against the US dollar: the bottom is at 2.382 (around 1.31300) above the golden section! Then this position will be used as the Bitwise operation operation of the important point in the day in the future! Above this position, bulls dominate; Under this position, bears dominate!
Well, the above is a quick inventory of the technical forms of the international mainstream varieties in today's European period!
Special reminder, Today is Friday, and all important data for this week has been released. The weekly line will close tonight, and it is likely that there will be a pullback trend. Please pay attention to the risks!
Im Older Duan. Wish you happy win . Goodbye!

2023.7.13 USD is about to challenge the 100 integer gate2023.7.13 USD is about to challenge the 100 integer gate
Hello, I'm Older Duan. Today is Thursday, July 13th 2023.
Now it's 17pm Beijing time.
Let me give you a quick comment on the technical forms of the current international mainstream varieties!
First, what we see is the daily graph of the dollar index.
As shown in the figure, the U.S. Dollar Index has broken down continuously and has reached the 100.00 integer pass!
Now, let's look at gold.
Now you can see the daily chart of gold.
The figure superimposes the combination of gold's recent bottom-up golden section and Fibonacci parameter mean square!
As shown in the figure, gold broke through and rose sharply yesterday, reaching the 2.000 level of the bottom up gold split, and also above its highest point on February 2, 2023 ($1959.69)! Then, we can continue to use this position as an important Bitwise operation in the day later today! Above this position, bulls dominate; Below this position, bears dominate!
Let's take a look at American crude oil.
What you are now seeing is daily level candle chart of US crude oil. The graph superimposes the recent bottom-up golden section of US crude oil and the Fibonacci parameter mean square combination!
As shown in the figure, US crude oil has broken free from the constraints of daily levels of 144MA and 165MA, and is about to challenge the strong pressure level. The bottom of the daily level is above the gold sector's 1.618 level (around $76.35)! Then, in the following time today, just use this position as an important point in the day for Bitwise operation! Above this point, bulls dominate; Below this point, bears dominate!
Let's look at EURUSD.
What you can see now is the daily chart of EURUSD.
The figure superimposes the combination of European and American currencies against the recent bottom of the golden section and Fibonacci parameter mean square!
As shown in the figure, the euro rose sharply against the US dollar again yesterday, approaching its lowest point in November 2021 (1.11853)! Then this position will be used as the Bitwise operation operation of the important point in the day in the future! Above this position, bulls dominate; Under this position, bears dominate!
Finally, let's take a look at GBPUSD.
Now you can see the daily chart of GBPUSD.
The figure superimposes the combination of the recent bottom of the GBPUSD against the golden section and the Fibonacci parameter mean square!
As shown in the figure, the pound has reached the integer level of 1.3000 against the US dollar, and the next pressure level is 1.30666! Then this position will be used as the Bitwise operation operation of the important point in the day in the future! Above this position, bulls dominate; Under this position, bears dominate!
Well, the above is a quick inventory of the technical forms of the international mainstream varieties in today's European period!
Special reminder, Today is Thursday, and all important data for this week has been released. The weekly line will be closed tomorrow and Friday. Please be aware of the risks!
Im Older Duan. Wish you happy win . Goodbye!

2023.7.12 USD is about to reverse! The pound has surged!2023.7.12 USD is about to reverse! The pound has surged!
USD is about to reverse! The pound has surged, and US crude oil is pressing for positions!
Hello, I'm Older Duan. Today is Wednesday, July 12th 2023.
Now it's 17pm Beijing time.
Let me give you a quick comment on the technical forms of the current international mainstream varieties!
First, what we see is the daily graph of the dollar index.
As shown in the figure, the U.S. Dollar Index shows a continuous release of short momentum, with the strongest support at the opening price of 101.43 on May 11, 2023!
Now, let's look at gold.
Now you can see the daily chart of gold.
The figure superimposes the combination of gold's recent bottom-up golden section and Fibonacci parameter mean square!
As shown in the figure, gold has been suppressed by daily level 144MA (1939.21 US dollars) for two consecutive trading days! Then, we can continue to use this position as an important Bitwise operation in the day later today! Above this position, bulls dominate; Below this position, bears dominate!
Let's take a look at American crude oil.
What you are now seeing is daily level candle chart of US crude oil. The graph superimposes the recent bottom-up golden section of US crude oil and the Fibonacci parameter mean square combination!
As shown in the figure, US crude oil rose sharply yesterday and closed close to its highest point, with a high probability of rising and falling today! Then, in the following days today, the daily line level of 165MA ($74.85) will be taken as an important Bitwise operation in the day! Above this point, bulls dominate; Below this point, bears dominate!
Let's look at EURUSD.
What you can see now is the daily chart of EURUSD.
The figure superimposes the combination of European and American currencies against the recent bottom of the golden section and Fibonacci parameter mean square!
As shown in the figure, the euro has already broken through its highest point last month against the US dollar, and is also at the bottom against the gold split's 2.618 level (1.10115). The latest pressure level above is at the opening price of April 14, 2023 (1.10512)! Then in the future, these two positions can be used as the Bitwise operation of the important points in the day! Above these two positions, bulls dominate; Under these two positions, bears dominate; In between these two positions is the oscillating train of thought!
Finally, let's take a look at GBPUSD.
Now you can see the daily chart of GBPUSD.
The figure superimposes the combination of the recent bottom of the GBPUSD against the golden section and the Fibonacci parameter mean square!
As shown in the figure, the pound continues to break through against the US dollar and is about to hit its lowest point in April 2022 (1.29726)! Then this position will be used as the Bitwise operation operation of the important point in the day in the future! Above this position, bulls dominate; Under this position, bears dominate!
Well, the above is a quick inventory of the technical forms of the international mainstream varieties in today's European period!
Special reminder, today is Wednesday, and tonight there will be five star data CPI, four star data Canada interest rate resolution, and EIA. Please be aware of the risks!
Im Older Duan. Wish you happy win . Goodbye!

2023.7.11 GBPUSD accelerates its rise2023.7.11 GBPUSD accelerates its rise
USD continues to be weak, the pound accelerates its rise, and US crude oil fluctuates slightly!
Hello, I'm Older Duan. Today is Tuesday, July 11th 2023.
Now it's 17pm Beijing time.
Let me give you a quick comment on the technical forms of the current international mainstream varieties!
First, what we see is the daily graph of the dollar index.
As shown in the figure, the U.S. Dollar Index shows a continuous release of short momentum, with the strongest support at the opening price of 101.43 on May 11, 2023!
Now, let's look at gold.
Now you can see the daily chart of gold.
The figure superimposes the combination of gold's recent bottom-up golden section and Fibonacci parameter mean square!
As shown in the figure, gold reached its peak today at daily level 144MA (1939.21 US dollars)! Then, in the following time today, just use this position as an important point in the day for Bitwise operation! Above this position, bulls dominate; Below this position, bears dominate!
Let's take a look at American crude oil.
What you are now seeing is daily level candle chart of US crude oil. The graph superimposes the recent bottom-up golden section of US crude oil and the Fibonacci parameter mean square combination!
As shown in the figure, US crude oil competed between long and short positions at last month's bearish starting point, which was the opening price of June 5, 2023 ($73.41)! Then, in the following time today, just use this position as an important point in the day for Bitwise operation! Above this point, bulls dominate; Below this point, bears dominate!
Let's look at EURUSD.
What you can see now is the daily chart of EURUSD.
The figure superimposes the combination of European and American currencies against the recent bottom of the golden section and Fibonacci parameter mean square!
As shown in the figure, the euro has reached its highest point against the US dollar last month, and it is also at the bottom of the 2.618 level (1.10115) on the gold split! Then this position will be used as the Bitwise operation operation of the important point in the day in the future! Above this position, bulls dominate; Under this position, bears dominate!
Finally, let's take a look at GBPUSD.
Now you can see the daily chart of GBPUSD.
The figure superimposes the combination of the recent bottom of the GBPUSD against the golden section and the Fibonacci parameter mean square!
As shown in the figure, after the pound hit the daily level of 21MA against the US dollar yesterday, the daily closing line showed a long downward shadow and a small positive line. Today, it rose and fell back, which is the beginning signal of the standard high contraction triangle consolidation! Then in the future, we can take today's opening price (1.28633) as an important Bitwise operation in the day! Above this position, bulls dominate; Under this position, bears dominate!
Well, the above is a quick inventory of the technical forms of the international mainstream varieties in today's European period!
Special reminder, Today is Tuesday, and the impact of last Friday's big non agricultural data market has disappeared. The expected market trend of tomorrow's CPI data market has started to affect, please pay attention to the risks!
Im Older Duan. Wish you happy win . Goodbye!

2023.7.10 USD Index returned to its weakest range!2023.7.10 USD Index returned to its weakest range!US crude oil surged!
Hello, I'm Older Duan. Today is Monday, July 10th 2023.
Now it's 17pm Beijing time.
Let me give you a quick comment on the technical forms of the current international mainstream varieties!
First, what we see is the daily graph of the dollar index.
As shown in the figure, the U.S. Dollar Index fell sharply for two consecutive trading days, returning to the lower part of all moving averages at the daily level, and near 2.382 of the top to bottom golden section!
Now, let's look at gold.
Now you can see the daily chart of gold.
The figure superimposes the combination of gold's recent bottom-up golden section and Fibonacci parameter mean square!
As shown in the figure, gold peaked last Friday at its highest point this month, and today it is engaged in a long short competition near the daily levels of 21MA and 165MA! Then, the opening price of this month (US $1919.4) will continue to be used as the Bitwise operation of the day later today! Above this position, bulls dominate; Below this position, bears dominate!
Let's take a look at American crude oil.
What you are now seeing is daily level candle chart of US crude oil. The graph superimposes the recent bottom-up golden section of US crude oil and the Fibonacci parameter mean square combination!
As shown in the figure, US crude oil surged last Friday, reaching near the opening price of June 5, 2023 ($73.4), which is also a recent bearish starting point! Then, in the following time today, just use this position as an important point in the day for Bitwise operation! Above this point, bulls dominate; Below this point, bears dominate!
Let's look at EURUSD.
What you can see now is the daily chart of EURUSD.
The figure superimposes the combination of European and American currencies against the recent bottom of the golden section and Fibonacci parameter mean square!
As shown in the figure, the euro rose sharply against the US dollar last Friday, breaking through the opening price of June 28, 2023 (1.09565), which is also a recent short start position! Then this position will be used as the Bitwise operation operation of the important point in the day in the future! Above this position, bulls dominate; Under this position, bears dominate!
Finally, let's take a look at GBPUSD.
Now you can see the daily chart of GBPUSD.
The figure superimposes the combination of the recent bottom of the GBPUSD against the golden section and the Fibonacci parameter mean square!
As shown in the figure, the pound hit a recent high against the US dollar last Friday, but today it has retreated against the downside! In the subsequent period of this day, the short start position of the previous month and the opening price (1.28131) of June 19, 2023 can be used as the important Bitwise operation of the day! Above this position, bulls dominate; Under this position, bears dominate!
Well, the above is a quick inventory of the technical forms of the international mainstream varieties in today's European period!
Special reminder, Today is Monday, and the impact of last Friday's big non agricultural data market has gradually disappeared. The expected market trend of this Wednesday's CPI data market is starting to affect, please pay attention to the risks!
Im Older Duan. Wish you happy win . Goodbye!

2023.7.6 The upper space of U.S. Dollar Index is opening!2023.7.6 The upper space of U.S. Dollar Index is opening!
The upward space of USD has opened up, silver is stronger than gold, and US crude oil is steadily rising!
Hello, I'm Older Duan. Today is Thursday, July 6th 2023.
Now it's 17pm Beijing time.
Let me give you a quick comment on the technical forms of the current international mainstream varieties!
First, what we see is the daily graph of the dollar index.
As shown in the figure, today's opening price of the U.S. Dollar Index has reached the daily level of 165MA, and the upper space is in the process of opening!
Now, let's look at gold.
Now you can see the daily chart of gold.
The figure superimposes the combination of gold's recent bottom-up golden section and Fibonacci parameter mean square!
As shown in the figure, after breaking through the daily level of 21MA yesterday, gold fell back and broke through multiple small support levels! Then, in the following days today, we can take today's opening price (1916.8 dollars) as the Bitwise operation of the day! Above this position, bulls dominate; Below this position, bears dominate!
Let's take a look at American crude oil.
What you are now seeing is daily level candle chart of US crude oil. The graph superimposes the recent bottom-up golden section of US crude oil and the Fibonacci parameter mean square combination!
As shown in the figure, both yesterday's daily closing price and today's opening price of US crude oil have reached above the recent bottom of 1.000 (71.68 US dollars) above the gold split! Then, in the following time today, just use this position as an important point in the day for Bitwise operation! Above this point, bulls dominate; Below this point, bears dominate!
Let's look at EURUSD.
What you can see now is the daily chart of EURUSD.
The figure superimposes the combination of European and American currencies against the recent bottom of the golden section and Fibonacci parameter mean square!
As shown in the figure, the euro/US dollar is currently engaged in a long short battle near the key daily level position of 55MA (1.08487)! Then this position will be used as the Bitwise operation operation of the important point in the day in the future! Above this position, bulls dominate; Under this position, bears dominate!
Finally, let's take a look at GBPUSD.
Now you can see the daily chart of GBPUSD.
The figure superimposes the combination of the recent bottom of the GBPUSD against the golden section and the Fibonacci parameter mean square!
As shown in the figure, the GBP/USD has been engaged in a long short competition near the daily level of 21MA (1.26996) in recent trading days! Then this position will be used as the Bitwise operation operation of the important point in the day in the future! Above this position, bulls dominate; Under this position, bears dominate!
Well, the above is a quick inventory of the technical forms of the international mainstream varieties in today's European period!
Special reminder, today is July 6th (Thursday). Due to this Tuesday being Independence Day (a legal holiday in the United States), the US market is closed! There are three Data markets tonight: ADP, Unemployment Claims and EIA! Please pay attention to the risks!
Im Older Duan. Wish you happy win . Goodbye!

2023.7.5 Daily European Perspective2023.7.5 Daily European Perspective
USD is slowly strengthening, EURUSD is weak, and US crude oil bulls are weak!
Hello, I'm Older Duan. Today is Wednesday, July 5th 2023.
Now it's 17pm Beijing time.
Let me give you a quick comment on the technical forms of the current international mainstream varieties!
First, what we see is the daily graph of the dollar index.
As shown in the figure, the U.S. Dollar Index has risen steadily in the last three trading days, and today it has reached the daily level of 144MA!
Now, let's look at gold.
Now you can see the daily chart of gold.
The figure superimposes the combination of gold's recent bottom-up golden section and Fibonacci parameter mean square!
As shown in the figure, gold has been vying for long and short positions at the daily level of 165MA (around $1928.4) in the past three trading days! Then, in the following time today, just use this position as an important point in the day for Bitwise operation! Above this position, bulls dominate; Below this position, bears dominate!
Let's take a look at American crude oil.
What you are now seeing is daily level candle chart of US crude oil. The graph superimposes the recent bottom-up golden section of US crude oil and the Fibonacci parameter mean square combination!
As shown in the figure, US crude oil has arrived at a key daily level location near 55MA (around $71) today! Then, in the following time today, just use this position as an important point in the day for Bitwise operation! Above this point, bulls dominate; Below this point, bears dominate!
Let's look at EURUSD.
What you can see now is the daily chart of EURUSD.
The figure superimposes the combination of European and American currencies against the recent bottom of the golden section and Fibonacci parameter mean square!
As shown in the figure, the euro fell against the US dollar yesterday, and today it is at the bottom of the daily level, up against the 2.382 position (1.08735) of the gold split! Then, in the future, we can use today's opening price (1.09121) as the Bitwise operation of the day's important point! Above this position, bulls dominate; Under this position, bears dominate!
Finally, let's take a look at GBPUSD.
Now you can see the daily chart of GBPUSD.
The figure superimposes the combination of the recent bottom of the GBPUSD against the golden section and the Fibonacci parameter mean square!
As shown in the figure, the pound has shown a steady upward trend against the US dollar in the past three trading days! Then in the future, we can use today's opening price (1.27171) as the Bitwise operation of the day! Above this position, bulls dominate; Under this position, bears dominate!
Well, the above is a quick inventory of the technical forms of the international mainstream varieties in today's European period!
Special reminder, today is July 5th (Wednesday). Due to yesterday being Independence Day (a legal holiday in the United States), the US market was closed! The important data for this week (EIA, ADP, initial application, and non agricultural) are all concentrated on Thursday and Friday of this week! Please pay attention to the risks!
Im Older Duan. Wish you happy win . Goodbye!

2023.7.4 silver is stronger than gold2023.7.4 silver is stronger than gold
USDX rose and fell, silver is stronger than gold, and US crude oil rose and fell!
Hello, I'm Older Duan. Today is Tuesday, July 4th 2023.
Now it's 16pm Beijing time.
Let me give you a quick comment on the technical forms of the current international mainstream varieties!
First, what we see is the daily graph of the dollar index.
As shown in the figure, the U.S. Dollar Index broke through the daily level 144MA and 21MA yesterday, and stepped on the daily level 55MA next time!
Now, let's look at gold.
Now you can see the daily chart of gold.
The figure superimposes the combination of gold's recent bottom-up golden section and Fibonacci parameter mean square!
As shown in the figure, the gold daily closing line showed a long up and down shadow line yesterday, which is the standard change signal! Then, in the future, we can continue to use today's opening price ($1921.17) as the Bitwise operation of the day! Above this position, bulls dominate; Below this position, bears dominate!
Let's take a look at American crude oil.
What you are now seeing is daily level candle chart of US crude oil. The graph superimposes the recent bottom-up golden section of US crude oil and the Fibonacci parameter mean square combination!
As shown in the figure, the highest point of US crude oil yesterday was precisely suppressed by the 1.000 position of the golden section above the bottom in the figure! Then, in the future, we will continue to use the integer pass of $70 as the important Bitwise operation operation in the day! Above this point, bulls dominate; Below this point, bears dominate!
Let's look at EURUSD.
What you can see now is the daily chart of EURUSD.
The figure superimposes the combination of European and American currencies against the recent bottom of the golden section and Fibonacci parameter mean square!
As shown in the figure, the daily closing of the euro against the US dollar yesterday showed a cross star with a long up shadow and a long down shadow, which is the standard trading signal! Then, in the future, we can use today's opening price (1.09121) as the Bitwise operation of the day's important point! Above this position, bulls dominate; Under this position, bears dominate!
Finally, let's take a look at GBPUSD.
Now you can see the daily chart of GBPUSD.
The figure superimposes the combination of the recent bottom of the GBPUSD against the golden section and the Fibonacci parameter mean square!
As shown in the figure, the daily closing of the pound against the US dollar yesterday showed a cross star, which is the standard trading signal! In the future, we will continue to use the 2.000 digits (around 1.26800) of the golden section from the bottom to the top as the important Bitwise operation of the day! Above this position, bulls dominate; Under this position, bears dominate!
Well, the above is a quick inventory of the technical forms of the international mainstream varieties in today's European period!
Special reminder, today is July 4th (Tuesday), Independence Day (a legal holiday in the United States), and the US market is closed today! The important data for this week (EIA, ADP, initial application, and non agricultural) are all concentrated on Thursday and Friday of this week! Please pay attention to the risks!
Im Older Duan. Wish you happy win . Goodbye!

2023.7.3 USOUSD has slightly strengthened !2023.7.3 USOUSD has slightly strengthened !
USD has slightly declined, non US currencies and precious metals have experienced weak volatility, while US crude oil has slightly strengthened !
Hello, I'm Older Duan. Today is Monday, July 3rd 2023.
Now it's 16pm Beijing time.
Let me give you a quick comment on the technical forms of the current international mainstream varieties!
First, what we see is the daily graph of the dollar index.
As shown in the figure, the U.S. Dollar Index peaked last Thursday and Friday at a daily level of 165MA, and then fell back down to near the daily levels of 21MA and 144MA!
Now, let's look at gold.
Now you can see the daily chart of gold.
The figure superimposes the combination of gold's recent bottom-up golden section and Fibonacci parameter mean square!
As shown in the figure, gold will hit the bottom against the 1.618 level of the gold split last Thursday (around $1890), and then rise sharply against the daily level of 165MA (around $1927) on Friday! Then, in the future, we will continue to use the daily line level of 165MA (around 1927 dollars) as the important Bitwise operation in the day! Above this position, bulls dominate; Below this position, bears dominate!
Let's take a look at American crude oil.
What you are now seeing is daily level candle chart of US crude oil. The graph superimposes the recent bottom-up golden section of US crude oil and the Fibonacci parameter mean square combination!
As shown in the figure, the daily pattern of US crude oil for three consecutive trading days last Wednesday, Thursday, and Friday showed a bullish and constantly accumulating strength, ready to exert upward force at any time! So, for the rest of today, just continue to use the $70 integer level as an important intraday point! Above this point, bulls dominate; Below this point, bears dominate!
Let's look at EURUSD.
What you can see now is the daily chart of EURUSD.
The figure superimposes the combination of European and American currencies against the recent bottom of the golden section and Fibonacci parameter mean square!
As shown in the figure, the euro against the US dollar has been engaged in a long short battle in the past three trading days, at the bottom of the gold split at 2.382 and near the daily level of 21MA! So in the subsequent period of this day, the bottom to top golden section of 2.382 bits (1.08870) will be taken as the important Bitwise operation of the day! Above this position, bulls dominate; Under this position, bears dominate!
Finally, let's take a look at GBPUSD.
Now you can see the daily chart of GBPUSD.
The figure superimposes the combination of the recent bottom of the GBPUSD against the golden section and the Fibonacci parameter mean square!
As shown in the figure, the pound US currency almost compensated for the decline of last Thursday and Wednesday against last Friday, returning to the daily level of 21MA and the bottom of the gold split at 2.000 (around 1.26800)! In the future, the 2.000 bit (around 1.26800) of the golden section from the bottom to the top will be taken as the Bitwise operation of the important point in the day! Above this position, bulls dominate; Under this position, bears dominate!
Well, the above is a quick inventory of the technical forms of the international mainstream varieties in today's European period!
Special reminder, Today is Monday, and as tomorrow is Independence Day (a legal holiday in the United States), the US market closed early today; The US market is closed tomorrow! The important data for this week (EIA, ADP, USD Unemployment Claims, and Non-Farm Employment Change) are all concentrated on Thursday and Friday of this week! Please pay attention to the risks!
Im Older Duan. Wish you happy win . Goodbye!

2023.6.29 Daily European Perspective 2023.6.29 Daily European Perspective
Gold is clearly accelerating its decline and is about to test the integer level of $1900!
Hello, I'm Older Duan. Today is Thursday, June 29 2023.
Now it's 16pm Beijing time.
Let me give you a quick comment on the technical forms of the current international mainstream varieties!
First, what we see is the daily graph of the dollar index.
As shown in the figure, the U.S. Dollar Index broke above the daily line of 55MA yesterday and hit 21MA and 144MA!
Now, let's look at gold.
Now you can see the daily chart of gold.
The figure superimposes the combination of gold's recent bottom-up golden section and Fibonacci parameter mean square!
As shown in the figure, gold is clearly accelerating its decline and is about to test the integer level of $1900! Then, in the following days today, we can use the integer gate of 1900 dollars as the important Bitwise operation of the day! Above this position, bulls dominate; Below this position, bears dominate!
Let's take a look at American crude oil.
What you are now seeing is daily level candle chart of US crude oil. The graph superimposes the recent bottom-up golden section of US crude oil and the Fibonacci parameter mean square combination!
As shown in the figure, US crude oil recovered its previous day's decline yesterday, but is still below the integer level of $70! Then, in the following time today, we can take the integer pass of $70 as the important Bitwise operation operation in the day! Above this point, bulls dominate; Below this point, bears dominate!
Let's look at EURUSD.
What you can see now is the daily chart of EURUSD.
The figure superimposes the combination of European and American currencies against the recent bottom of the golden section and Fibonacci parameter mean square!
As shown in the figure, yesterday's decline of the euro against the US dollar gave up the previous day's gains, and today's lowest point hit the daily bottom of the gold split at 2.382! Then, in the future period of this day, take today's opening price (1.09144) as the important Bitwise operation of the day! Above this position, bulls dominate; Under this position, bears dominate!
Finally, let's take a look at GBPUSD.
Now you can see the daily chart of GBPUSD.
The figure superimposes the combination of the recent bottom of the GBPUSD against the golden section and the Fibonacci parameter mean square!
As shown in the figure, the pound US currency fell below the daily limit yesterday, reaching below the 2.000 level of the gold split at the bottom of the daily level, and broke through the daily level of 21MA! Then in the future, the daily line level of 21MA (1.26510) will be taken as the Bitwise operation of the important point in the day! Above this position, bulls dominate; Under this position, bears dominate!
Well, the above is a quick inventory of the technical forms of the international mainstream varieties in today's European period!
Special reminder,Today is Thursday, as this week is the last trading week of June, the monthly line for this month will be closed by the end of this week! Please pay attention to the risks!
Im Older Duan. Wish you happy win . Goodbye!

2023.6.28 Daily European Perspective GBPUSD is about to rise 2023.6.28 Daily European Perspective
GBPUSD is about to rise sharply !
USD is weak, GBPUSD is about to rise sharply, and US crude oil continues to be weak!
Hello, I'm Older Duan. Today is Wednesday, June 28 2023.
Now it's 16pm Beijing time.
Let me give you a quick comment on the technical forms of the current international mainstream varieties!
First, what we see is the daily graph of the dollar index.
As shown in the figure, the U.S. Dollar Index continues to consolidate its weakness near the daily level 55MA and above 2.382 of the top to bottom golden section!
Now, let's look at gold.
Now you can see the daily chart of gold.
The figure superimposes the combination of gold's recent bottom-up golden section and Fibonacci parameter mean square!
As shown in the figure, gold is about to break below its lowest point in recent trading days ($1910) and challenge the bullish starting point on March 15, 2023 ($1904)! Then, the following time today, just use these two positions as the important points in the day Bitwise operation! Above these two positions, bulls dominate; Below these two positions, bears dominate!
Let's take a look at American crude oil.
What you are now seeing is daily level candle chart of US crude oil. The graph superimposes the recent bottom-up golden section of US crude oil and the Fibonacci parameter mean square combination!
As shown in the figure, US crude oil weakened again yesterday, but there was still no significant downward break! Then, in the following time today, we can take today's opening price ($68.03) as the important Bitwise operation of the day! Above this point, bulls dominate; Below this point, bears dominate!
Let's look at EURUSD.
What you can see now is the daily chart of EURUSD.
The figure superimposes the combination of European and American currencies against the recent bottom of the golden section and Fibonacci parameter mean square!
As shown in the figure, the euro against the US dollar, as previously predicted, has started a contractionary consolidation below last Thursday's opening price and above last Friday's low point! Then in the subsequent period of this day, the opening price (1.09549) of the previous Friday can be used as the Bitwise operation of the important point in the day! Above this position, bulls dominate; Under this position, bears dominate!
Finally, let's take a look at GBPUSD.
Now you can see the daily chart of GBPUSD.
The figure superimposes the combination of the recent bottom of the GBPUSD against the golden section and the Fibonacci parameter mean square!
As shown in the figure, the pound US currency has shown a slow and steady upward trend in recent trading days, and may pull up the positive line at any time! Then in the subsequent period of this day, the opening price (1.27459) of the previous Friday can be used as the Bitwise operation of the important point in the day! Above this position, bulls dominate; Under this position, bears dominate!
Well, the above is a quick inventory of the technical forms of the international mainstream varieties in today's European period!
Special reminder,Today is Wednesday, with Federal Reserve Chairman Powell giving a speech and EIA data in the evening. As this week is the last trading week of June, the monthly line for this month will close this weekend! Please pay attention to the risks!
Im Older Duan. Wish you happy win . Goodbye!

US CRUDE OIL IS DOWN!Let's get to the us crude oil chart analysis.
Due to the explained structure, a special down is expected soon.

USOIL short updateThe USCrude/ USOIL is about to Hit our first TP on our pullback on the Monthly timeframe. As predicted, it is completing a double bottom thus the pullback to retest our neckline. Hopes of buying the USOIL right now on a swing trade is ambitious, we recommend that you exercise patience andenter at the neckline. For now that's where were headed.
Please share your thoughts.
Disclaimer
NASDAQ Guru offers general trading signals that does not take into consideration your own trading experiences, personal objectives and goals, financial means, or risk tolerance.

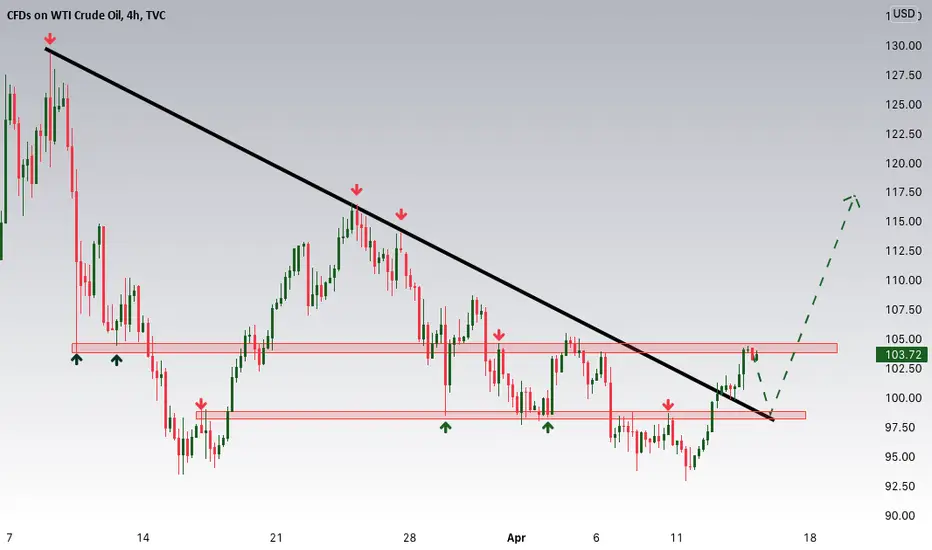
A PROBABLE SCENARIO ON USOIL !!!The chart illustrates that the price is moving up in a kind of expanding channel. So, the bottom can be recorded on the 86.40$ then see another up to the highlighted red zone.

Oil buyers step in at $72/bbl: Is the downside limited?The oil market has seen a lot of activity, with recent developments mostly easing worries about market tightness.
In China, Covid-related restrictions have been reinstalled in major cities, triggering rare protests and consequently reducing outlook for oil consumption, in striking contrast to perceived moves to reopen the economy at the beginning of November.
On the supply side, reports that the United States granted Chevron Corp permission to restart oil production in Venezuela, as well as Iraq's statement that it will add 1 million to 1.5 million barrels per day of oil export capacity by 2025, weighed on oil prices.
The oil future curve is no longer in a backwardation state. The price premium that spot WTI held over its future contracts ( 3A1! ; 4A1! ; 5A1! ) has been fully wiped away by the most recent leg of oil depreciation. In essence, the spot price of oil is currently trading at par compared to its 6-month future delivery, indicating that the market is not currently concerned about prompt supply.
This condition has not been observed since January 2021, and it may be prudent to be wary of surprises at this time.
Bad news is priced, but positive catalysts are still to come?
With most bad news already priced in by the market, it may take something new to stop oil prices from falling. In October, the US White House signalled that it intends to repurchase crude to replenish its SPR stocks when WTI prices are at or below about $65/bbl and $72/bbl. Consequently, this area could present a strong price support and thus limit the downside relative to current market prices.
Additionally, supply-side risks have not completely disappeared. The G7 has postponed a price ceiling on Russian oil, but Russia said that it may retaliate, restricting supply, if the G7 applies a price cap. In view of recent market developments, OPEC+ could also reinforce its very restrictive supply strategy on Sunday, December 4th.
Dip buying to resume at $72?
Technically speaking, oil has revised its lows for 2022 and is currently experiencing a negative year-to-date performance.
The most recent wave of decline was dramatic, bringing the daily RSI close to oversold territory. In the past, massive selloffs in oil prices, with the daily RSI in oversold territory, produced some near-term price recovery. WTI prices are currently 14% and 30% below their respective 50-day and 200-day moving averages, which appears overly pessimistic considering the persistence of upside risks.
Given how sharp the recent downward trend was and the fact that a positive catalyst might happen soon, dip buying may start to come back at these levels.

USOIL AnalysisHey traders, in this week we are monitoring USOIL for a buying opportunity around 99 zone, once we will receive any bullish confirmation the trade will be executed.
Trade safe, Joe.
Usoil longUS crude is on an uptrend, and you can trade for a higher target after the price breaks and pullback.

Technical analysis update: WTI oil (11th October 2021)USOIL reached our short-term price target of 80 USD. Because of that we would like to update our idea. We would like to change medium-term price target of 82 USD to short-term price target. In addition to that we would like to set new medium-term price target to 85 USD. Our long-term price target of 90 USD remains unchanged. We continue to be bullish on WTI oil and we expect price to continue its climb.
Technical analysis
MACD is bullish. Stochastic is also bullish. RSI is bullish, however, it reached overbought condition again. We previously noted that such phenomenon is often followed by correction in price (we noted that before slump towards 75 USD occured). ADX continues to grow which suggests that trend is strenghtening. We continue to be bullish but we would like to see price stabilize at current level first. It is possible that USOIL will move in certain range for while before continuing higher.
Support and resistance
Short-term support appears at 79.76 USD. Another two supports below that sit at 76.95 USD and at 74.21 respectively. Next strong support sits around 65 USD while major support lies at 61.58 USD. Current short-term resistance sits around 82.50 USD. Another resistance level appears at 85 USD.
Here is link to our previous thought from 7th October 2021:
Disclaimer: This analysis is not intended to encourage any buying or selling of any particular securities. Furthermore, it should not serve as basis for taking any trade action by individual investor. Your own due dilligence is highly advised before entering trade.

