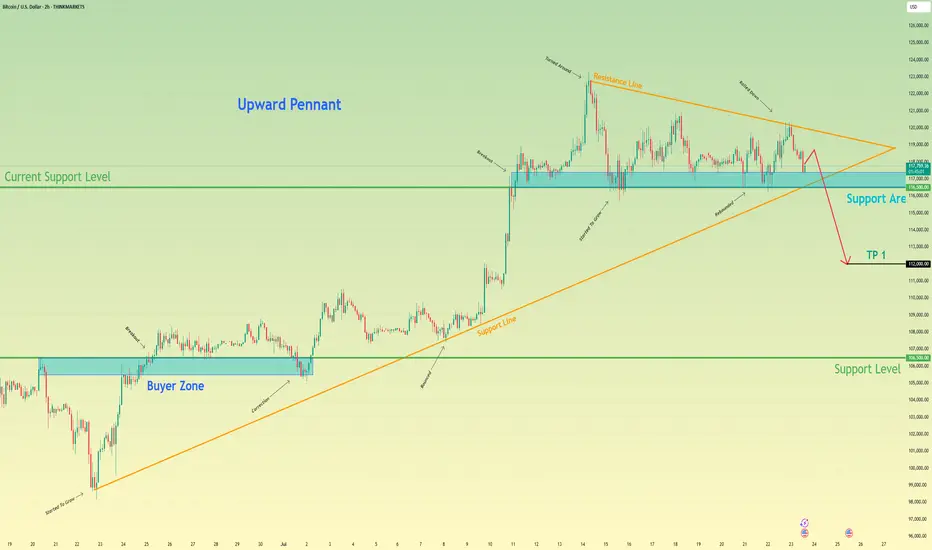
Bitcoin can start to decline and break support levelHello traders, I want share with you my opinion about Bitcoin. After completing a powerful upward impulse that originated from the buyer zone near 106500, the price action for BTC has transitioned into a corrective market phase. This consolidation has taken the form of an upward pennant, characterised by a narrowing trading range that suggests a significant directional move is forthcoming. Currently, the asset is undergoing a sequence of downward corrections within the pennant, exerting repeated pressure on the critical demand zone between 116500 and 117400. The importance of this zone is amplified by its confluence with the lower trend line of the formation itself. The primary working hypothesis is a bearish resolution, anticipating that persistent selling pressure will culminate in a decisive breakdown of this support. This event would act as a bearish breakout from the pennant, providing strong confirmation for the continuation of the downward impulsive momentum and shifting the local market structure. Therefore, the take-profit level is logically positioned at the 112000 mark. Please share this idea with your friends and click Boost 🚀
Disclaimer: As part of ThinkMarkets’ Influencer Program, I am sponsored to share and publish their charts in my analysis.
USD
USD/CHF - Bearish Flag (24.07.2025)Fundamental Updates :
Dollar falls - New Trade agreement and uncertainties in Market :
President Donald Trump announced a trade deal on Tuesday with Japan, which lowers tariffs on auto imports to 15% in exchange for a $550 billion package of U.S.-bound investment and loans.
The USD/CHF Pair on the M30 timeframe presents a Potential Selling Opportunity due to a recent Formation of a Bearish Flag Pattern. This suggests a shift in momentum towards the downside in the coming hours.
Possible Short Trade:
Entry: Consider Entering A Short Position around Trendline Of The Pattern.
Target Levels:
1st Support – 0.7878
2nd Support – 0.7855
🎁 Please hit the like button and
🎁 Leave a comment to support for My Post !
Your likes and comments are incredibly motivating and will encourage me to share more analysis with you.
Best Regards, KABHI_TA_TRADING
Thank you.
Disclosure: I am part of Trade Nation's Influencer program and receive a monthly fee for using their TradingView charts in my analysis.

USD/CHF - Bearish Flag (24.07.2025)The USD/CHF Pair on the M30 timeframe presents a Potential Selling Opportunity due to a recent Formation of a Bearish Flag Pattern. This suggests a shift in momentum towards the downside in the coming hours.
Possible Short Trade:
Entry: Consider Entering A Short Position around Trendline Of The Pattern.
Target Levels:
1st Support – 0.7878
2nd Support – 0.7855
🎁 Please hit the like button and
🎁 Leave a comment to support for My Post !
Your likes and comments are incredibly motivating and will encourage me to share more analysis with you.
Best Regards, KABHI_TA_TRADING
Thank you.
Disclosure: I am part of Trade Nation's Influencer program and receive a monthly fee for using their TradingView charts in my analysis.

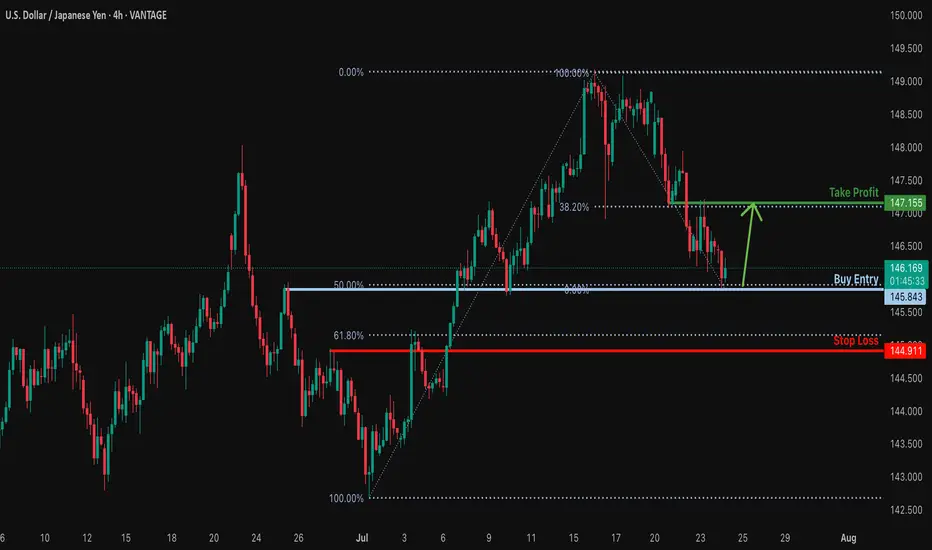
Bullish reversal?USD/JPY is falling towards the support level, which is an overlap support that aligns with the 50% Fibonacci retracement and could bounce from this level to our take profit.
Entry: 145.84
Why we like it:
There is an overlap support that aligns with the 50% Fibonacci retracement.
Stop loss: 144.91
Why we like it:
There is a pullback support that is slightly below the 61.8% Fibonacci retracement.
Take profit: 147.15
Why we like it:
There is an overlap resistance that lines up with the 38.2% Fibonacci retracement.
Enjoying your TradingView experience? Review us!
Please be advised that the information presented on TradingView is provided to Vantage (‘Vantage Global Limited’, ‘we’) by a third-party provider (‘Everest Fortune Group’). Please be reminded that you are solely responsible for the trading decisions on your account. There is a very high degree of risk involved in trading. Any information and/or content is intended entirely for research, educational and informational purposes only and does not constitute investment or consultation advice or investment strategy. The information is not tailored to the investment needs of any specific person and therefore does not involve a consideration of any of the investment objectives, financial situation or needs of any viewer that may receive it. Kindly also note that past performance is not a reliable indicator of future results. Actual results may differ materially from those anticipated in forward-looking or past performance statements. We assume no liability as to the accuracy or completeness of any of the information and/or content provided herein and the Company cannot be held responsible for any omission, mistake nor for any loss or damage including without limitation to any loss of profit which may arise from reliance on any information supplied by Everest Fortune Group.
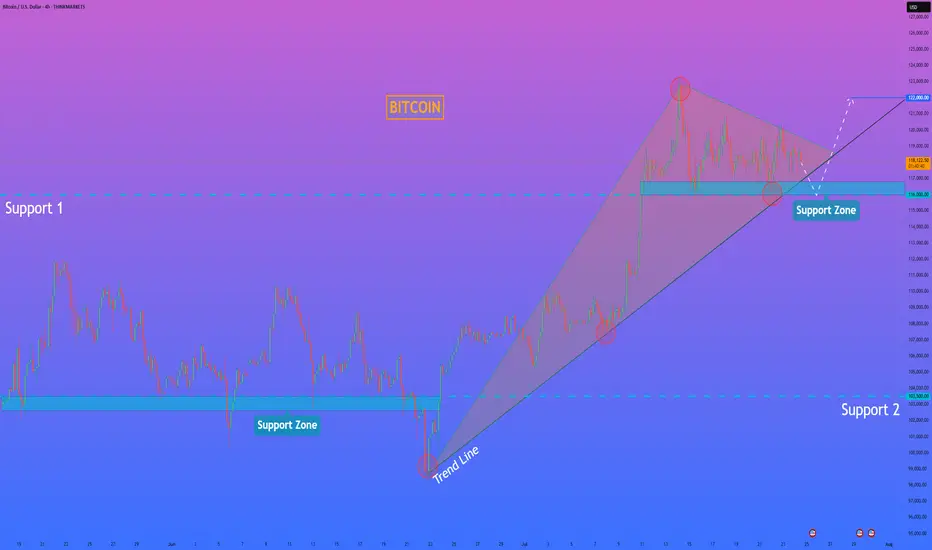
HelenP. I Bitcoin can fall to support zone and then start riseHi folks today I'm prepared for you Bitcoin analytics. If we look at the Bitcoin chart, the most prominent feature is the formation of a large bullish pennant following a strong upward impulse. This type of consolidation pattern typically suggests that the market is pausing to gather strength before continuing in the direction of the primary trend. The price is currently consolidating within the boundaries of this pennant, which are defined by an upper resistance line and a strong ascending trend line acting as the lower support. It is crucial to note the confluence of this ascending trend line with the horizontal support zone between 116000 and 116800, creating a powerful area of potential support. My analysis is based on the expectation that the price will make a final test of this key support confluence. I believe that a dip towards the 116000 - 116800 zone will be met with strong buying interest. A clear rejection from this area, confirming that buyers are defending both the horizontal and dynamic support, would be the critical condition validating a long position. A successful bounce should provide the catalyst for a bullish breakout from the top of the pennant, signaling the resumption of the uptrend. Therefore, I have set the primary goal for this subsequent upward move at the 122000 level, a logical target that would confirm the continuation of the bullish market structure. If you like my analytics you may support me with your like/comment ❤️
Disclaimer: As part of ThinkMarkets’ Influencer Program, I am sponsored to share and publish their charts in my analysis.
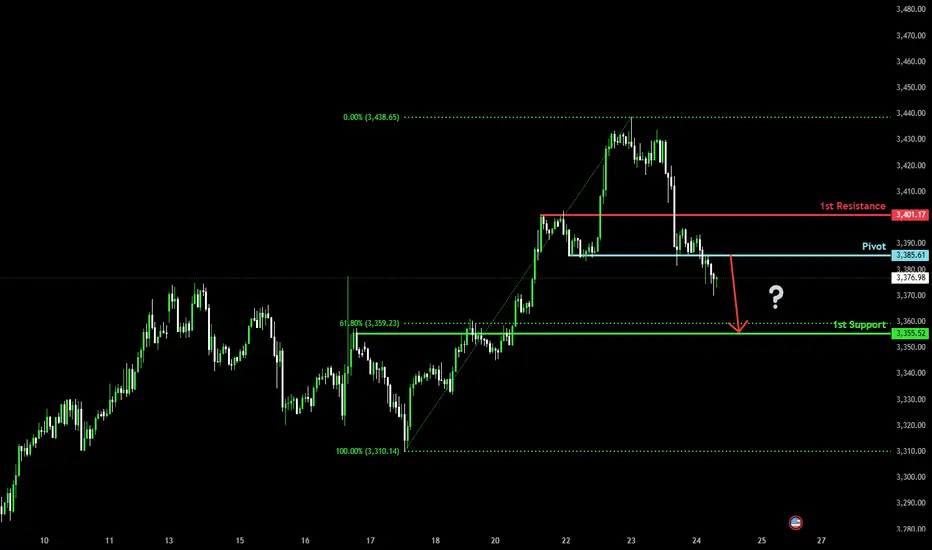
Bearish drop?The Gold (XAU/USD) has reacted off the pivot and could potentially drop to the 1st support, which is a pullback support that is slightly below the 61.8% Fibonacci retracement.
Pivot: 3,385.61
1st Support: 3,355.52
1st Resistance: 3,401.17
Risk Warning:
Trading Forex and CFDs carries a high level of risk to your capital and you should only trade with money you can afford to lose. Trading Forex and CFDs may not be suitable for all investors, so please ensure that you fully understand the risks involved and seek independent advice if necessary.
Disclaimer:
The above opinions given constitute general market commentary, and do not constitute the opinion or advice of IC Markets or any form of personal or investment advice.
Any opinions, news, research, analyses, prices, other information, or links to third-party sites contained on this website are provided on an "as-is" basis, are intended only to be informative, is not an advice nor a recommendation, nor research, or a record of our trading prices, or an offer of, or solicitation for a transaction in any financial instrument and thus should not be treated as such. The information provided does not involve any specific investment objectives, financial situation and needs of any specific person who may receive it. Please be aware, that past performance is not a reliable indicator of future performance and/or results. Past Performance or Forward-looking scenarios based upon the reasonable beliefs of the third-party provider are not a guarantee of future performance. Actual results may differ materially from those anticipated in forward-looking or past performance statements. IC Markets makes no representation or warranty and assumes no liability as to the accuracy or completeness of the information provided, nor any loss arising from any investment based on a recommendation, forecast or any information supplied by any third-party.
Bullish momentum to extend?The Fiber (EUR/USD) is reacting off the pivot and could rise to the 127.2% Fibonacci resistance.
Pivot: 1.1746
1st Support: 1.1659
1st Resistance: 1.1907
Risk Warning:
Trading Forex and CFDs carries a high level of risk to your capital and you should only trade with money you can afford to lose. Trading Forex and CFDs may not be suitable for all investors, so please ensure that you fully understand the risks involved and seek independent advice if necessary.
Disclaimer:
The above opinions given constitute general market commentary, and do not constitute the opinion or advice of IC Markets or any form of personal or investment advice.
Any opinions, news, research, analyses, prices, other information, or links to third-party sites contained on this website are provided on an "as-is" basis, are intended only to be informative, is not an advice nor a recommendation, nor research, or a record of our trading prices, or an offer of, or solicitation for a transaction in any financial instrument and thus should not be treated as such. The information provided does not involve any specific investment objectives, financial situation and needs of any specific person who may receive it. Please be aware, that past performance is not a reliable indicator of future performance and/or results. Past Performance or Forward-looking scenarios based upon the reasonable beliefs of the third-party provider are not a guarantee of future performance. Actual results may differ materially from those anticipated in forward-looking or past performance statements. IC Markets makes no representation or warranty and assumes no liability as to the accuracy or completeness of the information provided, nor any loss arising from any investment based on a recommendation, forecast or any information supplied by any third-party.

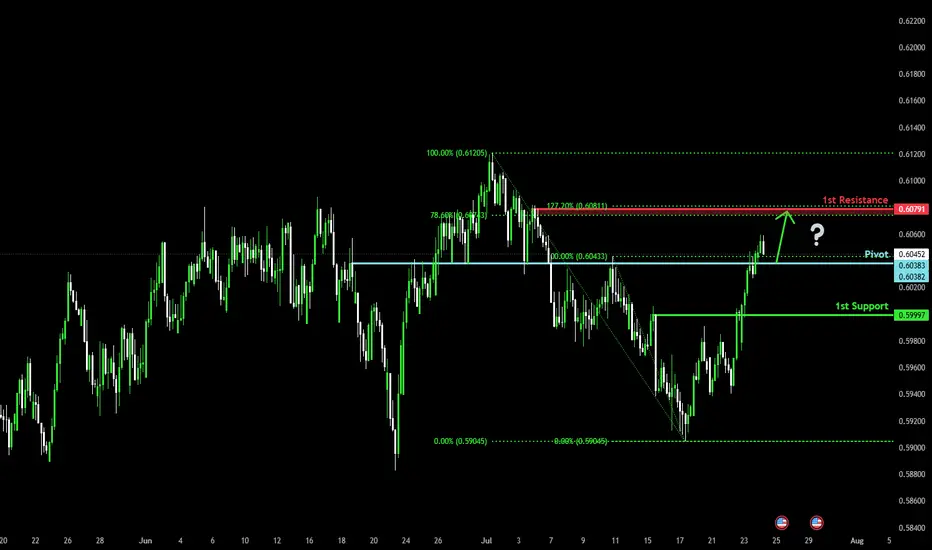
Bullish bounce for the Kiwi?The price is falling towards the pivot, which has been identified as an overlap support and could bounce to the 1st resistance, which acts as a pullback resistance.
Pivot: 0.6038
1st Support: 0.5999
1st Resistance: 0.6079
Risk Warning:
Trading Forex and CFDs carries a high level of risk to your capital and you should only trade with money you can afford to lose. Trading Forex and CFDs may not be suitable for all investors, so please ensure that you fully understand the risks involved and seek independent advice if necessary.
Disclaimer:
The above opinions given constitute general market commentary, and do not constitute the opinion or advice of IC Markets or any form of personal or investment advice.
Any opinions, news, research, analyses, prices, other information, or links to third-party sites contained on this website are provided on an "as-is" basis, are intended only to be informative, is not an advice nor a recommendation, nor research, or a record of our trading prices, or an offer of, or solicitation for a transaction in any financial instrument and thus should not be treated as such. The information provided does not involve any specific investment objectives, financial situation and needs of any specific person who may receive it. Please be aware, that past performance is not a reliable indicator of future performance and/or results. Past Performance or Forward-looking scenarios based upon the reasonable beliefs of the third-party provider are not a guarantee of future performance. Actual results may differ materially from those anticipated in forward-looking or past performance statements. IC Markets makes no representation or warranty and assumes no liability as to the accuracy or completeness of the information provided, nor any loss arising from any investment based on a recommendation, forecast or any information supplied by any third-party.
USDCHF is Attempting to Break the Trend!!Hey Traders, in today's trading session we are monitoring USDCHF for a selling opportunity around 0.79720 zone, USDCHF was trading in an uptrend and currently seems to be attempting to break it out. If we get dips below the trend i will be looking for a retrace towards more lows.
Trade safe, Joe.

EURUSD Potential UpsidesHey Traders, in today's trading session we are monitoring EURUSD for a buying opportunity around 1.16650 zone, EURUSD is trading in an uptrend and currently is in a correction phase in which it is approaching the trend at 1.16650 support and resistance area.
Trade safe, Joe.

USDJPY Breakout and Potential RetraceHey Traders, in today's trading session we are monitoring USDJPY for a buying opportunity around 146.300 zone, USDJPY was trading in a downtrend and successfully managed to break it out. Currently is in a correction phase in which it is approaching the retrace area at 146.300 support and resistance area.
Trade safe, Joe.

GBPUSD Potential UpsidesHey traders, in today's trading session we are monitoring GBPUSD for a buying opportunity around 1.35100 zone, GBPUSD is trading in an uptrend and currently is in a correction phase in which it is approaching the trend at 1.35100 support and resistance area.
Trade safe, Joe.

Bearish reversal off overlap resistance?The Cable (GBP/USD) is rising towards the pivot, which acts as an overlap resistance and could reverse to the 1st support.
Pivot: 1.3611
1st Support: 1.3469
1st Resistance: 1.3693
Risk Warning:
Trading Forex and CFDs carries a high level of risk to your capital and you should only trade with money you can afford to lose. Trading Forex and CFDs may not be suitable for all investors, so please ensure that you fully understand the risks involved and seek independent advice if necessary.
Disclaimer:
The above opinions given constitute general market commentary, and do not constitute the opinion or advice of IC Markets or any form of personal or investment advice.
Any opinions, news, research, analyses, prices, other information, or links to third-party sites contained on this website are provided on an "as-is" basis, are intended only to be informative, is not an advice nor a recommendation, nor research, or a record of our trading prices, or an offer of, or solicitation for a transaction in any financial instrument and thus should not be treated as such. The information provided does not involve any specific investment objectives, financial situation and needs of any specific person who may receive it. Please be aware, that past performance is not a reliable indicator of future performance and/or results. Past Performance or Forward-looking scenarios based upon the reasonable beliefs of the third-party provider are not a guarantee of future performance. Actual results may differ materially from those anticipated in forward-looking or past performance statements. IC Markets makes no representation or warranty and assumes no liability as to the accuracy or completeness of the information provided, nor any loss arising from any investment based on a recommendation, forecast or any information supplied by any third-party.

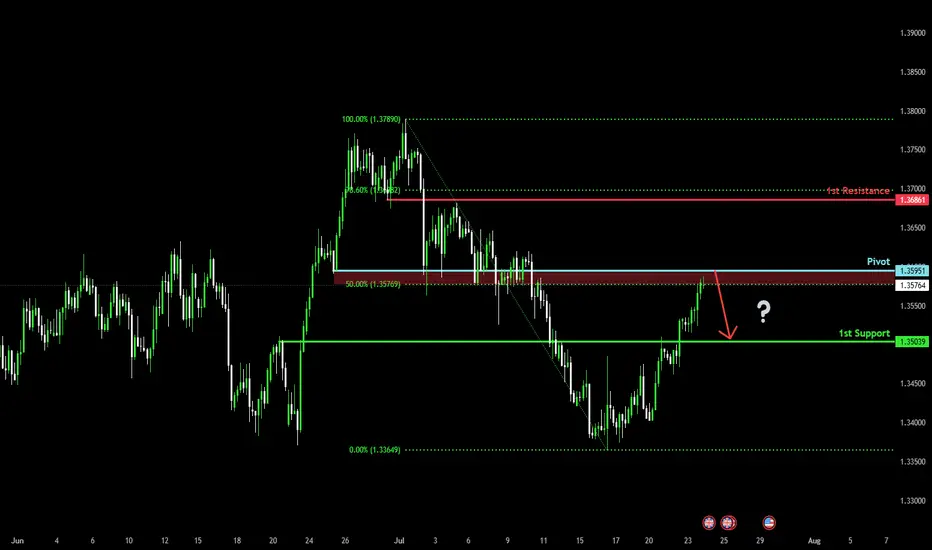
Bearish reevrsal for the Cable?The price is rising towards the pivot, which serves as a pullback resistance and could drop back to the pullback support.
Pivot: 1.3595
1st Support: 1.3503
1st Resistance: 1.3686
Risk Warning:
Trading Forex and CFDs carries a high level of risk to your capital and you should only trade with money you can afford to lose. Trading Forex and CFDs may not be suitable for all investors, so please ensure that you fully understand the risks involved and seek independent advice if necessary.
Disclaimer:
The above opinions given constitute general market commentary, and do not constitute the opinion or advice of IC Markets or any form of personal or investment advice.
Any opinions, news, research, analyses, prices, other information, or links to third-party sites contained on this website are provided on an "as-is" basis, are intended only to be informative, is not an advice nor a recommendation, nor research, or a record of our trading prices, or an offer of, or solicitation for a transaction in any financial instrument and thus should not be treated as such. The information provided does not involve any specific investment objectives, financial situation and needs of any specific person who may receive it. Please be aware, that past performance is not a reliable indicator of future performance and/or results. Past Performance or Forward-looking scenarios based upon the reasonable beliefs of the third-party provider are not a guarantee of future performance. Actual results may differ materially from those anticipated in forward-looking or past performance statements. IC Markets makes no representation or warranty and assumes no liability as to the accuracy or completeness of the information provided, nor any loss arising from any investment based on a recommendation, forecast or any information supplied by any third-party.
US dollar index (DXY) still looks weakAfter finding resistance near my 50-day EMA on the daily chart, TVC:DXY is now showing signs of continued weakness. Let's dig in.
MARKETSCOM:DOLLARINDEX
Let us know what you think in the comments below.
Thank you.
75.2% of retail investor accounts lose money when trading CFDs with this provider. You should consider whether you understand how CFDs work and whether you can afford to take the high risk of losing your money. Past performance is not necessarily indicative of future results. The value of investments may fall as well as rise and the investor may not get back the amount initially invested. This content is not intended for nor applicable to residents of the UK. Cryptocurrency CFDs and spread bets are restricted in the UK for all retail clients.

Bullish continuation?The Gold (XAU/USD) is falling towards the pivot and could bounce to the 1st resistance.
Pivot: 3,390.13
1st Support: 3,356.66
1st Resistance: 3,491.05
Risk Warning:
Trading Forex and CFDs carries a high level of risk to your capital and you should only trade with money you can afford to lose. Trading Forex and CFDs may not be suitable for all investors, so please ensure that you fully understand the risks involved and seek independent advice if necessary.
Disclaimer:
The above opinions given constitute general market commentary, and do not constitute the opinion or advice of IC Markets or any form of personal or investment advice.
Any opinions, news, research, analyses, prices, other information, or links to third-party sites contained on this website are provided on an "as-is" basis, are intended only to be informative, is not an advice nor a recommendation, nor research, or a record of our trading prices, or an offer of, or solicitation for a transaction in any financial instrument and thus should not be treated as such. The information provided does not involve any specific investment objectives, financial situation and needs of any specific person who may receive it. Please be aware, that past performance is not a reliable indicator of future performance and/or results. Past Performance or Forward-looking scenarios based upon the reasonable beliefs of the third-party provider are not a guarantee of future performance. Actual results may differ materially from those anticipated in forward-looking or past performance statements. IC Markets makes no representation or warranty and assumes no liability as to the accuracy or completeness of the information provided, nor any loss arising from any investment based on a recommendation, forecast or any information supplied by any third-party.

USDJPY Q3 | D24 | W30 | Y25📊USDJPY Q3 | D24 | W30 | Y25
Daily Forecast🔍📅
Here’s a short diagnosis of the current chart setup 🧠📈
Higher time frame order blocks have been identified — these are our patient points of interest 🎯🧭.
It’s crucial to wait for a confirmed break of structure 🧱✅ before forming a directional bias.
This keeps us disciplined and aligned with what price action is truly telling us.
📈 Risk Management Protocols
🔑 Core principles:
Max 1% risk per trade
Only execute at pre-identified levels
Use alerts, not emotion
Stick to your RR plan — minimum 1:2
🧠 You’re not paid for how many trades you take, you’re paid for how well you manage risk.
🧠 Weekly FRGNT Insight
"Trade what the market gives, not what your ego wants."
Stay mechanical. Stay focused. Let the probabilities work.
FRGNT
FX:USDJPY

GBPUSD Q3 | D24 | W30 | Y25📊GBPUSD Q3 | D24 | W30 | Y25
Daily Forecast🔍📅
Here’s a short diagnosis of the current chart setup 🧠📈
Higher time frame order blocks have been identified — these are our patient points of interest 🎯🧭.
It’s crucial to wait for a confirmed break of structure 🧱✅ before forming a directional bias.
This keeps us disciplined and aligned with what price action is truly telling us.
📈 Risk Management Protocols
🔑 Core principles:
Max 1% risk per trade
Only execute at pre-identified levels
Use alerts, not emotion
Stick to your RR plan — minimum 1:2
🧠 You’re not paid for how many trades you take, you’re paid for how well you manage risk.
🧠 Weekly FRGNT Insight
"Trade what the market gives, not what your ego wants."
Stay mechanical. Stay focused. Let the probabilities work.
FRGNT

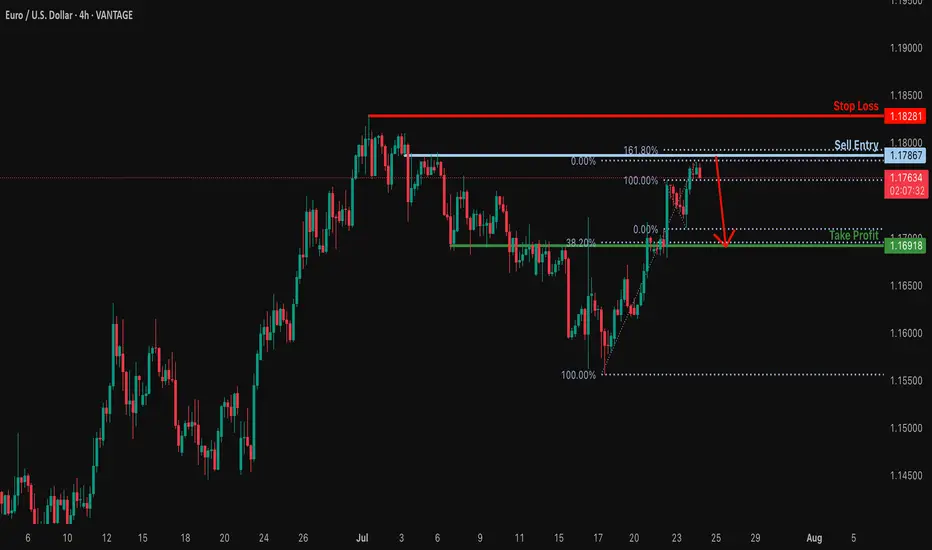
Bearish reversal off 161.8% Fibonacci resistance?EUR/USD is rising towards the resistance level which is a pullback resitance that lines up with the 161.8% Fibonacci rretracement and could drop from this level to our take profit.
Entry: 1.1786
Why we like it:
There is a pullback resistance level that lines up with the 161.8% Fibonacci extension.
Stop loss: 1.1828
Why we like it:
There is a swing high resistance.
Take profit: 1.1691
Why we like it:
There is an overlap support that aligns with the 38.2% Fibonacci retracement.
Enjoying your TradingView experience? Review us!
Please be advised that the information presented on TradingView is provided to Vantage (‘Vantage Global Limited’, ‘we’) by a third-party provider (‘Everest Fortune Group’). Please be reminded that you are solely responsible for the trading decisions on your account. There is a very high degree of risk involved in trading. Any information and/or content is intended entirely for research, educational and informational purposes only and does not constitute investment or consultation advice or investment strategy. The information is not tailored to the investment needs of any specific person and therefore does not involve a consideration of any of the investment objectives, financial situation or needs of any viewer that may receive it. Kindly also note that past performance is not a reliable indicator of future results. Actual results may differ materially from those anticipated in forward-looking or past performance statements. We assume no liability as to the accuracy or completeness of any of the information and/or content provided herein and the Company cannot be held responsible for any omission, mistake nor for any loss or damage including without limitation to any loss of profit which may arise from reliance on any information supplied by Everest Fortune Group.
BTC NEW VOLUME TREND 122KThis is a small time frame update, where BTC can try to target 22K again in the coming time frames. Since the last 15H breakdown volume, BTC can enter new uptrend volume
From the box level, there is a good chance for a new uptrend.

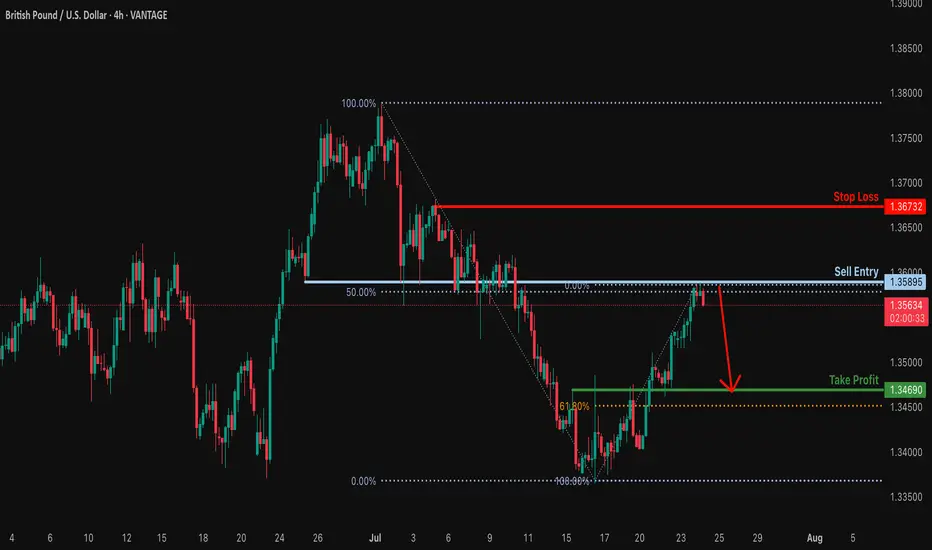
Bearish reversal off pullback resistance?The Cable (GBP/USD) is reacting off the resistance level, which is a pullback resistance that aligns with the 50% Fibonacci retracement and could drop from this level to our take profit.
Entry: 1.3589
Why we like it:
There is a pullback resistance that lines up with the 50% Fibonacci retracement.
Stop loss: 1.3673
Why we like it:
There is a swing high resistance.
Take profit: 1.3469
Why we like it:
There is an overlap support level that is slightly above the 61.8% Fibonacci retracement.
Enjoying your TradingView experience? Review us!
Please be advised that the information presented on TradingView is provided to Vantage (‘Vantage Global Limited’, ‘we’) by a third-party provider (‘Everest Fortune Group’). Please be reminded that you are solely responsible for the trading decisions on your account. There is a very high degree of risk involved in trading. Any information and/or content is intended entirely for research, educational and informational purposes only and does not constitute investment or consultation advice or investment strategy. The information is not tailored to the investment needs of any specific person and therefore does not involve a consideration of any of the investment objectives, financial situation or needs of any viewer that may receive it. Kindly also note that past performance is not a reliable indicator of future results. Actual results may differ materially from those anticipated in forward-looking or past performance statements. We assume no liability as to the accuracy or completeness of any of the information and/or content provided herein and the Company cannot be held responsible for any omission, mistake nor for any loss or damage including without limitation to any loss of profit which may arise from reliance on any information supplied by Everest Fortune Group.
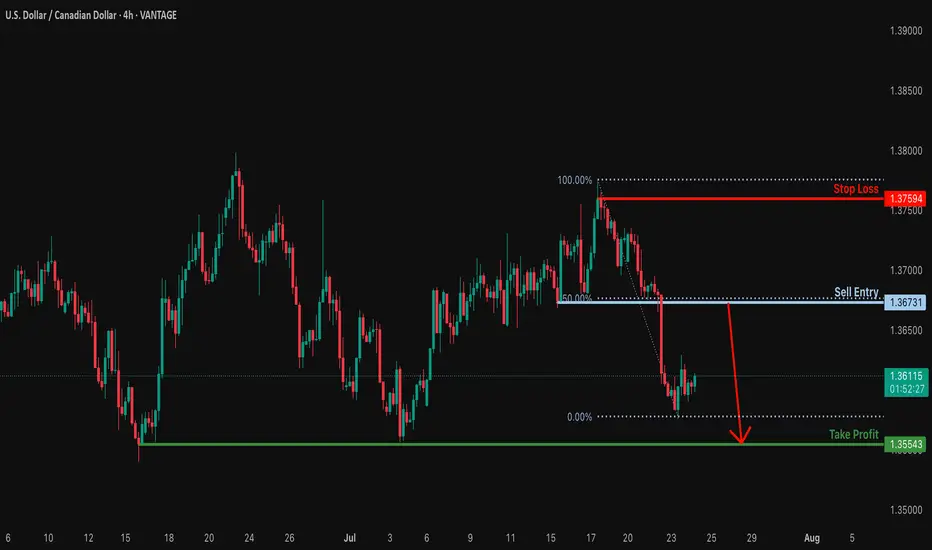
Heading into 50% Fibonacci resistance?USD/CAD is rising towards the resistance which is a pullback reistance that lines up with the 50% Fibonacci retracement and could reverse from this level to our take profit.
Entry: 1.3673
Why we like it:
There is a pullback resistance that lines up with the 50% Fibonacci retracement.
Stop loss: 1.3759
Why we like it:
There is a swing high resistance.
Take profit: 1.3554
Why we like it:
There is a multi swing low support.
Enjoying your TradingView experience? Review us!
Please be advised that the information presented on TradingView is provided to Vantage (‘Vantage Global Limited’, ‘we’) by a third-party provider (‘Everest Fortune Group’). Please be reminded that you are solely responsible for the trading decisions on your account. There is a very high degree of risk involved in trading. Any information and/or content is intended entirely for research, educational and informational purposes only and does not constitute investment or consultation advice or investment strategy. The information is not tailored to the investment needs of any specific person and therefore does not involve a consideration of any of the investment objectives, financial situation or needs of any viewer that may receive it. Kindly also note that past performance is not a reliable indicator of future results. Actual results may differ materially from those anticipated in forward-looking or past performance statements. We assume no liability as to the accuracy or completeness of any of the information and/or content provided herein and the Company cannot be held responsible for any omission, mistake nor for any loss or damage including without limitation to any loss of profit which may arise from reliance on any information supplied by Everest Fortune Group.
USD/JPY(20250724)Today's AnalysisMarket news:
U.S. President Trump continued to lash out at the Federal Reserve on Tuesday, but seemed to back off from the remaining plan to fire Chairman Powell. "I think he's doing a bad job, but he's going to be out of office soon anyway," Trump said in an exchange with reporters at the White House. "In eight months, he'll be out of office."
Technical analysis:
Today's buying and selling boundaries:
146.60
Support and resistance levels:
147.70
147.29
147.02
146.18
145.92
145.51
Trading strategy:
If the price breaks through 146.60, consider buying in, with the first target price at 147.02
If the price breaks through 146.18, consider selling in, with the first target price at 145.92
