Bearish drop?USD/CAD is reacting off the resistance level which is a pullback resistance and could drop from this level to our take profit.
Entry: 1.3849
Why we like it:
There is a pullback resistance level.
Stop loss: 1.3946
Why we like it:
There is a pullback resistance level.
Take profit: 1.3750
Why we like it:
There is a pullback support level that aligns with the 23.6% Fibonacci retracement.
Enjoying your TradingView experience? Review us!
Please be advised that the information presented on TradingView is provided to Vantage (‘Vantage Global Limited’, ‘we’) by a third-party provider (‘Everest Fortune Group’). Please be reminded that you are solely responsible for the trading decisions on your account. There is a very high degree of risk involved in trading. Any information and/or content is intended entirely for research, educational and informational purposes only and does not constitute investment or consultation advice or investment strategy. The information is not tailored to the investment needs of any specific person and therefore does not involve a consideration of any of the investment objectives, financial situation or needs of any viewer that may receive it. Kindly also note that past performance is not a reliable indicator of future results. Actual results may differ materially from those anticipated in forward-looking or past performance statements. We assume no liability as to the accuracy or completeness of any of the information and/or content provided herein and the Company cannot be held responsible for any omission, mistake nor for any loss or damage including without limitation to any loss of profit which may arise from reliance on any information supplied by Everest Fortune Group.
Usd-cad

USDCAD Potential UpsidesHey Traders, in tomorrow's trading session we are monitoring USDCAD for a buying opportunity around 1.37900 zone, USDCAD is trading in an uptrend and currently is in a correction phase in which it is approaching the trend at 1.37900 support and resistance area.
Trade safe, Joe.

Potential bullish rise?USD/CAD has reacted off the support level which is an overlap support that lines up with the 23.6% Fibonacci retracement and could rise from this level to our take profit.
Entry: 1.3787
Why we like it:
There is an overlap support level that lines up with the 23.6% Fibonacci retracement.
Stop loss: 1.3774
Why we like it:
There is an overlap support level that aligns with the 50% Fibonacci retracement.
Take profit: 1.3825
Why we like it:
There is a pullback resistance level.
Enjoying your TradingView experience? Review us!
Please be advised that the information presented on TradingView is provided to Vantage (‘Vantage Global Limited’, ‘we’) by a third-party provider (‘Everest Fortune Group’). Please be reminded that you are solely responsible for the trading decisions on your account. There is a very high degree of risk involved in trading. Any information and/or content is intended entirely for research, educational and informational purposes only and does not constitute investment or consultation advice or investment strategy. The information is not tailored to the investment needs of any specific person and therefore does not involve a consideration of any of the investment objectives, financial situation or needs of any viewer that may receive it. Kindly also note that past performance is not a reliable indicator of future results. Actual results may differ materially from those anticipated in forward-looking or past performance statements. We assume no liability as to the accuracy or completeness of any of the information and/or content provided herein and the Company cannot be held responsible for any omission, mistake nor for any loss or damage including without limitation to any loss of profit which may arise from reliance on any information supplied by Everest Fortune Group.

Bearish drop?USD/CAD has reacted off the resistance level which is a pullback resistance that lines up with the 23.6% Fibonacci retracement and could drop from this level to our take profit.
Entry: 1.3787
Why we like it:
There is a pullback resistance level that lines up with the 23.6% Fibonacci retracement.
Stop loss: 1.3826
Why we like it:
There is a pullback resistance level.
Take profit: 1.3749
Why we like it:
There is a pullback support level that aligns with the 23.6% Fibonacci retracement.
Enjoying your TradingView experience? Review us!
Please be advised that the information presented on TradingView is provided to Vantage (‘Vantage Global Limited’, ‘we’) by a third-party provider (‘Everest Fortune Group’). Please be reminded that you are solely responsible for the trading decisions on your account. There is a very high degree of risk involved in trading. Any information and/or content is intended entirely for research, educational and informational purposes only and does not constitute investment or consultation advice or investment strategy. The information is not tailored to the investment needs of any specific person and therefore does not involve a consideration of any of the investment objectives, financial situation or needs of any viewer that may receive it. Kindly also note that past performance is not a reliable indicator of future results. Actual results may differ materially from those anticipated in forward-looking or past performance statements. We assume no liability as to the accuracy or completeness of any of the information and/or content provided herein and the Company cannot be held responsible for any omission, mistake nor for any loss or damage including without limitation to any loss of profit which may arise from reliance on any information supplied by Everest Fortune Group.

USDCAD Sell To BuyDefined divergence relative to the markets as a whole and over extended up trend within the chart. Regardless of if this is the end of bullishness or just a correction, a correction is incoming. The buy is either a retest of the leftover high, or a continuation of current uptrend. Trade Safe, Trade Smart, Trade Drippy!

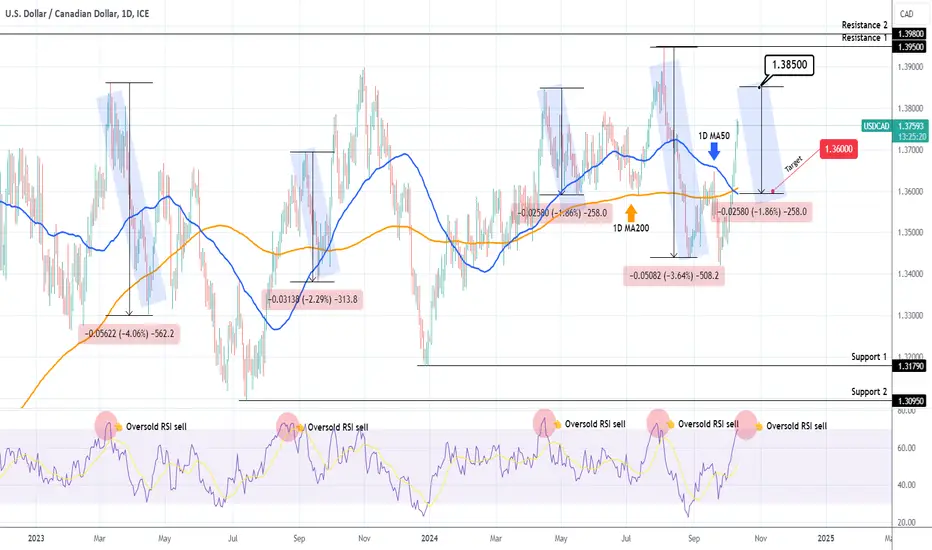
USDCAD Approaching our sell entry.The USDCAD pair has been rising since the September 25 Low, all inside a 2-year Rectangle pattern of a wide range. The 1D RSI is about to enter the 70.00 overbought zone and every time it has done so within this pattern, a little later it got rejected to at least the 1D MA50 (blue trend-line).
As a result, we will wait until 1.38500 and sell, targeting 1.36000 (which would be a -1.86% decline from the top, the minimum from the group of similar declines) or take the profit if the price hits the 1D MA50 before 1.36000.
-------------------------------------------------------------------------------
** Please LIKE 👍, FOLLOW ✅, SHARE 🙌 and COMMENT ✍ if you enjoy this idea! Also share your ideas and charts in the comments section below! This is best way to keep it relevant, support us, keep the content here free and allow the idea to reach as many people as possible. **
-------------------------------------------------------------------------------
💸💸💸💸💸💸
👇 👇 👇 👇 👇 👇
USDCAD Prime rejection on a double top and a Death CrossUSDCAD hit the 0.618 Fibonacci level of the 2 year Rectangle pattern and so far is on a Double Top.
The 1day MACD is forming a pattern similar to a previous 0.618 Fib Double Top in May 2023.
In the meantime, a 1day Death Cross is formed, exactly like on June 1st of that previous Double Top pattern.
This is a strong bearish mixture and on all cases the target has been at least the 0.236 Fib.
Sell and target 1.33000.
Follow us, like the idea and leave a comment below!!

Pullback resistance ahead for the Loonie?The price is rising towards the pivot which has been identified as a pullback resistance and could reverse to the 1st support level which is an overlap support.
Pivot: 1.3616
1st Support: 1.3543
1st Resistance: 1.3688
Risk Warning:
Trading Forex and CFDs carries a high level of risk to your capital and you should only trade with money you can afford to lose. Trading Forex and CFDs may not be suitable for all investors, so please ensure that you fully understand the risks involved and seek independent advice if necessary.
Disclaimer:
The above opinions given constitute general market commentary, and do not constitute the opinion or advice of IC Markets or any form of personal or investment advice.
Any opinions, news, research, analyses, prices, other information, or links to third-party sites contained on this website are provided on an "as-is" basis, are intended only to be informative, is not an advice nor a recommendation, nor research, or a record of our trading prices, or an offer of, or solicitation for a transaction in any financial instrument and thus should not be treated as such. The information provided does not involve any specific investment objectives, financial situation and needs of any specific person who may receive it. Please be aware, that past performance is not a reliable indicator of future performance and/or results. Past Performance or Forward-looking scenarios based upon the reasonable beliefs of the third-party provider are not a guarantee of future performance. Actual results may differ materially from those anticipated in forward-looking or past performance statements. IC Markets makes no representation or warranty and assumes no liability as to the accuracy or completeness of the information provided, nor any loss arising from any investment based on a recommendation, forecast or any information supplied by any third-party.

USD CADTHIS IS MY SETUP FOR USD CAD
I use Fibonacci to get these extreme points and my preferred one is 75% retracement, with a risk-reward of 1:3.
Trade carefully
This is not financial advice, DYOR.

Bullish bounce?USD/CAD is falling towards the support level which is an overlap support that aligns with the 61.8% Fibonacci retracement and could bounce from this level to our take profit.
Entry: 1.3461
Why we like it:
There is an overlap support level which aligns with the 61.8% Fibonacci retracement.
Stop loss: 1.3420
Why we like it:
There is a pullback support level.
Take profit: 1.3536
Why we like it:
There is a pullback support level.
Enjoying your TradingView experience? Review us!
Please be advised that the information presented on TradingView is provided to Vantage (‘Vantage Global Limited’, ‘we’) by a third-party provider (‘Everest Fortune Group’). Please be reminded that you are solely responsible for the trading decisions on your account. There is a very high degree of risk involved in trading. Any information and/or content is intended entirely for research, educational and informational purposes only and does not constitute investment or consultation advice or investment strategy. The information is not tailored to the investment needs of any specific person and therefore does not involve a consideration of any of the investment objectives, financial situation or needs of any viewer that may receive it. Kindly also note that past performance is not a reliable indicator of future results. Actual results may differ materially from those anticipated in forward-looking or past performance statements. We assume no liability as to the accuracy or completeness of any of the information and/or content provided herein and the Company cannot be held responsible for any omission, mistake nor for any loss or damage including without limitation to any loss of profit which may arise from reliance on any information supplied by Everest Fortune Group.

Bearish reversal off pullbacvk resistance?The Loonnie (USDD/CAD)is rising towards the pivot which acts as a pullback resistance and could reverse to the overlap support level.
Pivot: 1.3549
1st Support: 1.3491
1st Resistance: 1.3614
Risk Warning:
Trading Forex and CFDs carries a high level of risk to your capital and you should only trade with money you can afford to lose. Trading Forex and CFDs may not be suitable for all investors, so please ensure that you fully understand the risks involved and seek independent advice if necessary.
Disclaimer:
The above opinions given constitute general market commentary, and do not constitute the opinion or advice of IC Markets or any form of personal or investment advice.
Any opinions, news, research, analyses, prices, other information, or links to third-party sites contained on this website are provided on an "as-is" basis, are intended only to be informative, is not an advice nor a recommendation, nor research, or a record of our trading prices, or an offer of, or solicitation for a transaction in any financial instrument and thus should not be treated as such. The information provided does not involve any specific investment objectives, financial situation and needs of any specific person who may receive it. Please be aware, that past performance is not a reliable indicator of future performance and/or results. Past Performance or Forward-looking scenarios based upon the reasonable beliefs of the third-party provider are not a guarantee of future performance. Actual results may differ materially from those anticipated in forward-looking or past performance statements. IC Markets makes no representation or warranty and assumes no liability as to the accuracy or completeness of the information provided, nor any loss arising from any investment based on a recommendation, forecast or any information supplied by any third-party.

USDCAD: Sell signalUSDCAD is almost neutral on its 1D technical outlook (RSI = 44.464, MACD = -0.002, ADX = 19.851) as it rebounded on August's low. This is a similar price action to the April-May 2023 sequence and as long as the 1D MA50 contains the price under it, we will be bearish. Our Target is just over the S1 Zone (TP = 1.32500).
## If you like our free content follow our profile to get more daily ideas. ##
## Comments and likes are greatly appreciated. ##

Bearish reversal?USD/CAD is rising towards the resistance level which is a pullback resistance that is slightly above the 50% Fibonacci retracement and could reverse from this level to our take profit.
Entry: 1.3549
Why we like it:
There is a pullback resistance that is slightly above the 50% Fibonacci retracement.
Stop loss: 1.3617
Why we like it:
There is a pullback resistance level.
Take profit: 1.3462
Why we like it:
There is a pullback support level.
Enjoying your TradingView experience? Review us!
Please be advised that the information presented on TradingView is provided to Vantage (‘Vantage Global Limited’, ‘we’) by a third-party provider (‘Everest Fortune Group’). Please be reminded that you are solely responsible for the trading decisions on your account. There is a very high degree of risk involved in trading. Any information and/or content is intended entirely for research, educational and informational purposes only and does not constitute investment or consultation advice or investment strategy. The information is not tailored to the investment needs of any specific person and therefore does not involve a consideration of any of the investment objectives, financial situation or needs of any viewer that may receive it. Kindly also note that past performance is not a reliable indicator of future results. Actual results may differ materially from those anticipated in forward-looking or past performance statements. We assume no liability as to the accuracy or completeness of any of the information and/or content provided herein and the Company cannot be held responsible for any omission, mistake nor for any loss or damage including without limitation to any loss of profit which may arise from reliance on any information supplied by Everest Fortune Group.

USDCAD Prepare for red October - November.The USDCAD pair hit both of our Targets on the July 25 (see chart below) sell signal:
The initial rebound stopped on the 1D MA50 (blue trend-line) where the price was rejected with the 1D RSI forming a pattern similar to May 2023. As a result, it is possible to see another short-term rebound but on the medium-term, we expect October and November to be another sell sequence.
The March - July 2023 fractal had two similar Bearish Legs of -4.10% each. So since the current first Leg was -3.64%, we expect the one that will follow now to be of around the same strength.
As a result we can target 1.32000 on low risk, just above the Support 1 level.
-------------------------------------------------------------------------------
** Please LIKE 👍, FOLLOW ✅, SHARE 🙌 and COMMENT ✍ if you enjoy this idea! Also share your ideas and charts in the comments section below! This is best way to keep it relevant, support us, keep the content here free and allow the idea to reach as many people as possible. **
-------------------------------------------------------------------------------
💸💸💸💸💸💸
👇 👇 👇 👇 👇 👇

Heading into 38.2% Fibonacci resistance?USD/CAD is rising towards the pivot which has been identified as a pullback resistance and could reverse to the pullback support.
Pivot: 1.3502
1st Support: 1.3423
1st Resistance: 1.3549
Risk Warning:
Trading Forex and CFDs carries a high level of risk to your capital and you should only trade with money you can afford to lose. Trading Forex and CFDs may not be suitable for all investors, so please ensure that you fully understand the risks involved and seek independent advice if necessary.
Disclaimer:
The above opinions given constitute general market commentary, and do not constitute the opinion or advice of IC Markets or any form of personal or investment advice.
Any opinions, news, research, analyses, prices, other information, or links to third-party sites contained on this website are provided on an "as-is" basis, are intended only to be informative, is not an advice nor a recommendation, nor research, or a record of our trading prices, or an offer of, or solicitation for a transaction in any financial instrument and thus should not be treated as such. The information provided does not involve any specific investment objectives, financial situation and needs of any specific person who may receive it. Please be aware, that past performance is not a reliable indicator of future performance and/or results. Past Performance or Forward-looking scenarios based upon the reasonable beliefs of the third-party provider are not a guarantee of future performance. Actual results may differ materially from those anticipated in forward-looking or past performance statements. IC Markets makes no representation or warranty and assumes no liability as to the accuracy or completeness of the information provided, nor any loss arising from any investment based on a recommendation, forecast or any information supplied by any third-party.

USDCAD Breakout And Potential RetraceHey Traders, in today's trading session we are monitoring USDCAD for a selling opportunity around 1.35 zone, USDCAD was trading in a downtrend and successfully managed to break it out. Currently is in a correction phase in which it is approaching the retrace area at 1.35 support and resistance area.
Trade safe, Joe.

Bearish reversal off pullback resistance?USD/CAD is rising towards the resistance level which is a pullback resistance and could reverse from this level to our take profit.
Entry: 1.3493
Why we like it:
There is a pullback resistance level.
Stop loss: 1.3547
Why we like it:
There is an overlap resistance level that is slightly above the 50% Fibonacci retracement.
Take profit: 1.3421
Why we like it:
There is a pullback support.
Enjoying your TradingView experience? Review us!
Please be advised that the information presented on TradingView is provided to Vantage (‘Vantage Global Limited’, ‘we’) by a third-party provider (‘Everest Fortune Group’). Please be reminded that you are solely responsible for the trading decisions on your account. There is a very high degree of risk involved in trading. Any information and/or content is intended entirely for research, educational and informational purposes only and does not constitute investment or consultation advice or investment strategy. The information is not tailored to the investment needs of any specific person and therefore does not involve a consideration of any of the investment objectives, financial situation or needs of any viewer that may receive it. Kindly also note that past performance is not a reliable indicator of future results. Actual results may differ materially from those anticipated in forward-looking or past performance statements. We assume no liability as to the accuracy or completeness of any of the information and/or content provided herein and the Company cannot be held responsible for any omission, mistake nor for any loss or damage including without limitation to any loss of profit which may arise from reliance on any information supplied by Everest Fortune Group.

USD CADTHIS IS MY SETUP FOR USD CAD
I use Fibonacci to get these extreme points and my preferred one is 75% retracement, with a risk-reward of 1:3.
Trade carefully
This is not financial advice, DYOR.

USDCAD Potential DownsidesHey Traders, in today's trading session we are monitoring USDCAD for a selling opportunity around 1.35800 zone, USDCAD is trading in a downtrend and currently is in a correction phase in which it is approaching the trend at 1.35800 support and resistance area.
Trade safe, Joe.

USDCAD Potential UpsidesHey Traders, in today's trading session we are monitoring USDCAD for a buying opportunity around 1.35700 zone, USDCAD is trading in an uptrend and currently is in a correction phase in which it is approaching the trend at 1.35700 support and resistance area.
Trade safe, Joe.

USDCAD Potential UpsidesHey Traders, in today's trading session we are monitoring USDCAD for a buying opportunity around 1.35750 zone, USDCAD is trading in an uptrend and currently is in a correction phase in which it is approaching the trend at 1.35750 support and resistance area.
Trade safe, Joe.

USDCAD Breakout And Potential RetraceHey Traders, in today's trading session we are monitoring USDCAD for a buying opportunity around 1.35300 zone, USDCAD was trading in a downtrend and successfully managed to break it out. Currently is in a correction phase in which it is approaching the retrace area at 1.35300 support and resistance area.
Trade safe, Joe.

USDCAD Is Approaching An Important SupportHey Traders, in today's trading session we are monitoring USDCAD for a buying opportunity around 1.34800 zone, USDCAD is trading in an uptrend and currently is in a correction phase in which it is approaching the trend at 1.34800 support and resistance area.
Trade safe, Joe.
