✨ NEW: USDCAD ✨ SWING TRADE ✨SLO @ 1.3770 ⏳
TP4 @ 1.3740 (closing ALL Buy Orders)
TP3 @ 1.3633 (shaving 25%)
TP2 @ 1.3566 (shaving 25%)
TP1 @ 1.3466 (shaving 25%)
BSO @ 1.3366 📈
BLO @ 1.3305 ⏳
ADDITIONAL INFO:
With CAD and USD News on the horizon, I'm anticipating another bounce to the upside before PA continues the DT.
Usd-cad

🔥 NEW: USDCAD 🔥 AGGRESSIVE DAY TRADE 🔥I just placed the following trade. This is a counter-trend trade. Enter at your own risk. Manage your trade and use conservative position sizes.
USDCAD...UT
SLO2 @ 1.3452 ⏳
SLO1 @ 1.3438 ⏳
TP @ 1.3433 (1H)
MO-LONG @ 1.3377 📈

USDCAD Potential Forecast | 7th June 2023 Fundamental Backdrop
BOC monetary policy statement today, expected to maintain.
Potential bearish pressure coming into USDCAD if BOC hikes.
Technical Confluences
Near term resistance level at 1.36374.
Near term support level 1.33166.
Idea
We believe that the BOC will maintain interest rates and this will solidify the notion that USDCAD will remain in a range-bound market.
NOT FINANCIAL ADVICE DISCLAIMER
The trading related ideas posted by OlympusLabs are for educational and informational purposes only and should not be considered as financial advice. Trading in financial markets involves a high degree of risk, and individuals should carefully consider their investment objectives, financial situation, and risk tolerance before making any trading decisions based on our ideas.
We are not a licensed financial advisor or professional, and the information we are providing is based on our personal experience and research. We make no guarantees or promises regarding the accuracy, completeness, or reliability of the information provided, and users should do their own research and analysis before making any trades.
Users should be aware that trading involves significant risk, and there is no guarantee of profit. Any trading strategy may result in losses, and individuals should be prepared to accept those risks.
OlympusLabs and its affiliates are not responsible for any losses or damages that may result from the use of our trading related ideas or the information provided on our platform. Users should seek the advice of a licensed financial advisor or professional if they have any doubts or concerns about their investment strategies.

USD CAD - FUNDAMENTAL ANALYSISThe Canadian dollar (CAD) is poised for potential gains, especially if the Bank of Canada's impending policy rate decisions, likely influenced by robust economic indicators, result in a surprise rate hike and policy reconvergence.
Bank of Canada's Policy Rate Steady But Rate Hike on Horizon
According to Brian Daingerfield however, Head of G10 FX Strategy at Natwest, the Bank of Canada (BoC) is likely to hold its policy rate steady at 4.50% at their next meeting on June 7th.
"We expect no change in the Bank of Canada (BoC) policy rate at the June 7th meeting. Since pausing at the January meeting, the economic outlook has remained resilient and services CPI has shown signs of reaccelerating," he states. Daingerfield adds that there is a strong case for a rate hike at one of the BoC's next two meetings, most likely in July.
According to their research, the recent economic data indicates the need for additional monetary tightening.
"In our view, the data are now showing evidence that additional tightening is needed. On the labour side, April’s job data showed a market still in excess demand with an unemployment rate of 5.0% (unchanged since December) and hourly wage growth of 5.2% y/y," he says.
Additionally, the analyst points out that first quarter GDP came in quite strong, exceeding both market expectations and BoC's projection.
Canadian CPI data for April revealed higher-than-expected figures, contributing to the case for tightening.
Daingerfield elaborates, "On inflation, Canada CPI came in stronger-than-expected on both the monthly and annual headline figures for April. While the bank’s key measures of core inflation have been relatively stable on short-term aggregates, the services category has sharply accelerated on a 3-month annualized basis."
However, the analyst notes that BoC Governor Macklem seemed to take a more relaxed view of the data, hinting that the Bank may not be ready to abandon its rate pause just yet.
Implications for the Canadian Dollar
The recent strength of the USD has had a significant impact on the Canadian dollar (CAD), which Daingerfield views as a high-beta USD currency, closely tracking US data and the Fed.
"In recent weeks and months, the USD tide has continued to act as a driving force for the Canadian dollar, and as the USD has found its footing the CAD has rallied on crosses in lockstep with the USD," he observes.
However, the analsyt suggests that strong domestic data, particularly April's CPI and first-quarter GDP, introduce risks to this trend.
Return to Tightening Cycle Likely to Boost CAD
Daingerfield believes that a return to the tightening cycle by the BoC could be beneficial for the CAD, especially given its lagging position relative to its G10 peers.
"A rate hike would return the BoC to the tightening pack given that it was the first major central bank to announce a pause to its rate hiking cycle on January 25th," he says.
Daingerfield also speculates that a hawkish statement in June or a surprise rate hike could act as tailwinds supporting the CAD's performance against the USD and other currencies.

USDCAD Weekly Forecast Overnight Rate | 4th June 2023Fundamental Backdrop
Overnight Rate on Wednesday is expected to maintain at 4.50%
Technical Confluences
Resistance level at 1.36374
Support level at 1.33166
Idea
If the Overnight Rate maintains at 4.50% as expected, we could see the price drop towards the support level at 1.33166.
However, if the Overnight Rate increases, we could see the price rise towards the resistance at 1.36374.
NOT FINANCIAL ADVICE DISCLAIMER
The trading related ideas posted by OlympusLabs are for educational and informational purposes only and should not be considered as financial advice. Trading in financial markets involves a high degree of risk, and individuals should carefully consider their investment objectives, financial situation, and risk tolerance before making any trading decisions based on our ideas.
We are not a licensed financial advisor or professional, and the information we are providing is based on our personal experience and research. We make no guarantees or promises regarding the accuracy, completeness, or reliability of the information provided, and users should do their own research and analysis before making any trades.
Users should be aware that trading involves significant risk, and there is no guarantee of profit. Any trading strategy may result in losses, and individuals should be prepared to accept those risks.
OlympusLabs and its affiliates are not responsible for any losses or damages that may result from the use of our trading related ideas or the information provided on our platform. Users should seek the advice of a licensed financial advisor or professional if they have any doubts or concerns about their investment strategies.

USDCAD Potential UpsidesHey Traders, in the coming week we are monitoring USDCAD for a buying opportunity around 1.33500 zone, USDCAD is trading in an uptrend and currently seems to be in a correction phase in which it is approaching the major trend at 1.33500 support and resistance zone.
Trade safe, Joe.

USD/CAD: Pullback After NFP
Today's NFP report will be the main reason for smart money to push USDCAD up.
We already see positive bullish signs on 4H.
I believe that the pair will grow.
Target level - 1.35
Please, support my work with like!

USDCAD Potential UpsidesHey Traders, in today's trading session we are monitoring USDCAD for a buying opportunity around 1.35800 zone, USDCAD is trading in an uptrend and currently seems to be in a correction phase in which it is approaching the major trend at 1.35800 support and resistance zone.
Trade safe, Joe.

Une tendance haussière pour cette paireCette paire semble continuer sa remontee. La tendance est donc haussière.

USDCAD Potential UpsidesHey Traders, in today's trading session we are monitoring USDCAD for a buying opportunity around 1.35500 zone, USDCAD was trading in a downtrend and successfully managed to break it out, currently USDCAD is in a correction phase in which it is approaching the retrace area at 1.35500 support and resistance zone.
Trade safe, Joe.

USD CADI will wait for a pullback and place a buy limit order at 1.35561.
Remember: Take some profits if the trade is going as planned and move your SL to entry.

USDCAD Breakout and potential retraceHey Traders, in today's trading session we are monitoring USDCAD for a buying opportunity around 1.35600 zone, USDCAD was trading in a downtrend and successfully managed to break it out after a bunch of positive USD data. currently we are waiting for a correction to see a potential retrace of the trend towards more upsides.
Trade safe, Joe.


USDCAD Potential UpsidesHey Traders, in the coming week we are monitoring USDCAD for a buying opportunity around 1.34600 zone, USDCAD is trading in an uptrend and currently seems to be in a correction phase in which it is approaching the major trend at 1.34600 support zone.
Trade safe, Joe.

USDCAD: Buy opportunity inside a Triangle.USDCAD is stuck in between the 1D MA200 and 1D MA50, inside a Triangle pattern. The 1D timeframe is naturally neutral technically (RSI = 51.593, MACD = -0.003, ADX = 11.724) since the price is in the middle of the pattern and that recent rebound on the bottom of the Triangle is the last buy opportunity before it hits the top (LH trendline) again. We are long again, TP = 1.37545.
Prior idea:
## If you like our free content follow our profile to get more daily ideas. ##
## Comments and likes are greatly appreciated. ##

USD CAD - FUNDAMENTAL ANALYSISCommodity Currencies Still Vulnerable
Danske expects that both the Bank of Canada and Federal Reserve will hold rates steady over the second half of 2023.
It does, however, consider that market pricing is more out of line for the Federal Reserve than the Bank of Canada which will lead to a weaker bias for the Canadian currency against the US unit.
Nevertheless, it considers that the Canadian dollar is in a relatively strong position relative to other commodity currencies which will limit selling pressure.
USDCAD Potential UpsidesHey Traders, in today's trading session we are monitoring USDCAD for a buying opportunity around 1.34 zone, USDCAD is trading in an uptrend and currently in a correction phase in which it is approaching the major trend at 1.34 support and resistance zone.
Trade safe, Joe.

USDCAD Buy Forecast | 16th May 2023Fundamental Backdrop
The Trimmed CPI y/y dropped from 4.4% to 4.2%, which shows that inflation is dropping.
This could lead the central bank to lower interest rates
Technical Confluences
Resistance at 1.35200
Support at 1.34100
Idea
With the CAD expecting to weaken, I'm looking for price to possibly head back up to retest the resistance at 1.35200
NOT FINANCIAL ADVICE DISCLAIMER
The trading related ideas posted by OlympusLabs are for educational and informational purposes only and should not be considered as financial advice. Trading in financial markets involves a high degree of risk, and individuals should carefully consider their investment objectives, financial situation, and risk tolerance before making any trading decisions based on our ideas.
We are not a licensed financial advisor or professional, and the information we are providing is based on our personal experience and research. We make no guarantees or promises regarding the accuracy, completeness, or reliability of the information provided, and users should do their own research and analysis before making any trades.
Users should be aware that trading involves significant risk, and there is no guarantee of profit. Any trading strategy may result in losses, and individuals should be prepared to accept those risks.
OlympusLabs and its affiliates are not responsible for any losses or damages that may result from the use of our trading related ideas or the information provided on our platform. Users should seek the advice of a licensed financial advisor or professional if they have any doubts or concerns about their investment strategies.

VIDEO ✨ NEW: USDCAD ✨ PRE CAD NEWS ✨-SL @ 1.36681 🚫
SLO2 @ 1.3620 ⏳
SLO1 @ 1.3525 ⏳ (half position)
TP1 @ 1.3350
TP2 @ 1.3215
TP3 @ 1.2980
TP4 @ 1.2833
BLO @ 1.2795 ⏳
-SL @ 1.27278 🚫
00:00 PRE CAD NEWS
00:58 Boost, Follow, Comment, Join
01:40 Technical Analysis
02:54 Fundamental Analysis
05:42 Curve Analysis
07:42 News Anticipatory Trend
08:08 Risk-to-Reward
09:44 LIVE STREAM @ 05:15 PT / 08:15 ET 🔥

✨ NEW: USDCAD ✨ PRE CAD News ✨-SL @ 1.36681
SLO2 @ 1.3620 (conservative)
SLO1 @ 1.3525 (aggressive)
TP1 @ 1.3350
TP2 @ 1.3215
TP3 @ 1.2980
TP4 @ 1.2833
BLO @ 1.2795
-SL @ 1.27278
TECHNICAL ANALYSIS:
Although, the pair is currently trading above the 200-day moving average, which is a bullish signal, Price Action for USDCAD is sideways. This range is a strong indication that it is consolidating before moving in a new direction — a downtrend. Traders should be aware of both the bullish and bearish signals before making any trading decisions.
FUNDAMENTAL ANALYSIS:
At this time, it's not clear what the future holds for USDCAD. The US dollar will do well if the economy is strong and interest rates go up. The Canadian dollar is being helped by a strong home market and rising oil prices. This is why the price action of USDCAD has been consolidating.
Factors affecting the USDCAD exchange rate are as follows:
(1) U.S. Interest Rates:
How interest rates are right now in the U.S. because of what the Federal Reserve does, interest rates are expected to keep going up in 2023. Buyers will want more USD, which will push the USDCAD exchange rate down.
(2) Canadian Interest Rates:
The Bank of Canada is also likely to raise rates in 2023. But the rate of growth is likely to be slower than in the United States. This could help the Canadian dollar get stronger and stop the USDCAD exchange rate from going down even more.
(3) Oil Costs:
The price of oil has never been this high. This is good news for Canada's economy and may help the value of the loonie stay the same. But if oil prices went down, the USDCAD exchange rate could be hurt.
(4) Canada's Housing Sector:
The home market in Canada is doing well right now. This is good news for Canada's economy and may help the value of the loonie stay the same. But the USDCAD could be hurt if the home market starts to slow down.

USDCAD Potential UpsidesHey Traders, in today's trading session we are monitoring USDCAD for a buying opportunity around 1.34900 zone, USDCAD is trading in an uptrend and currently seems to be in a correction phase in which it is approaching the major trend at 1.34900 support and resistance zone.
Trade safe, Joe.

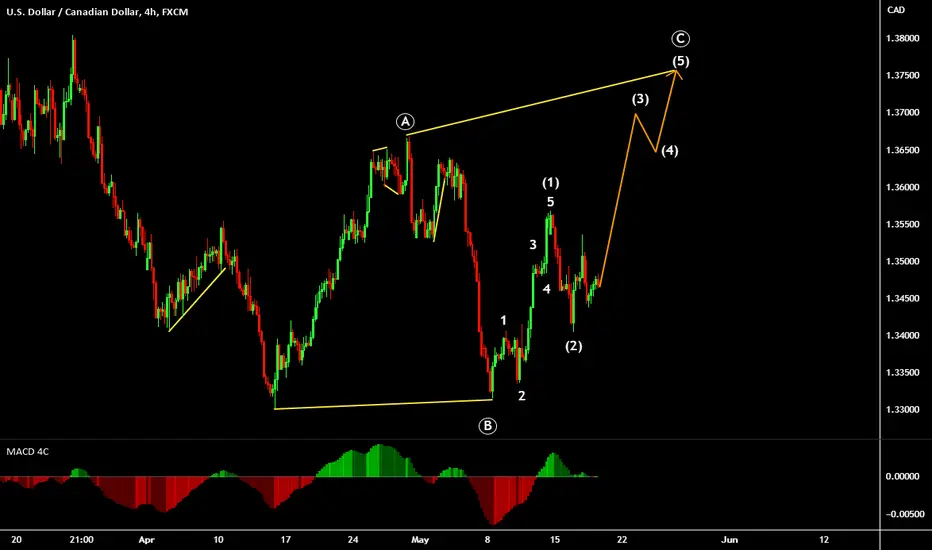
USDCAD Possible Price Action(5/15/2023)Hello Traders
After a 5-wave bearish impulse, It is possible that USD/CAD is forming the correction wave C.
But if the price breaks below the redline our view will be invalidated.
Our technical view has been shown in the chart.
If you like it then Support us by Like, Following, and Sharing.
Thanks For Reading
Team Fortuna
-RC
(Disclaimer: Published ideas and other Contents on this page are for educational purposes and do not include a financial recommendation. Trading is Risky, so before any action do your research.)

USDCAD, may attempt an upside reversal as a 'breather'.USDCAD, has corrected significantly from the 1.36 peak. And it looks like its eyeing to attempt to do a reversal to the upside as a breather wave before doing another correction.
an intraday quick opportunity.
Spotted at 1.335
TAYOR.
