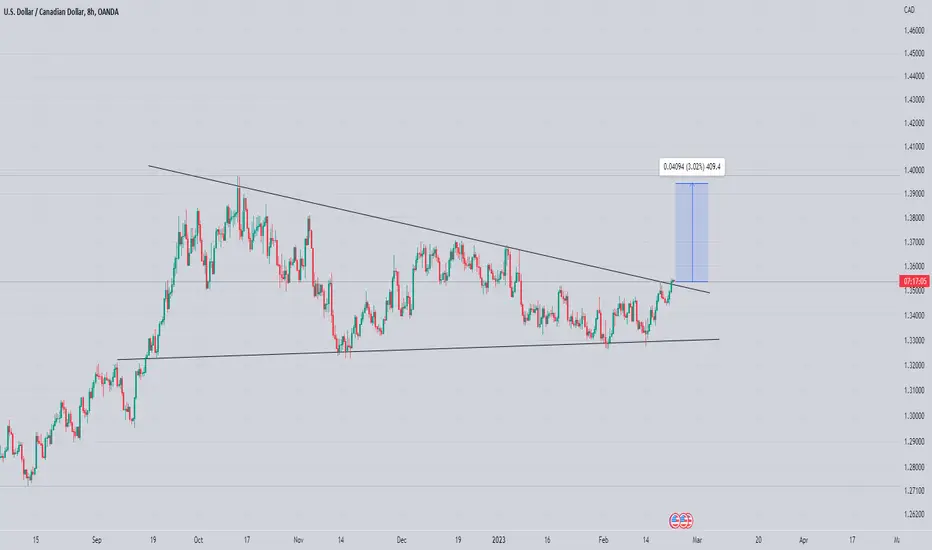
USDCAD Price Expected to Breakout UpwardThe USDCAD pair is in a long-term uptrend and is currently moving within a short-term triangle pattern. It has almost reached the end of the triangle pattern. I expect the price to break out of the triangle and continue its upward journey, with targets at 1.38200 and 1.39250.
-------------------------------------------------------------------------
Let me know your thoughts in the comments, and show your support by liking the idea.
Please follow if you're interested in more ideas like this.
Your support is greatly appreciated!
Usd-cad

USDCAD Sideways this year, surge in 2024.USDCAD has entered a 1 year consolidation phase following the 1week Golden Cross. It is following the 2019 pattern.
The RSI's of the the two periods also share similar patterns.
You will get many opportunities to buy low and sell high in that range this year buy you want to to ready to keep buys long term for the first two quarters of 2024 when the price will attempt another Resistance A test.
Follow us, like the idea and leave a comment below!!

USDCAD | DOES LOOK LIKE A GOOD BUY Hey Traders!
everyone It had that nice bullish pressure breaking past moving averages, lower timeframes are showing great candlestick formations to continue its bullish pressure. stoploss also covers all the moving averages makes it a little safer trade as well.

USDCAD - LONGSLooking into trading USDCAD, this pair has turned bullish on the intraday. At the moment this is a short term long. Im am expecting price to sweep past the most recent highs. Trade entry could trigger in the next few hours.
Entry time frame will be in the comments

USDCAD H4 | Potent Bearish Reversal Looking at the H4 chart, Price has reversed from the resistance level at 1.3706 which is overlap resistance. A reverse from this level, price could drop to the support level at 1.3663 along with a 38.2% Fibonacci retracement.
Any opinions, news, research, analyses, prices, other information, or links to third-party sites contained on this website are provided on an "as-is" basis, as general market commentary, and do not constitute investment advice. The market commentary has not been prepared in accordance with legal requirements designed to promote the independence of investment research, and it is therefore not subject to any prohibition on dealing ahead of dissemination. Although this commentary is not produced by an independent source, FXCM takes all sufficient steps to eliminate or prevent any conflicts of interest arising out of the production and dissemination of this communication. The employees of FXCM commit to acting in the clients' best interests and represent their views without misleading, deceiving, or otherwise impairing the clients' ability to make informed investment decisions. For more information about the FXCM's internal organizational and administrative arrangements for the prevention of conflicts, please refer to the Firms' Managing Conflicts Policy. Please ensure that you read and understand our Full Disclaimer and Liability provision concerning the foregoing Information, which can be accessed on the website.

Usdcad Analysis Forming Ascending Channel In h4 Timeframe
While Rsi Printed Massive Bearish divergence Incase Of Breakout Expecting 280 to 300 Pips Bearish Move

USD/CAD Fundamental + Technical Macroeconomic Update | 3.14.23Weaker dollar due to uncertainties about Federal Reserve policy and US banking sector
On Wednesday, the dollar index was trading around 103.5, which is near its lowest levels in a month. This happened because investors are unsure about the outlook for Federal Reserve monetary policy. They are also worried about recent turmoil in the US banking sector and the latest US inflation report. Some investors speculate that the Fed might pause its tightening campaign to avoid further risks to the financial system. Additionally, the annual inflation rate in the US slowed further to 6% in February, the lowest since September 2021. Money markets are now pricing an 80% chance of a 25 basis point rate hike from the Fed next week, lower than the half-percentage point increase expected a week ago.
Canadian dollar under selling pressure due to the Bank of Canada's decision
Investors are reacting to the end of the tightening cycle from the Bank of Canada, and the Canadian dollar is under selling pressure against the dollar. The Bank of Canada held the target for its overnight rate unchanged at 4.5% in March, as expected, and stated that they should keep it at the current level should economic conditions develop broadly in line with expectations. This is in contrast with the hawkish Federal Reserve, which sparked demand for the dollar. Fed Chair Jerome Powell told Congress that the central bank would likely need to raise rates more than expected in response to recent robust inflation and employment data.
Oil prices rebound as OPEC raises forecast for Chinese oil demand growth
Brent crude futures rose above $78 per barrel on Wednesday, rebounding from three-month lows as OPEC raised its forecast for Chinese oil demand growth in 2023. This is due to the country’s exit from the zero-Covid policy. However, the oil-producing group left its outlook for global demand unchanged, citing potential downside risks for global growth. On the supply side, Saudi Arabia energy minister Prince Abdulaziz bin Salman said OPEC+ will stick to production cuts agreed in October until the end of the year. The international oil benchmark remains down more than 5% this week due to the turmoil in the US banking sector and the prospect of another interest rate hike from the Federal Reserve next week. Investors now look ahead to IEA’s monthly report and official data on US crude inventories on Wednesday.
Investors reassess outlook for monetary policy and growth, driving down yields on Canadian government bonds
The yield on Canada's 10-year government bond eased to below 3%, a level not seen in a month, and is tracking its US peer lower as investors reassess the outlook for monetary policy and growth. Lingering concerns about a Fed-induced recession and the health of the US banking sector sparked demand for safe-haven assets, mainly government debt. Domestically, the Bank of Canada paused its rate-hike cycle at 4.5%, as previously signaled, after 425bps in rate increases during the last eight sessions. Policymakers noted that GDP growth was below expectations in the fourth quarter of 2022, emphasizing the need to support growth.

USDCADNow we are in a downward dynamic channel where the price has shown weakness near the middle line of the channel.
I predict that probably this weakness has the ability to reduce the price until near the bottom of the channel.
Oscillators also confirm this weakness, and this means reducing the market's tendency to increase the price.

USDCAD, an opportinity to go long.USDCAD / 4H
Hello traders, welcome back to another market breakdown.
Technical analysis: The USDCAD currency pair has been experiencing a bullish trend , with the price consistently breaking higher. Furthermore, on the monthly time frame, the price has rejected a major key level.
However, Today we have CPI data, we I'll be carefull with any setup based on Technical analysis.
The scenario I'm looking at:
Broken resistance becomes support.

USDCAD | POTENTIAL PULLBACK TRADE NOT GREAT BUT GOODHey Traders!
hey everyone its a pullback trade, much riskier than usual due to market current conditions, lower risk or skip this trade entirely, however, this trade does have a W formation on the weekly suggesting there might be a last pullback down off the resistance, we have space of around 40-50 pips until we reach the lower timeframe support, the markets are heavily overextended and there are no great setups to take, I like this one, but it's a good one, not a great one. ✅👍

USDCAD seems to resist the weekly trendHey Traders, USDCAD have attended an important weekly zone and now seems to be rejecting it. in tomorrow's trading session i will be watching a selling opportunity around 1.385 supply and demand zone at the trend, if CPI data on Tuesday comes above expectations i would expect a trend breakout as that signals more hawkish monetary policy and more of Dollar strength over commodities, if CPI comes soft i would set 1.34 as a target as it's considered the next major support zone USDCAD will be facing.
Trade safe, Joe.

USDCAD H4 | Potential Bearish Reversal Price is testing our resistance which we are looking for a sell entry at 1.3851, if price were to reverse from this level, we could see price drop to 1.3698 which is overlap support and stop loss will be at 1.3898
Any opinions, news, research, analyses, prices, other information, or links to third-party sites contained on this website are provided on an "as-is" basis, as general market commentary, and do not constitute investment advice. The market commentary has not been prepared in accordance with legal requirements designed to promote the independence of investment research, and it is therefore not subject to any prohibition on dealing ahead of dissemination. Although this commentary is not produced by an independent source, FXCM takes all sufficient steps to eliminate or prevent any conflicts of interest arising out of the production and dissemination of this communication. The employees of FXCM commit to acting in the clients' best interests and represent their views without misleading, deceiving, or otherwise impairing the clients' ability to make informed investment decisions. For more information about the FXCM's internal organizational and administrative arrangements for the prevention of conflicts, please refer to the Firms' Managing Conflicts Policy. Please ensure that you read and understand our Full Disclaimer and Liability provision concerning the foregoing Information, which can be accessed on the website.

Audcad showing signs Of strength Looks Promising for Bullish Move
forming falling wedge in h4 timeframe expecting upside breakout
incase of breakout expecting 220 to 240 pips bullish move

Usdcad Looks Ready For Bulish Impulse Over All Trend Is Bulish Recently Long Consolidation Of symmetrical Triangle Broken To the Upside
Expecting 300 to 320 Pips bulish move
How ever Fomc Minutes Are coming In Few hours Be careful With New Positions
USDCAD Outlook 9th March 2023Overnight, the Bank of Canada (BoC) released its decision to hold interest rates at the 4.50% level. This was in line with the overall market forecast.
However, the decision to hold rates saw the Canadian Dollar weaken (while the DXY remained on its bullish uptrend), resulting in the USDCAD claiming new highs, testing the 1.38 resistance area.
If the DXY gains further strength and breaks out to the upside, the USDCAD could first retrace briefly to test the upward trendline, before continuing to climb higher, with the next key resistance level at 1.39.
Alternatively, if the price action develops to signal a rejection of the 1.38 resistance level, the price could retrace down to the intermediate support level of 1.3740.

USDCAD H4 | 8th March Looking at the H4 chart, the price is respecting the ascending trendline. We are looking for a buy entry at 1.3805, which is a swing high. The stop loss level will be at 1.3855, and the take profit level will be at 1.3699, which is an overlap support level.
Any opinions, news, research, analyses, prices, other information, or links to third-party sites contained on this website are provided on an "as-is" basis, as general market commentary, and do not constitute investment advice. The market commentary has not been prepared in accordance with legal requirements designed to promote the independence of investment research, and it is therefore not subject to any prohibition on dealing ahead of dissemination. Although this commentary is not produced by an independent source, FXCM takes all sufficient steps to eliminate or prevent any conflicts of interest arising out of the production and dissemination of this communication. The employees of FXCM commit to acting in the clients' best interests and represent their views without misleading, deceiving, or otherwise impairing the clients' ability to make informed investment decisions. For more information about the FXCM's internal organizational and administrative arrangements for the prevention of conflicts, please refer to the Firms' Managing Conflicts Policy. Please ensure that you read and understand our Full Disclaimer and Liability provision concerning the foregoing Information, which can be accessed on the website.

USDCAD Potential downsidesHey Traders, USDCAD is approaching an important resistance zone at the top of the pattern, we will be considering a selling opportunity around 1.365 zone, USD environment is pricing too much strength in which we expect the market to go against retails. if we manage to get a dip below the pattern we will consider a retrace around 1.358 zone.
feel free to ask any question in the comment section.
Trade safe, Joe.

USD/CAD: BUY Signals in Uptrend Continuation For a LONG SetupHi there! This week is going to be important for the USD/CAD exchange rate, with several key events in the spotlight. The Bank of Canada Rate Decision, Nonfarm Payrolls, and Federal Reserve Chair Jerome Powell's testimony are all going to be closely watched.
So far, USD/CAD is up 0.11%, with a low of 1.3581 and a high of 1.3628. The Bank of Canada is expected to hold the overnight rate at 4.50% on Wednesday, and analysts think that the statement will note robust job growth but also acknowledge that inflation is still coming down.
Investors will be paying close attention to Powell's testimony and the jobs report to get a sense of how much the Federal Reserve will raise interest rates. The US Dollar index is down 0.2%, and there's a 76% chance of a 25 basis point increase at the Fed's meeting on March 22. Powell will likely indicate that more tightening is needed, but analysts expect him to be vague about the terminal rate. The Nonfarm Payrolls report is expected to show growth moderating to 220k, but leading indicators suggest that labor market conditions are still tight.
Overall, what Powell says and what the jobs report shows will be crucial for the direction of the US Dollar. The FOMC blackout period will begin on March 11, so the Fed still has the option to guide the markets after the jobs report.

USDCAD H4 | 7th march 2023If the price were to break the descending trendline, our 1st resistance area is 1.3665, and if it were to reverse from this level, it could potentially drop to 1.3519, where the 38.20% Fibonacci retracement which overlaps support is. The next support level after that is 1.3439.
As for the stop loss, it is recommended to place it slightly above the recent swing high at 1.3711. This could help minimize the risk in case the price moves against the expected direction.
Any opinions, news, research, analyses, prices, other information, or links to third-party sites contained on this website are provided on an "as-is" basis, as general market commentary, and do not constitute investment advice. The market commentary has not been prepared in accordance with legal requirements designed to promote the independence of investment research, and it is therefore not subject to any prohibition on dealing ahead of dissemination. Although this commentary is not produced by an independent source, FXCM takes all sufficient steps to eliminate or prevent any conflicts of interest arising out of the production and dissemination of this communication. The employees of FXCM commit to acting in the clients' best interests and represent their views without misleading, deceiving, or otherwise impairing the clients' ability to make informed investment decisions. For more information about the FXCM's internal organizational and administrative arrangements for the prevention of conflicts, please refer to the Firms' Managing Conflicts Policy. Please ensure that you read and understand our Full Disclaimer and Liability provision concerning the foregoing Information, which can be accessed on the website.

USDCAD Potential Forecast Post-Ivey PMI | 7th March 2023Fundamental Backdrop
1. The Ivey PMI which is a leading indicator of economic health released dropping from 60.1 to 51.6.
2. This indicates that the industry is contracting.
3. Showing a decrease in business activity and confidence in the Canadian economy.
Technical Confluences
1. Price recently bounced off the 1.35700 support level which coincides with the 23.6% Fibonacci line.
2. Near term resistance at 1.36800
Idea
With the Ivey PMI result released worst than previous, expect price to head towards the near term resistance at 1.36800
NOT FINANCIAL ADVICE DISCLAIMER
The trading related ideas posted by OlympusLabs are for educational and informational purposes only and should not be considered as financial advice. Trading in financial markets involves a high degree of risk, and individuals should carefully consider their investment objectives, financial situation, and risk tolerance before making any trading decisions based on our ideas.
We are not a licensed financial advisor or professional, and the information we are providing is based on our personal experience and research. We make no guarantees or promises regarding the accuracy, completeness, or reliability of the information provided, and users should do their own research and analysis before making any trades.
Users should be aware that trading involves significant risk, and there is no guarantee of profit. Any trading strategy may result in losses, and individuals should be prepared to accept those risks.
OlympusLabs and its affiliates are not responsible for any losses or damages that may result from the use of our trading related ideas or the information provided on our platform. Users should seek the advice of a licensed financial advisor or professional if they have any doubts or concerns about their investment strategies.

USDCAD | COULD BE A GOOD BUY, MAYBE?Hey Traders!
USDCAD has been in this channel for a while, we just need a candlestick confirmation to enter the trade long, look for entry maybe on the 1h timeframe, if good price action you could enter and aim for the channel top to max pip gains.

USDCADUSDCAD has been examined in different dimensions:
1- Strong supply and demand levels that I identify with my own indicator and system.
2- The structure of recently formed waves
3- Current market momentum
4- The structure of classical and price patterns
In this idea, I identified the direction of the market in different ways and in the second step, I analyzed the potential of continuation or reversal. Usually, paying attention to the trend and strength of the trend can greatly increase the accuracy of the analysis.
In general, I tried to describe the continuation of the movement in the simplest possible way in the diagram.
⚠️ Disclaimer:
This is a personal opinion and you are responsible for any trading decisions.

USDCAD Potential Forecast Pre-Ivey PMI | 6th March 2023Fundamental Backdrop
1. The Ivey PMI is going to be released at 11pm SGT
2. It's a leading indicator of economic health
3. The result is expected to be worst than previous, weakening CAD
Technical Confluences
1. Price recently bounced off the 1.35700 support level which coincides with the 23.6% Fibonacci line.
Idea
If the Ivey PMI result released is worst than previous, expect price to head towards the resistance at 1.36850.
Alternatively, price could head back down towards the 1.35700 support level coincides with the 23.6% Fibonacci line.
NOT FINANCIAL ADVICE DISCLAIMER
The trading related ideas posted by OlympusLabs are for educational and informational purposes only and should not be considered as financial advice. Trading in financial markets involves a high degree of risk, and individuals should carefully consider their investment objectives, financial situation, and risk tolerance before making any trading decisions based on our ideas.
We are not a licensed financial advisor or professional, and the information we are providing is based on our personal experience and research. We make no guarantees or promises regarding the accuracy, completeness, or reliability of the information provided, and users should do their own research and analysis before making any trades.
Users should be aware that trading involves significant risk, and there is no guarantee of profit. Any trading strategy may result in losses, and individuals should be prepared to accept those risks.
OlympusLabs and its affiliates are not responsible for any losses or damages that may result from the use of our trading related ideas or the information provided on our platform. Users should seek the advice of a licensed financial advisor or professional if they have any doubts or concerns about their investment strategies.
