USDCAD LongHey traders, in today's trading session we are monitoring USDCAD for a buying opportunity around 1.35900 zone, once we will receive any bullish confirmation the trade will be executed.
Trade safe, Joe.
Usd-cad


USDCAD stong bullish expectations
Hi viewers, price breaked zone, here bullish trend cont. expected
TP1: 1.38000 (100)
TP2: 1.38500 (150)

InvestMate|USD/CAD Ready For New Local Highs🍁🍁USD/CAD Ready For New Local Highs
🍁As I wrote yesterday I expect the upward movement to continue:
🍁There was a beautiful realisation of my upward scenario today.
🍁We found local resistance at 0.618 of the entire downward wave.
🍁Looking at another attempt to break through this level and the dynamics of the candles the breakthrough looks very likely.
🍁Looking at the fact that we are above both 50 and 200 moving averages and the MACD and RSI are generating further upward signals, I have no doubts about the continuation of the upward movement.
🍁The nearest resistance zone is the level of 0.786 of the entire downward wave from the last peak. There may be some reaction there.
🍁The support zone is around the 0.5 level of the same wave
🍁The main target set in the previous post remains unchanged
🍁The scenario I am playing out is a continuation of the upward trend. I'm aware of the possibility of a correction at any time, this should be taken into account, If the outlook changes I will publish a post with an update, so I encourage you to actively follow the profile and read the description carefully.
🚀If you appreciate my work and effort put into this post then I encourage you to leave a like and give a follow on my profile.🚀

USDCAD Resistance test and then Sell.The USDCAD couldn't have confirmed our bearish view two months ago, when we called for a sell opportunity based on the RSI Bearish Divergence (Lower Highs against the price's Higher Highs):
As you see the divergence sell signal was spot on and the previous two times that this was spotted, helped us in a great way to spot this. Right now the price again above its 1D MA50 (blue trend-line) and based on the fractal, as long as it stays above the 1D MA50, it will approach the 1.39860 High. A Double Top there, will confirm all previous three sequences which got rejected on their previous High and hit at least the 1D MA200 (orange trend-line). The max extension on that pull-back is the 0.786 Fibonacci retracement level.
Notice how the RSI Higher Lows trend-line offers Support and the best buy entry in the past 12 months.
-------------------------------------------------------------------------------
** Please LIKE 👍, SUBSCRIBE ✅, SHARE 🙌 and COMMENT ✍ if you enjoy this idea! Also share your ideas and charts in the comments section below! This is best way to keep it relevant, support me, keep the content here free and allow the idea to reach as many people as possible. **
-------------------------------------------------------------------------------
You may also TELL ME 🙋♀️🙋♂️ in the comments section which symbol you want me to analyze next and on which time-frame. The one with the most posts will be published tomorrow! 👏🎁
-------------------------------------------------------------------------------
💸💸💸💸💸💸
👇 👇 👇 👇 👇 👇

InvestMate|USD/CAD Not Giving Up🍁🍁USD/CAD Not Giving Up
🍁The scenario since my last post remains unchanged:
🍁Looking at the behaviour of the USD/CAD price in recent days.
🍁We could call it indecisiveness mixed with a desire to continue upwards.
🍁Following yesterday's 50 basis point interest rate hike in the US, investors in the market resumed the strengthening of the US dollar.
🍁Given that there is no sign of a continuation of the trajectory of interest rate rises ahead. I was surprised to see such a sharp reaction of dollar strengthening.
🍁But in the case of the pair, the main ingredient for the increases is the weak Canadian dollar in recent months.
🍁Looking at the fact that we are above the 50 and 200 period moving average and the MACD and RSI are presenting very bullish signals I have no doubts about the price direction.
🍁The upside scenario remains unchanged, I expect the uptrend to continue. I'm aware of the possibility of a correction at any time, this should be taken into account, If the outlook changes I will publish a post with an update, so I encourage you to actively follow the profile and read the description carefully.
🚀If you appreciate my work and effort put into this post then I encourage you to leave a like and give a follow on my profile.🚀

USDCAD: Weak USD and bear flag patternHey traders, in today's trading session we are monitoring USDCAD for a selling opportunity around 1.354 zone, once we will receive any bearish confirmation the trade will be executed.
Trade safe, Joe.

USDCAD time to retrace? 🦐USDCAD on the 4h chart after the last impulse has tested the 1.37 area.
The price couldn't create new highs and we can expect some retracement at least to the 0.5 Fibonacci level.
How can i approach this scenario?
IF the price will break below the support area i will look for a nice short order according to the Plancton's strategy rules.
--––
Follow the Shrimp 🦐
Keep in mind.
🟣 Purple structure -> Monthly structure.
🔴 Red structure -> Weekly structure.
🔵 Blue structure -> Daily structure.
🟡 Yellow structure -> 4h structure.
⚫️ Black structure -> <4h structure.
Here is the Plancton0618 technical analysis , please comment below if you have any question.
The ENTRY in the market will be taken only if the condition of the Plancton0618 strategy will trigger

USD/CAD:SELL From Resistance Area For A New SHORT SetupUSD/CAD after the bad news released yesterday for the USD today the Markets will have another strong shaking by the release of FOMC Economic Projections, USD FOMC Statement, USD Federal, and the USD FOMC Press Conference. The bias is about a new bearish impulse for the USD and a Growing for all the EUR pairs and correlated. Technically the USD/CAD it's inside a new Bearish trend and the price is around a strong Resistance area. Price may continue to follow the trend and have another bearish impulse.
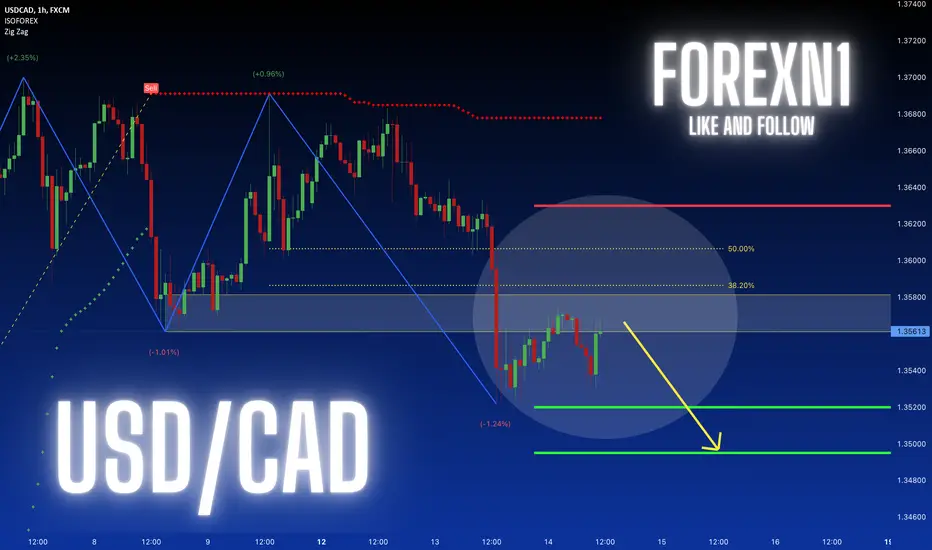
USDCAD - Selling ralliesUSDCAD - Intraday - We look to Sell at 1.3600 (stop at 1.3700)
Previous support located at 1.3500. Previous resistance located at 1.3600. Broken out of the triangle formation to the downside. Risk/Reward would be poor to call a sell from current levels.
Our profit targets will be 1.3400 and 1.3350
Resistance: 1.3600 / 1.3650 / 1.3700
Support: 1.3500 / 1.3400 / 1.3350
Please be advised that the information presented on TradingView is provided to Vantage (‘Vantage Global Limited’, ‘we’) by a third-party provider (‘Signal Centre’). Please be reminded that you are solely responsible for the trading decisions on your account. There is a very high degree of risk involved in trading. Any information and/or content is intended entirely for research, educational and informational purposes only and does not constitute investment or consultation advice or investment strategy. The information is not tailored to the investment needs of any specific person and therefore does not involve a consideration of any of the investment objectives, financial situation or needs of any viewer that may receive it. Kindly also note that past performance is not a reliable indicator of future results. Actual results may differ materially from those anticipated in forward-looking or past performance statements. We assume no liability as to the accuracy or completeness of any of the information and/or content provided herein and the Company cannot be held responsible for any omission, mistake nor for any loss or damage including without limitation to any loss of profit which may arise from reliance on any information supplied by Signal Centre.

USDCAD Potential downsidesHey traders, in the coming week we are monitoring USDCAD for a selling opportunity around 1.36800 zone, once we will receive any bearish confirmation the trade will be executed.
Trade safe, Joe.

🍁USD/CAD Continued Increases Ahead🍁USD/CAD Continued Increases Ahead.
🍁Post is a direct continuation of the last post:
🍁Nothing has changed on the chart.
🍁The price is still struggling at the 0.618 level to break out above this resistance.
🍁I still think that the way to the resistance zone remains open and we will see further upside within a few weeks.
🍁The scenario I am playing out is a continuation of the upside to the resistance zone. I'm aware of the possibility of a correction at any time, this should be taken into account, If the outlook changes I will publish a post with an update, so I encourage you to actively follow the profile and read the description carefully.
🍁*Please do not suggest the path I have outlined with lines it is only a hypothetical scenario.
🚀If you appreciate my work and effort put into this post then I encourage you to leave a like and give a follow on my profile.🚀

USD/CAD:SELL From Pullback Neckline Head & Shoulders SHORT SetupUSD/CAD shows a Reversal Head and Shoulder in a lower timeframe with a pullback on the dynamic Neckline of the pattern and the price following the negative correlation with EUR/USD today is falling down. If the economic USD data about the Core PPI m/m and PPI m/m will negative, we will see an interesting short in this pair.

USDCAD Re-entryUSD seems to be falling as CAD gains strength we can look for sells from the supply zone and target minimum 1:5 RR

USDCAD Short Position IdeaUSDCAD has formed a new LH on the 4H timeframe with double top & bearish Divergence on the 1H timeframe which is a clear bearish indication,
which means it's time for the downward move to make LL.
Bearish Signals:
Strong Resistance at 1.36945 Level
Strong Bearish Divergence on 1H TF
Break of structure on shorter TF

InvestMate|USD/CAD Still on the rise🍁🍁USD/CAD Still on the rise.
🍁That's as I wrote last time. USD/CAD in my opinion has really strong upside potential in the next few weeks.
🍁 Looking at how today's daily candle looks. It's not hard not to get the impression that green days are ahead.
🍁 All thanks to a bounce from a strong support zone and a retest.
🍁 The support zone was determined by a cluster of two fibo levels.
The first is the 0.5 level of the entire downward wave from the 2016 peak to the 2021 bottom. The second is the 0.236 level of the entire upward wave from the 2007 bottom to the 2016 peak.
🍁 There is also a strong resistance zone defined above the recent peaks. It was determined by a cluster of two fibo levels. The first is the 0.786 level of the entire downward wave from the 2016 peak to the 2021 bottom. The second is the outer level of the 1.272 level of the entire downward wave from the 2009 peak to the 2011 bottom.
🍁This is where I expect a strong price reaction.
🍁The scenario I'm playing out is a continuation of the upside and a breakout to new highs. I'm aware of the possibility of a correction at any time, this should be taken into account, If the outlook changes I will publish a post with an update, so I encourage you to actively follow the profile and read the description carefully.
🍁*Please do not suggest the path I have outlined with lines it is only a hypothetical scenario.
🚀If you appreciate my work and effort put into this post then I encourage you to leave a like and give a follow on my profile.🚀

USDCAD a turn at the 0.618 Fibonacci 🦐USDCAD on the 4h chart after the recent low retraced over the weekly structure at the 0.618 Level.
The market is now trading above the support and according to Plancton's strategy IF the price will break below we will set a nice short order according to Plancton's strategy rules.
--––
Follow the Shrimp 🦐
Keep in mind.
🟣 Purple structure -> Monthly structure.
🔴 Red structure -> Weekly structure.
🔵 Blue structure -> Daily structure.
🟡 Yellow structure -> 4h structure.
⚫️ Black structure -> <4h structure.
Here is the Plancton0618 technical analysis , please comment below if you have any question.
The ENTRY in the market will be taken only if the condition of the Plancton0618 strategy will trigger

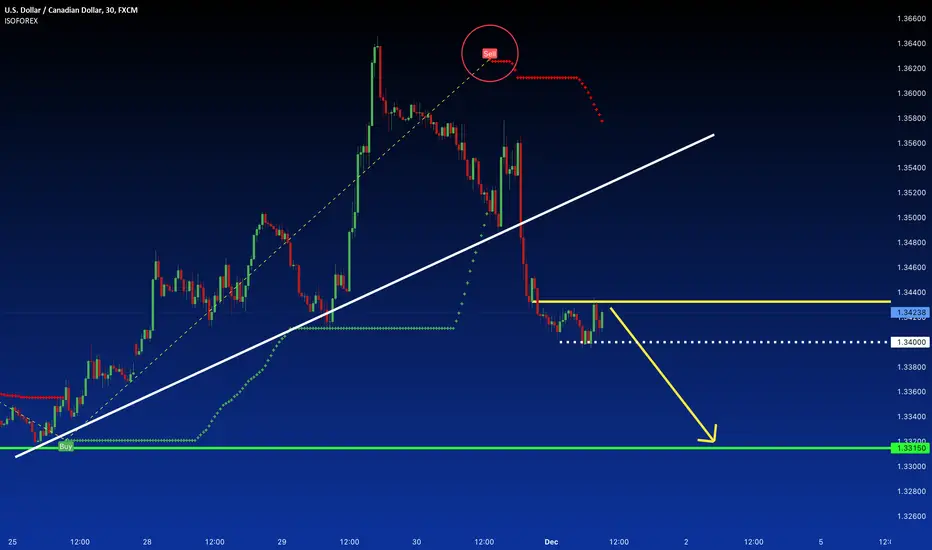
USD/CAD:SELL Setup In Bearish Channel Looking for a SHORT tradeUSD/CAD Inside a Bearish channel in the last sessions breaks the dynamic trendline of the bear flag after the rebound on the 61.8% Fibonacci level forming a potential AB=CD pattern. Our forecast is for a SHORT setup waiting for the today's release news about the USD ISM Services PMI

USD/CAD:SELL From Bearish Trend With 1.3400 Level Breakout SHORTUSD/CAD in the last session the price made a corrective movement in the bearish side of the chart thanks to the negative economic news effect on the USD as the Numbers of job openings during the reported month, the JOLTS Job Openings and the negative ADP Non-Farm Employment Change. Today the price may Break the support level at 1.3400 and continue its bearish momentum with another bearish impulse.
Buy Zone USD CADI've been following USD/Cad this week and it made a big drop. Price is currently at a major support level and is valid to say it's touching the uptrend line. Should see a pullback, A keynote is the RSI is oversold and crossing on the 1HR Timeframe. I'm going to aim for the 61.8 fib level as the TP Zone and will adjust Stop Loss as price progresses.

InvestMate|USD/CAD Opportunity for growth🍁🍁USD/CAD Opportunity for growth
🍁It's hard not to acknowledge the fact that USD/CAD has shown strength in recent days.
🍁 Breaking out of the support zone heading towards a strong resistance zone then making a correction.
🍁I still think we have a lot of space for upside.
🍁Turning to the chart.
🍁Looking at the breakout dynamics in the last few days and the strong selling interest in the Canadian dollar. It just confirms me in my upside scenario.
🍁 Particularly the 29th price move surprised investors by performing a whole 1.77% upside move measured from daily low to high.
🍁I determined the support zone based on a cluster of two fibo measures. The first is the level of 0.236 of the entire upward wave from the 2011 bottom to the 2016 peak. The second level is 0.618 of the entire downward wave from the 2002 peak to the 2007 bottom.
🍁 The resistance zone ahead was also determined by a cluster of two fibo levels. The first is 0.618 of the entire downward wave from the peak in 2016 to the bottom in 2021. The second level is the 0.5 level of the entire upward wave from the 1991 bottom to the 2002 peak.
🍁The scenario I am playing out on this pair is a continuation of the upside to the area around the resistance zone. Where I will watch to see how the price will react in order to predict the next movements. I am aware of the possibility of a correction at any time, this should be taken into account, If the outlook would change I will publish a post with an update, so I encourage you to actively follow the profile and read the description carefully.
🍁 *Please do not suggest the path I have drawn with the lines this is only a hypothetical scenario.
🚀If you appreciate my work and effort put into this post I encourage you to leave a like and give a follow on my profile.🚀

USDCAD | Looks like a pretty good BUYHello Traders,
USDCAD looks like a decent buy, a nice little rejection to the moving averages on the 4h timeframe with a 1h bullish engulfing candlestick closure.
All timeframes are trending toward the upside as well which shows bullish pressure.
High impact speech coming up later on today, make sure to manage your risk, peace! :)

USDCAD | IF WE GET A PULLBACK THEN...Hello traders,
If we manage to get a pullback after such a parabolic move towards the upside and break the 200 moving average on the 4h
This trade has potential to move towards the upside much more.
I suggest waiting on this one for some rejection before considering to enter the market :)
