USDCAD Potential for Bearish ContinuationOn H4, with the price moving below ichimoku cloud and showing a shoulder head pattern, we have a bearish bias that the price may drop from the sell entry at 1.33913 to the taker profit at 1.29511, where the 78.6% fibonacci retracement and previous swing highs are. Alternatively, the price may rise to the stop loss at 1.35687, where the 50% fibonacci retracement is.
Please be advised that the information presented on TradingView is provided to Vantage (‘Vantage Global Limited’, ‘we’) by a third-party provider (‘Everest Fortune Group’). Please be reminded that you are solely responsible for the trading decisions on your account. There is a very high degree of risk involved in trading. Any information and/or content is intended entirely for research, educational and informational purposes only and does not constitute investment or consultation advice or investment strategy. The information is not tailored to the investment needs of any specific person and therefore does not involve a consideration of any of the investment objectives, financial situation or needs of any viewer that may receive it. Kindly also note that past performance is not a reliable indicator of future results. Actual results may differ materially from those anticipated in forward-looking or past performance statements. We assume no liability as to the accuracy or completeness of any of the information and/or content provided herein and the Company cannot be held responsible for any omission, mistake nor for any loss or damage including without limitation to any loss of profit which may arise from reliance on any information supplied by Everest Fortune Group.
Usd-cad

USDCAD SELLGood evening traders. Dont forget comments, and thumbs up, if you like idea.
Can open sell order from: 1.34800 - 1.35500
Sell Zone: 1.34800 - 1.35500
Target zone: 1.31500
DISCLAIMER:
The opinion of the author may not coincide with yours! Keep this in mind and consider in your trading transactions before making a trading decision.

USDCAD - Video Top-Down Analysis!Hello TradingView Family / Fellow Traders. This is Richard, as known as theSignalyst.
Here is a detailed update top-down analysis for USDCAD .
Which scenario do you think is more likely to happen? and Why?
Always follow your trading plan regarding entry, risk management, and trade management.
Good Luck!.
All Strategies Are Good; If Managed Properly!
~Rich

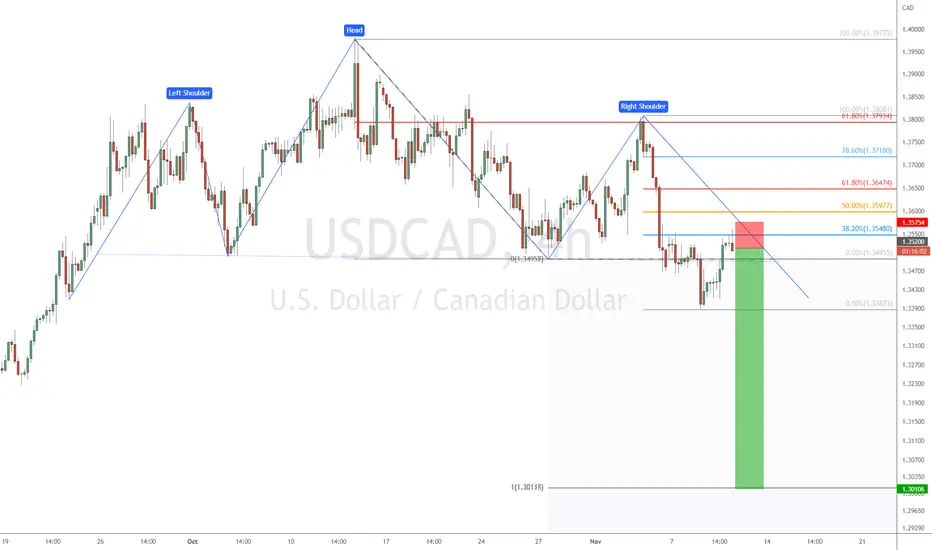
Joe Gun2Head Trade - Head and shoulders top on USDCADTrade Idea: Selling USDCAD
Reasoning: Head and shoulders top on USDCAD
Entry Level: 1.3520
Take Profit Level: 1.3010
Stop Loss: 1.3575
Risk/Reward: 9.19:1
Disclaimer – Signal Centre. Please be reminded – you alone are responsible for your trading – both gains and losses. There is a very high degree of risk involved in trading. The technical analysis , like all indicators, strategies, columns, articles and other features accessible on/though this site is for informational purposes only and should not be construed as investment advice by you. Your use of the technical analysis , as would also your use of all mentioned indicators, strategies, columns, articles and all other features, is entirely at your own risk and it is your sole responsibility to evaluate the accuracy, completeness and usefulness (including suitability) of the information. You should assess the risk of any trade with your financial adviser and make your own independent decision(s) regarding any tradable products which may be the subject matter of the technical analysis or any of the said indicators, strategies, columns, articles and all other features.
USDCAD Potential For Bearish ContinuationOn H4, with the price moving below ichimoku cloud and showing a shoulder head pattern, we have a bearish bias that the price may drop from the sell entry at 1.34855, which is in line with 23.6% fibonacci retracement and neckline of shoulder head pattern to the taker profit at 1.32120, where the 61.8% fibonacci retracement and previous swing highs are. Alternatively, the price may rise to the stop loss at 1.35928, where the 50% fibonacci retracement is.
Please be advised that the information presented on TradingView is provided to Vantage (‘Vantage Global Limited’, ‘we’) by a third-party provider (‘Everest Fortune Group’). Please be reminded that you are solely responsible for the trading decisions on your account. There is a very high degree of risk involved in trading. Any information and/or content is intended entirely for research, educational and informational purposes only and does not constitute investment or consultation advice or investment strategy. The information is not tailored to the investment needs of any specific person and therefore does not involve a consideration of any of the investment objectives, financial situation or needs of any viewer that may receive it. Kindly also note that past performance is not a reliable indicator of future results. Actual results may differ materially from those anticipated in forward-looking or past performance statements. We assume no liability as to the accuracy or completeness of any of the information and/or content provided herein and the Company cannot be held responsible for any omission, mistake nor for any loss or damage including without limitation to any loss of profit which may arise from reliance on any information supplied by Everest Fortune Group.

USDCAD Potential for Bearish ContinuationOn H4, with the price moving below ichimoku cloud and showing a shoulder head pattern, we have a bearish bias that the price may drop from the sell entry at 1.34855, which is in line with 23.6% fibonacci retracement and neckline of shoulder head pattern to the taker profit at 1.32120, where the 61.8% fibonacci retracement and previous swing highs are. Alternatively, the price may rise to the stop loss at 1.35928, where the 50% fibonacci retracement is.
Please be advised that the information presented on TradingView is provided to Vantage (‘Vantage Global Limited’, ‘we’) by a third-party provider (‘Everest Fortune Group’). Please be reminded that you are solely responsible for the trading decisions on your account. There is a very high degree of risk involved in trading. Any information and/or content is intended entirely for research, educational and informational purposes only and does not constitute investment or consultation advice or investment strategy. The information is not tailored to the investment needs of any specific person and therefore does not involve a consideration of any of the investment objectives, financial situation or needs of any viewer that may receive it. Kindly also note that past performance is not a reliable indicator of future results. Actual results may differ materially from those anticipated in forward-looking or past performance statements. We assume no liability as to the accuracy or completeness of any of the information and/or content provided herein and the Company cannot be held responsible for any omission, mistake nor for any loss or damage including without limitation to any loss of profit which may arise from reliance on any information supplied by Everest Fortune Group.


USDCAD Potential For Bearish ContinuationOn H4, with the price moving below ichimoku cloud and showing a shoulder head pattern, we have a bearish bias that the price may drop from the sell entry at 1.35002, which is in line with 38.2% fibonacci retracement and neckline of shoulder head pattern to the taker profit at 1.32120, where the 61.8% fibonacci retracement and previous swing highs are. Alternatively, the price may rise to the stop loss at 1.36793, where the 61.8% fibonacci retracement is.
Please be advised that the information presented on TradingView is provided to Vantage (‘Vantage Global Limited’, ‘we’) by a third-party provider (‘Everest Fortune Group’). Please be reminded that you are solely responsible for the trading decisions on your account. There is a very high degree of risk involved in trading. Any information and/or content is intended entirely for research, educational and informational purposes only and does not constitute investment or consultation advice or investment strategy. The information is not tailored to the investment needs of any specific person and therefore does not involve a consideration of any of the investment objectives, financial situation or needs of any viewer that may receive it. Kindly also note that past performance is not a reliable indicator of future results. Actual results may differ materially from those anticipated in forward-looking or past performance statements. We assume no liability as to the accuracy or completeness of any of the information and/or content provided herein and the Company cannot be held responsible for any omission, mistake nor for any loss or damage including without limitation to any loss of profit which may arise from reliance on any information supplied by Everest Fortune Group.

USDCAD range bound unless it breaks...The USDCAD is currently consolidating at the 1.35 price level following the significant reversal from the 1.38 resistance level.
Canadian employment data on Friday signaled an improving job market which added strength to the Canadian dollar.
If the USDCAD breaks below the 1.3470 price level, a continuation of the downtrend can be expected, with the next key support level at 1.3250.
Alternatively, if the USDCAD bounces strongly from the current level, the USDCAD could continue to fluctuate between the price levels of 1.35 and 1.38.

USDCAD Potential UpsidesHey traders, in today's trading session we are monitoring USDCAD for a buying opportunity around 1.338 zone, once we will receive any bullish confirmation the trade will be executed.
Trade safe, Joe.

USDCAD - SHORT SETUP UPDATE!USDCAD played out well and dropped down over 300pips from our POI (Point of Interest).

UC bearish trend confirmation?
Hello viewers, nonfarm event is change situation which i am expect to happens, here now bearish cont is expected. Techncially picture looks strong bearish.
TP1: 1.34500 (110)
TP2: 1.33500 (210)
TP3: 1.32500 (310)

USDCAD Potential For Bullish RiseOn H4, with the price breaking the ichimoku cloud , we have a bullish bias that the price may rise from the buy entry at 1.36840, which is in line with the overlap support to the take profit at 1.39717, where the previous swing high is. Alternatively, the price may drop to the stop loss at 1.35072, where the swing lows are.
Please be advised that the information presented on TradingView is provided to Vantage (‘Vantage Global Limited’, ‘we’) by a third-party provider (‘Everest Fortune Group’). Please be reminded that you are solely responsible for the trading decisions on your account. There is a very high degree of risk involved in trading. Any information and/or content is intended entirely for research, educational and informational purposes only and does not constitute investment or consultation advice or investment strategy. The information is not tailored to the investment needs of any specific person and therefore does not involve a consideration of any of the investment objectives, financial situation or needs of any viewer that may receive it. Kindly also note that past performance is not a reliable indicator of future results. Actual results may differ materially from those anticipated in forward-looking or past performance statements. We assume no liability as to the accuracy or completeness of any of the information and/or content provided herein and the Company cannot be held responsible for any omission, mistake nor for any loss or damage including without limitation to any loss of profit which may arise from reliance on any information supplied by Everest Fortune Group.

USDCAD - SHORT SETUP UPDATE!Please this is not a financial advise rather its an aid to point you to the possible direction!

USDCAD Potential For Bullish RiseOn H4, with the price breaking the ichimoku cloud, we have a bullish bias that the price may rise from the sell entry at 1.36840, which is in line with the overlap support to the take profit at 1.38775, where the 78.6% fibonacci retracement is. Alternatively, the price may drop to the stop loss at 1.35072, where the swing lows are.
Please be advised that the information presented on TradingView is provided to Vantage (‘Vantage Global Limited’, ‘we’) by a third-party provider (‘Everest Fortune Group’). Please be reminded that you are solely responsible for the trading decisions on your account. There is a very high degree of risk involved in trading. Any information and/or content is intended entirely for research, educational and informational purposes only and does not constitute investment or consultation advice or investment strategy. The information is not tailored to the investment needs of any specific person and therefore does not involve a consideration of any of the investment objectives, financial situation or needs of any viewer that may receive it. Kindly also note that past performance is not a reliable indicator of future results. Actual results may differ materially from those anticipated in forward-looking or past performance statements. We assume no liability as to the accuracy or completeness of any of the information and/or content provided herein and the Company cannot be held responsible for any omission, mistake nor for any loss or damage including without limitation to any loss of profit which may arise from reliance on any information supplied by Everest Fortune Group.

USDCAD Potential For Bearish ContinuationOn H4, with the price moving below ichimoku cloud and descending trendline, as well as showing a shoulder head pattern, we have a bearish bias that the price may drop form the sell entry at 1.35519, which is in line with the previous swing low to the take profit at 1.32135 where the 61.8% fibonacci retracement is. Alternatively, the price may rise to the stop loss at 1.36843, which is in line with the 38.2% fibonacci retracement .
Please be advised that the information presented on TradingView is provided to Vantage (‘Vantage Global Limited’, ‘we’) by a third-party provider (‘Everest Fortune Group’). Please be reminded that you are solely responsible for the trading decisions on your account. There is a very high degree of risk involved in trading. Any information and/or content is intended entirely for research, educational and informational purposes only and does not constitute investment or consultation advice or investment strategy. The information is not tailored to the investment needs of any specific person and therefore does not involve a consideration of any of the investment objectives, financial situation or needs of any viewer that may receive it. Kindly also note that past performance is not a reliable indicator of future results. Actual results may differ materially from those anticipated in forward-looking or past performance statements. We assume no liability as to the accuracy or completeness of any of the information and/or content provided herein and the Company cannot be held responsible for any omission, mistake nor for any loss or damage including without limitation to any loss of profit which may arise from reliance on any information supplied by Everest Fortune Group.

USDCAD SHORT POSITIONOnce again another best trade entry to bearish zone its move from HL & HH to HL & LL. short after the price reach the HL

USDCAD Potential For Bearish ContinuationOn H4, with the price moving below ichimoku cloud and showing a shoulder head pattern , we have a bearish bias that the price may drop form the sell entry at 1.35518, which is in line with the previous swing low to the take profit at 1.33537 where the 61.8% fibonacci retracement is. Alternatively, the price may rise to the stop loss at 1.37981, which is in line with the 61.8% fibonacci retracement .
Please be advised that the information presented on TradingView is provided to Vantage (‘Vantage Global Limited’, ‘we’) by a third-party provider (‘Everest Fortune Group’). Please be reminded that you are solely responsible for the trading decisions on your account. There is a very high degree of risk involved in trading. Any information and/or content is intended entirely for research, educational and informational purposes only and does not constitute investment or consultation advice or investment strategy. The information is not tailored to the investment needs of any specific person and therefore does not involve a consideration of any of the investment objectives, financial situation or needs of any viewer that may receive it. Kindly also note that past performance is not a reliable indicator of future results. Actual results may differ materially from those anticipated in forward-looking or past performance statements. We assume no liability as to the accuracy or completeness of any of the information and/or content provided herein and the Company cannot be held responsible for any omission, mistake nor for any loss or damage including without limitation to any loss of profit which may arise from reliance on any information supplied by Everest Fortune Group.

USD CAD - FUNDAMENTAL DRIVERSUSD
FUNDAMENTAL OUTLOOK: BULLISH
BASELINE
With headline CPI above 8% and Core CPI seeing another acceleration in the SEP CPI data, the Fed is under pressure to continue hiking rates and ramping up QT. Markets expect another 75bsp hike in NOV and currently prices the terminal rate at 4.89%. The Fed is on a data-dependent (meeting-by-meeting) policy stance, meaning incoming growth, inflation and jobs data remains a key driver for short-term USD volatility where we expect a cyclical reaction with incoming data for both the USD and US10Y (good data expected to be supportive for the USD while bad data is expected to pressure the USD). Our expectation for a softer USD this past week played to our advantage with a punchy move lower in the Dollar. The week ahead is filled with lots of US economic data and the FOMC policy decision which will all be important drivers for the USD.
POSSIBLE BULLISH SURPRISES
With the Fed signalling a data dependent policy stance, we expect a cyclical reaction from the USD with incoming US data. Thus, extremely good growth, inflation or jobs data is expected to trigger short-term bullish reactions in the USD. If the cyclical outlook continues to weaken, the USD’s safe haven status still matters. Any incoming catalysts that increase deep recession fears and triggers strong moves lower in risk assets & bonds can trigger safe haven flows into the USD. With a lot priced for the Fed and USD, the bar is high for hawkish Fed surprises, but any aggressive Fed speak talking up a >5.0% terminal rate can trigger further USD upside.
POSSIBLE BEARISH SURPRISES
With the Fed signalling a data dependent policy stance, we expect a cyclical reaction from the USD with incoming US data. Thus, extremely bad growth, inflation or jobs data is expected to trigger short-term bearish reactions in the USD. If the cyclical outlook starts to improve, the USD’s safe haven status still matters. Any incoming catalysts that decrease deep recession fears and triggers strong moves higher in risk assets & bonds can trigger safe haven outflows out of the USD. With a lot priced in for the Fed and the USD, it won’t take much to disappoint on the dovish side. Any big concerns about growth from Fed speakers could trigger outflows.
BIGGER PICTURE
The fundamental outlook for the USD remains bullish as long as the Fed stays hawkish and cyclical concerns put pressure on risk sentiment. The data dependent stance from the Fed means that short-term data surprises can pull the USD either way and would be our preferred way of trading the Dollar right now. We have a very excited economic calendar for the US in the week ahead, with lots of important economic data and the FOMC meeting. For the econ data our expectation is for a cyclical reaction where very good data is expected to support the USD and very bad data expected to pressure the USD. As for the Fed, the main focus will be on whether the FOMC confirms a downshift in the pace and size of hikes.
CAD
FUNDAMENTAL OUTLOOK: NEUTRAL
BASELINE
Recent economic data has shown some deterioration for the growth outlook with three consecutive months of contraction in jobs, falling house prices, and a deceleration in both core and headline CPI . The previous jobs data gave the CAD a decent lift with its first jobs gain in four weeks, but at 21K jobs added, the job market is still down 92K jobs in the last four months. Despite very hawkish comments from Gov Macklem heading into the Oct meeting, the bank surprised markets with a 50bsp hike when markets were pricing in a 75bsp hike. The bank also stated there is increased risks of a recession during 1H23. This saw initial downside in the CAD as one would expect, but the press conference not closing the door on another 50bsp hike saw some reprieve. Due to the economic outlook, we think the CAD might struggle to in the weeks ahead, unless Oil prices can push higher to provide some upside from a terms of trade perspective.
POSSIBLE BULLISH SURPRISES
Catalysts that see upside in Oil (deteriorating supply outlook, ease in demand fears, OPEC developments) could trigger bullish CAD reactions. As a risk sensitive currency, and catalyst that causes big bouts of risk on sentiment could trigger bullish reactions in the CAD. After the BoC’s dovish shift but leaving the door open for another 50bsp, a very strong labour report could see markets price in a higher chance for a 50bsp and support the CAD.
POSSIBLE BEARISH SURPRISES
Catalysts that trigger downside in oil (deteriorating demand outlook, ease in supply shortage, less supply constraints, OPEC developments) could be a negative catalyst for the CAD as well. As a risk sensitive currency, and catalyst that causes big bouts of risk off sentiment could trigger bearish reactions in the CAD. After the BoC’s dovish shift markets are only pricing in a 25bsp for the next meeting, and a big enough miss could see further downside in the CAD and lower terminal rate expectations.
BIGGER PICTURE
The bigger picture outlook for the CAD remains neutral for now. Given the clear risks to the growth outlook (recent negative econ data and fall in oil prices) we remain cautious on the currency. Furthermore, with lots of good news priced, and with the BoC close to terminal rate expectations, our preferred way of trading the CAD is lower on clear short-term negative catalysts. In the week ahead the overall risk tone will be important from a risk sentiment perspective, but majority of focus will be on the jobs report on Friday which markets will use as a guide for the size of hike to expect from the bank at the upcoming meeting.

USDCAD H4: Bearish outlook seen, further downside below 1.3680On the H4 time frame, prices are facing bearish pressure from the resistance zone at 1.3680, in line with the descending channel’s resistance and Fibonacci confluence levels where we could see further downside to the support zone at 1.3420. This support zone coincides with the graphical low, descending channel’s support and 78.6% Fibonacci extension level. Stochastic is approaching resistance at 96.94 as well where we could see a reversal below this level, in line with prices.

USDCAD Potential upsides as we approach FOMCHey traders, in today's trading session we are monitoring USDCAD for a buying opportunity around 1.354 zone, once we will receive any bullish confirmation the trade will be executed.
Trade safe, Joe.

USDCAD Potential For Bearish ContinuationOn H4, with the price moving below ichimoku cloud and showing a shoulder head pattern , we have a bearish bias that the price may drop form the sell entry at 1.36567, which is in line with the 38.2% fibonacci retracement and overlap to the take profit at 1.33537 where the 61.8% fibonacci retracement is. Alternatively, the price may rise to the stop loss at 1.37981, which is in line with the 61.8% fibonacci retracement.
Please be advised that the information presented on TradingView is provided to Vantage (‘Vantage Global Limited’, ‘we’) by a third-party provider (‘Everest Fortune Group’). Please be reminded that you are solely responsible for the trading decisions on your account. There is a very high degree of risk involved in trading. Any information and/or content is intended entirely for research, educational and informational purposes only and does not constitute investment or consultation advice or investment strategy. The information is not tailored to the investment needs of any specific person and therefore does not involve a consideration of any of the investment objectives, financial situation or needs of any viewer that may receive it. Kindly also note that past performance is not a reliable indicator of future results. Actual results may differ materially from those anticipated in forward-looking or past performance statements. We assume no liability as to the accuracy or completeness of any of the information and/or content provided herein and the Company cannot be held responsible for any omission, mistake nor for any loss or damage including without limitation to any loss of profit which may arise from reliance on any information supplied by Everest Fortune Group.

USD CAD - FUNDAMENTAL DRIVERSUSD
FUNDAMENTAL OUTLOOK: BULLISH
BASELINE
With headline CPI above 8% and Core CPI seeing another acceleration in the SEP CPI data, the Fed is under pressure to continue hiking rates and ramping up QT. Markets expect another 75bsp hike in NOV and currently prices the terminal rate at 4.89%. The Fed is on a data-dependent (meeting-by-meeting) policy stance, meaning incoming growth, inflation and jobs data remains a key driver for short-term USD volatility where we expect a cyclical reaction with incoming data for both the USD and US10Y (good data expected to be supportive for the USD while bad data is expected to pressure the USD). Our expectation for a softer USD this past week played to our advantage with a punchy move lower in the Dollar. The week ahead is filled with lots of US economic data and the FOMC policy decision which will all be important drivers for the USD.
POSSIBLE BULLISH SURPRISES
With the Fed signalling a data dependent policy stance, we expect a cyclical reaction from the USD with incoming US data. Thus, extremely good growth, inflation or jobs data is expected to trigger short-term bullish reactions in the USD. If the cyclical outlook continues to weaken, the USD’s safe haven status still matters. Any incoming catalysts that increase deep recession fears and triggers strong moves lower in risk assets & bonds can trigger safe haven flows into the USD. With a lot priced for the Fed and USD, the bar is high for hawkish Fed surprises, but any aggressive Fed speak talking up a >5.0% terminal rate can trigger further USD upside.
POSSIBLE BEARISH SURPRISES
With the Fed signalling a data dependent policy stance, we expect a cyclical reaction from the USD with incoming US data. Thus, extremely bad growth, inflation or jobs data is expected to trigger short-term bearish reactions in the USD. If the cyclical outlook starts to improve, the USD’s safe haven status still matters. Any incoming catalysts that decrease deep recession fears and triggers strong moves higher in risk assets & bonds can trigger safe haven outflows out of the USD. With a lot priced in for the Fed and the USD, it won’t take much to disappoint on the dovish side. Any big concerns about growth from Fed speakers could trigger outflows.
BIGGER PICTURE
The fundamental outlook for the USD remains bullish as long as the Fed stays hawkish and cyclical concerns put pressure on risk sentiment. The data dependent stance from the Fed means that short-term data surprises can pull the USD either way and would be our preferred way of trading the Dollar right now. We have a very excited economic calendar for the US in the week ahead, with lots of important economic data and the FOMC meeting. For the econ data our expectation is for a cyclical reaction where very good data is expected to support the USD and very bad data expected to pressure the USD. As for the Fed, the main focus will be on whether the FOMC confirms a downshift in the pace and size of hikes.
CAD
FUNDAMENTAL OUTLOOK: NEUTRAL
BASELINE
Recent economic data has shown some deterioration for the growth outlook with three consecutive months of contraction in jobs, falling house prices, and a deceleration in both core and headline CPI . The previous jobs data gave the CAD a decent lift with its first jobs gain in four weeks, but at 21K jobs added, the job market is still down 92K jobs in the last four months. Despite very hawkish comments from Gov Macklem heading into the Oct meeting, the bank surprised markets with a 50bsp hike when markets were pricing in a 75bsp hike. The bank also stated there is increased risks of a recession during 1H23. This saw initial downside in the CAD as one would expect, but the press conference not closing the door on another 50bsp hike saw some reprieve. Due to the economic outlook, we think the CAD might struggle to in the weeks ahead, unless Oil prices can push higher to provide some upside from a terms of trade perspective.
POSSIBLE BULLISH SURPRISES
Catalysts that see upside in Oil (deteriorating supply outlook, ease in demand fears, OPEC developments) could trigger bullish CAD reactions. As a risk sensitive currency, and catalyst that causes big bouts of risk on sentiment could trigger bullish reactions in the CAD. After the BoC’s dovish shift but leaving the door open for another 50bsp, a very strong labour report could see markets price in a higher chance for a 50bsp and support the CAD.
POSSIBLE BEARISH SURPRISES
Catalysts that trigger downside in oil (deteriorating demand outlook, ease in supply shortage, less supply constraints, OPEC developments) could be a negative catalyst for the CAD as well. As a risk sensitive currency, and catalyst that causes big bouts of risk off sentiment could trigger bearish reactions in the CAD. After the BoC’s dovish shift markets are only pricing in a 25bsp for the next meeting, and a big enough miss could see further downside in the CAD and lower terminal rate expectations.
BIGGER PICTURE
The bigger picture outlook for the CAD remains neutral for now. Given the clear risks to the growth outlook (recent negative econ data and fall in oil prices) we remain cautious on the currency. Furthermore, with lots of good news priced, and with the BoC close to terminal rate expectations, our preferred way of trading the CAD is lower on clear short-term negative catalysts. In the week ahead the overall risk tone will be important from a risk sentiment perspective, but majority of focus will be on the jobs report on Friday which markets will use as a guide for the size of hike to expect from the bank at the upcoming meeting.
