UsdjpyUsdjpy formed ascending channel in h4 tf and im expecting breakout soon
incase of successful breakout expecting massive bearish rally
incase of successful breakout expecting 300 pips bearish move keep eyes on for confirmed breakout
Usd-jpy

USDJPY 10/9/23Starting things off with UJ we saw a clear bullish run last week and it looks as if we may seem this carry over into this coming week. from what we have structurally we are sitting at the high of a bullish swing range BUT without having a clear SWH formed, this leads us to believe that we could see a bearish open from our UJ pair. now of course we know the market will do as it pleases but if we do form a swing high we might be able to trade the c- swing POI lower into our range and possibly even our POI.
As it stands we are looking for buy moves from our POI highlighted but until we have a confirmed target (SWH) we can only speculate.
Remember to always read order flow and follow what price is showing you instead of trading based on your desired direction. And, as always, stick to your risk and your plan.
We'll be closely monitoring market openings and price action throughout the week. If you find this analysis useful, let us know in the comments below and hit the boost button to show your support. Here's to a successful week of trading!

GBPJPY SELL OVERVIEW (2D TF)📈GBPJPY up 720 PIPS in profit so far from our POI. Price action still playing out as expected & we can see that bullish momentum is slowly dying down. This indicates that price will most likely top out around our $190 zone as we predicted. This'll be followed by a HUGE BEAR MARKET🩸

USD/JPY Retreats from YTD High Amidst Stimulus Talks and ...USD/JPY Retreats from YTD High Amidst Stimulus Talks and Monetary Policy Divergence
Introduction
The USD/JPY pair has taken a step back from its Year-To-Date (YTD) high of 147.90 and is currently trading around the 147.40 mark in the Asian session on Thursday. This slight retreat comes on the heels of better-than-expected US data, which has propelled the US Dollar (USD) higher against its counterparts. In this article, we delve into the factors influencing the USD/JPY pair's movement and the key developments in the Japanese and US economies.
Japanese Stimulus Measures in the Pipeline
Recent reports from Kyodo News, citing anonymous sources, suggest that the Japanese government is contemplating the implementation of new economic stimulus measures in October. The primary objectives of these stimulus measures are twofold: to support companies in increasing wages and to reduce energy bills. This move reflects Japan's commitment to revitalize its economy amid ongoing challenges.
Bank of Japan's Monetary Policy Stance
Adding to the economic landscape, Bank of Japan (BoJ) policymaker Junko Nakagawa has emphasized the importance of maintaining an accommodative monetary policy for the time being. Nakagawa also noted that Japan has not yet achieved the BoJ's desired price stability. The divergence in monetary policies between the United States and Japan is a factor that may limit the upside potential of the Japanese Yen and serve as a tailwind for the USD/JPY pair.
Japanese Economic Data
Earlier this week, Japan reported a decline of 5.0% in Household Spending year-on-year for July, falling below market expectations of a 2.5% drop. This marks the sixth consecutive month of decline in household spending, highlighting the ongoing economic challenges facing Japan. Currency diplomat Masato Kanda has expressed a strong commitment to monitoring foreign exchange movements with a sense of urgency, emphasizing that all options are on the table.
US Monetary Policy and Economic Data
On the US front, market expectations center on the Federal Reserve (Fed) maintaining interest rates above 5% for an extended period. Fed Governor Christopher Waller has indicated that there is room to increase interest rates further, with data serving as the ultimate determining factor. Meanwhile, Fed Boston President Susan Collins has cautioned against an overly restrictive monetary policy stance, advocating for a patient and deliberate approach.
The Institute for Supply Management (ISM) reported that the US ISM Services Purchasing Managers' Index (PMI) rose to 54.5 in August, surpassing the previous month's reading of 52.7 and beating the market consensus of 52.5. This marked the highest PMI reading since February. Although the S&P Global Composite's final readings slipped slightly in August, the US Dollar Index (DXY) still climbed to a near six-month high above 105.00 on Wednesday, buoyed by the positive data.
Looking Ahead
In the coming days, market participants will closely monitor the release of Japanese Gross Domestic Product (GDP) data for the second quarter, scheduled for Friday. Additionally, Labor Cash Earnings for July and Current Account data will be released from Japan's economic docket. Traders will carefully analyze these data points to identify potential trading opportunities within the USD/JPY pair, which remains sensitive to both domestic and international economic developments.
Our preference
Long positions above 147.00 with targets at 147.80 & 148.00 in extension.

USDJPY Potential UpsidesHey Traders, in this week we are monitoring USDJPY for a buying opportunity around 145.500 zone, USDJPY is trading in an uptrend and correction phase in which it is approaching the trend at 145.500 support and resistance zone.
Trade safe, Joe.

✨ NEW: USDJPY ✨ DT SWING✨-SL @ 150.00 🚫
SLO @ 148.90 (conservative) ⏳
SSO @ 147.75 (moderate) ⏳
TP1 @ 142.66 (shaving 25%)
TP2 @ 139.15 (shaving 25%)
TP3 @ 136.60 (shaving 25%)
TP4 @ 132.60 (closing ALL Sell Orders)
BLO @ 129.33 (1D) ⏳
-SL @ 128.25 🚫
ADDITIONAL INFO:
📈 Price Action is nearing our SLO. Just a few more pips to the upside, our SLO will trigger, and it's off to the bank after that.
📉 Let's catch this DT and enjoy the ride because it's gonna be a long one.
📉 Also, I placed a pending SSO, just in case we don't get our SLO filled

USDJPY TECHNICAL ANALYSIS Good day, Trader.
We'll be keeping an eye on USDJPY. Even though the 4-hour timescale clearly shows a bullish continuation pattern, I like to be careful. Before going long, I will patiently wait for price to break out of and retest the 1.46.643 zone, and before considering selling USDJPY, I will be anticipating price to totally take out the 145.953 zone. Recall that patience is crucial, and that entry requires confirmation.
❤️Please, support my work with like, thank you!❤️

USDJPY One last rally before a correction.It's been almost 2 months since we looked into the USDJPY pair (see chart below) and our buy position right at the bottom of the Channel Up that easily hit its 144.500 target:
The pattern is still holding and the price appears to be starting the final upward leg before it tests the top (Higher Highs trend-line) of the pattern. As a result, as long as the 1D MA50 is holding, we are bullish targeting 150.000 (top of Channel Up). If the 1D MA50 breaks, we will short-term sell towards the 1D MA100 (green trend-line). If the price closes below the 1D MA100, we will consider it a pattern bearish break-out and sell targeting the 1D MA200 (orange trend-line) and Support 3 at 138.100.
-------------------------------------------------------------------------------
** Please LIKE 👍, FOLLOW ✅, SHARE 🙌 and COMMENT ✍ if you enjoy this idea! Also share your ideas and charts in the comments section below! **
-------------------------------------------------------------------------------
💸💸💸💸💸💸
👇 👇 👇 👇 👇 👇

Yen weakness continuesThe Japanese yen weakness persists despite the US dollar retracement.
As the price breakout of the brief consolidation and trades below the resistance level of 146.50, look for a breakout above the resistance level to signal further upside, with the next major resistance at 147.30, the previous swing high

USDJPY 3/9/23Starting this week off with USDJPY on Friday we saw the NFP and other red folder USD news shift this pair higher and into a bullish range, now as always we don't want to just jump into a bullish range from a bearish pair.
this doesn't me we wont trade the range it just means we are going to look into a more conserved methods to enter any buys.
overall this move is provided by a shift from news so we are going to treat it like every news POI we come to within our trading days, confirm and protect.
Remember to always read order flow and follow what price is showing you instead of trading based on your desired direction. And, as always, stick to your risk and your plan.
We'll be closely monitoring market openings and price action throughout the week. If you find this analysis useful, let us know in the comments below and hit the boost button to show your support. Here's to a successful week of trading!

USDJPY Potential UpsidesHey Traders, in tomorrow’s trading session we are monitoring USDJPY for a buying opportunity around 145.500 zone, USDJPY was trading in a downtrend and successfully managed to break it out. Currently is in a correction phase in which it is approaching the retrace area at 145.500 support and resistance zone.
Trade safe, Joe.

USDJPY Potential DownsidesHey Traders, in today's trading session we are monitoring USDJPY for a selling opportunity around 145.500 zone, USDJPY was trading in an uptrend and successfully managed to break it out. currently is in a correction phase in which it is approaching the trend at 145.500 support and resistance zone.
Trade safe, Joe.

USDJPY: Consolidation & The Next Bullish Move 🇺🇸🇯🇵
USDJPY is currently consolidating within a horizontal range.
Taking into consideration the fact, that the pair is trading in a long-term bullish trend,
probabilities are high that the market will resume the growth soon.
Your confirmation will be a bullish breakout - a daily candle close above 146.6 - the upper boundary of the range.
A bullish continuation will be expected to 148.0 level then.
Alternatively, remember that the price may also drop from the underlined blue resistance and keep consolidating.
❤️Please, support my work with like, thank you!❤️

Long USDJPYLast week USDJPY posted a green Heiken Ashi candle on the weekly time frame. This suggests to me that we may have another green week.
It is also the case that a green Heiken Ashi candle posted on the daily time frame after a red candle. This suggests to me that this could be the beginning of a muli-day bull run.

USDJPY 27/8/23UJ honestly i don't have a huge amount to say about this pair or about this range, if you have looked over our other USD related pairs you will know the story by now.
A news range with honestly a poor structure overall, liquid has built higher and lower meaning we may push up then shift lower, as you can see we have a reverse of our other USD pairs as in this case the USD is our primary.
so you guys know what we are looking for, either a shift higher to give us a new range or a confirm entry for our NEWS created POI, on the other end we may have a sweep of our low to give us a bias the is opposite to what we have currently.
Remember to always read order flow and follow what price is showing you instead of trading based on your desired direction. And, as always, stick to your risk and your plan.
We'll be closely monitoring market openings and price action throughout the week. If you find this analysis useful, let us know in the comments below and hit the boost button to show your support. Here's to a successful week of trading!

USDJPY Potential DownsidesHey Traders, in today’s trading session we are monitoring USDJPY for a selling opportunity around 146 zone, USDJPY was trading in an uptrend and successfully managed to break it out. Currently is in a correction phase in which it is approaching the retrace area at 146 support and resistance zone.
Trade safe, Joe.

USDJPY Potential DownsidesHey Traders, in the coming week we are monitoring USDJPY for a selling opportunity around 145.500 zone, USDJPY is trading in a downtrend and currently is in a correction phase in which it is approaching the trend at 145.500 support and resistance zone.
Trade safe, Joe.

Bearish daily bias on GJTEST of daily bias BOS
Remember to always read order flow and follow what price is showing you instead of trading based on your desired direction. And, as always, stick to your risk and your plan.
We'll be closely monitoring market openings and price action throughout the week. If you find this analysis useful, let us know in the comments below and hit the boost button to show your support. Here's to a successful week of trading!

USDCHF LongsLooking to buy from the support level of 0.87240,
waiting for that pull back before we enter just to add extra confirmation

Is this the USD/JPY spring point? Looking at the Dollar vs. Yen on the higher timeframe going into this week looks like it could be in a perfect spot to catch some volume and ride a trend. When looking at multiple variables of the pair you can see reasons why I believe this may be time for the Dollar to fan its wings a little bit.
Healthy trend is obvious to myself and my trading style, and to get into long positions I would be looking to attempt to fulfil a pullback that correlates with the previous two pull backs. If my prediction is right on this idea then we should pull right back into that recent bullish reaction and move to the upside.
You can see the Fibonacci level drawn on the pair, and then the actual Dollar index and what I notice is a retracement backdown to the .50 mark until bullish momentum picked back up.
The overlay printed is tracking higher value FRAMA areas and I have coded it to quit printing the overlay when the lines are crossing or overlapping to indicate an indecisive market and to keep out of "trend trades" in those conditions and focus more on a range strategy if I really must, and I see a trend trade opportunity rather than a retracement down to the range bottom.
Even with heavy news last week, the Dollar stayed pretty strong in my own eye due to the fact some important numbers missed, and the impact was quickly recovered. I see this as high bullish impact, and we are in a big retail zone on a higher time frame bringing me to a bias being trapping traders in short positions slowly beginning of the week until the volume control is gained back and will go to take highs and create new ones.
The Yen has been taking a beating and the bullish activity cant seem to hold when it does inject. I see a range if anything next week on the Yen index but if my analysis is correct we should see a lower high and a lower low created.

USDJPY: Rebound on the 1D MA50. Buy signal.USDJPY is on the third straight green 1D candle after a rebound on the 1D MA50 that has turned the 1D time-frame into healthy bullish levels (RSI = 60.603, MACD = 0.480, ADX = 30.898). This is technically a bullish continuation signal, with the 1D MACD after a Bullish Cross, resembling the bullish sequence of April.
We are long, targeting the R3 level (TP = 146.800). If the price crosses under S1, we will short and target the S2 level (TP = 133.515).
## If you like our free content follow our profile to get more daily ideas. ##
## Comments and likes are greatly appreciated. ##

USDJPYLooking for a retracement of the previous low (white dot) I am a fan of the weaker dollar short term. Banking on this recent high to not be broken. This could be an "ABC" pattern to the downside. I'll update regardless of outcome.

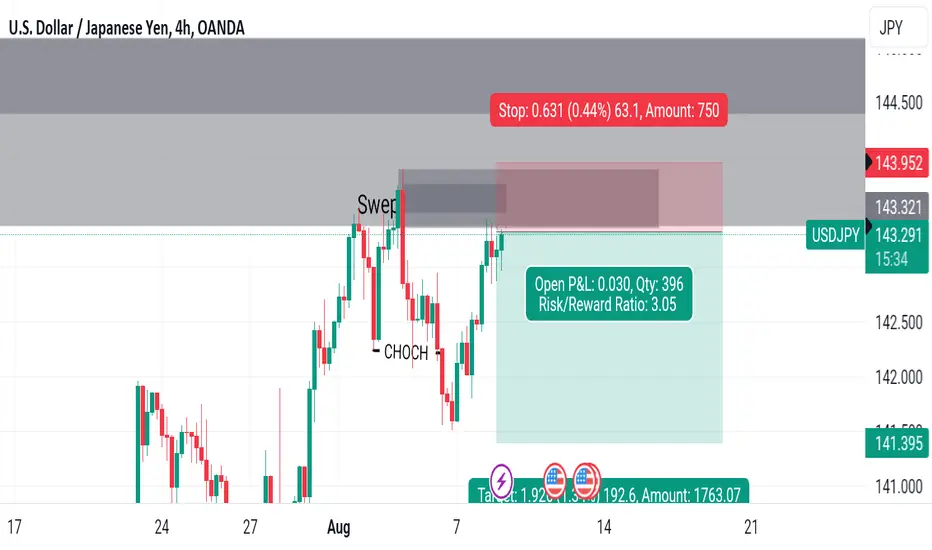
USDJPY SELL SetupWe have reason for entry
One reason made swep then choch
2 the price is neaer from supply
And we have supply on 1day and 1w