USD JPY - FUNDAMENTAL ANALYSIS2023-2024 Exchange Rate Forecasts From MUFG
Japanese Yen: Long-Term Pressure for Yen Gains
As far as the yen is concerned, the Bank of Japan has continued to resist policy tightening, but MUFG suspects that the position could change very quickly.
It notes; “We suspect the BoJ could pivot quickly and alter YCC without much warning.”
The bank also expects that the underlying inflation profile has increased which could have important implications for the central bank and yen.
It adds; “The sense that this time could be different is certainly building in Japan.”
An eventual policy shift is expected to boost the heavily-undervalued yen.
Usd-jpy

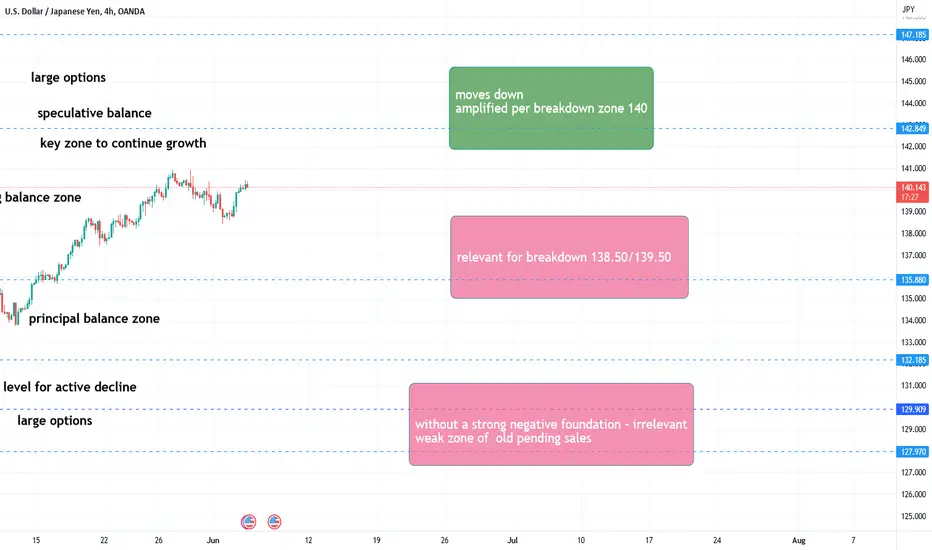
USDJPY approaches key decisive area The USDJPY has been trading strongly to the upside since early May with no significant corrective move to the downside.
Now, with the 50MA again crossing below the 200MA and price action showing bearish momentum, look for the USDJPY to break below the 138.75 support level formed last Friday.
Along with a downward movement on the RSI, if the USDJPY breaks below 138.75, the price could fall toward the next support level of 137.50.
Although there is another key support level at 135.55, this might be too low as a possible target level.

USDJPY Potential UpsidesHey Traders, in today's trading session we are monitoring USDJPY for a buying opportunity around 138.700 zone, USDJPY is trading in an uptrend and currently seems to be in a correction phase in which it is approaching the major trend at 138.700 support and resistance zone.
Trade safe, Joe.

USD\JPYWe open the week with the decision of OPEC + to reduce oil production, but speculation on this topic will be short-term.
USDJPY bullish but meeting resistanceUSDJPY is continuing to be bullish, at least in the weekly chart, with MACD and VolDiv supporting in bullish alignment.
141.6 is the expected resistance, thereafter, 134 a good support.


USD JPY - FUNDAMENTAL ANALYSISThe Bank of Japan's (BoJ) monetary stance remained unchanged as they didn't convene, keeping the key policy rate at -0.10% and the 10-year yield at around zero percent due to Yield Curve Control.
Several factors contributed to the Yen's weakening, including reassessments of the Federal Reserve's monetary tightening outlook, which generally boosted the dollar.
The 10-year breakeven rose significantly, hinting at rising inflation expectations in Japan. With inflation hitting new highs and property values also increasing, real yields in Japan are falling.
Despite rising inflation, the BoJ's apparent lack of urgency to change its current monetary stance has also influenced the Yen's movement.
However, there are suggestions that the BoJ might change its Yield Curve Control without much warning.
With possible political factors also in play, the overall view, according to analysts at MUFG, is of limited scope for further rise in the USD/JPY exchange rate, given the Fed's projected pause in June.
Japanese Yen Performance in May
The Yen's performance against other major currencies in May has been mixed, the Japanese currency saw a depreciation against the US dollar but a strengthening against the Euro.
"In May the yen weakened further versus the US dollar in terms of London closing rates from 136.09 to 139.68" says Derek Halpenny, Head of Research, Global Markets EMEA and International Securities at MUFG.
Bank of Japan's Monetary Stance
Despite the fluctuations, there hasn't been a change in the monetary policy of the Bank of Japan (BoJ). The central bank's current stance remained steady with a key policy rate of -0.10% and the ten-year yield managed within a +/- 50bps range due to Yield Curve Control (YCC).
"The BoJ did not meet in May and hence its current monetary stance was unchanged with the key policy rate at -0.10% and YCC restraining the 10-year yield within a range of +/-50bps around zero percent," says Halpenny.
Factors Influencing the JPY's Exchange Rate Performance
Several macroeconomic dynamics influenced the Yen's performance in May. A crucial contributor to these dynamics was a reappraisal of the Federal Reserve's perspective on monetary policy tightening in the US, which resulted in a strengthening of the US dollar.
"Firstly, the reassessment of the outlook for monetary tightening by the Fed helped lift the dollar in general in May and that helped propel USD/JPY higher," Halpenny states. He adds, "From close to a zero probability, OIS pricing now indicates around a 50% probability of another rate hike by the Fed."
Furthermore, the Yen's value was impacted by domestic economic indicators. There's been a significant increase in real yields (the returns on investments that have been adjusted for the effects of inflation) in Japan, accompanied by a surge in inflation expectations.
"Real yields have been falling sharply in Japan with inflation expectations jumping. The 10yr breakeven jumped 20bps in May and reached close to 1.00%, the highest since June 2022," Halpenny notes.
Impact of Asset Price Inflation
The rising inflation in Japan wasn't just limited to goods and services, but also included a surge in asset prices. A broad spectrum of assets, including the Topix Index, property prices, and land prices, experienced significant gains.
The TOPIX, or Tokyo Stock Price Index, is a broad stock market index that tracks all domestic companies listed on the First Section of the Tokyo Stock Exchange (TSE), the largest stock market in Japan. It includes a wide range of company sizes and sectors, making it a comprehensive barometer of the overall Japanese equity market.
"The Topix Index surged 3.6% in May in contrast to a 0.2% gain in the S&P 500. Property prices and land prices are also moving higher in Japan," says Halpenny.
Despite the rising inflation and falling real yields, the BoJ appears untroubled about the situation and is in no hurry to change its monetary policy.
"Adding to yen selling is the clear sense of a lack of urgency from Governor Ueda to change the current monetary stance," says Halpenny.
However, there are signs that the BoJ might spring a surprise and make quick alterations to its YCC policy. "We suspect the BoJ could pivot quickly and alter YCC without much warning," Halpenny states.
In the backdrop of all these factors, the outlook for the Yen seems nuanced. The combination of increasing inflation, changing monetary policy stances, and political factors all paint a picture of restrained potential for further appreciation of the Yen against the US Dollar, especially with a projected pause in the Federal Reserve's policy actions in June.
"With the Fed set to pause in June, we see limited scope for USD/JPY to move higher from here," Halpenny concludes.

USDJPY Potential UpsidesHey Traders, USDJPY was trading in a downtrend and successfully managed to break it out with a weak JPY, currently USDJPY seems to be in a correction phase in which it is approaching the retrace area at 139.500 support and resistance zone.
Trade safe, Joe.

USDJPY | SELL NOW AND BUY LATER? (maybe)Hey Everyone!
I believe USDJPY can have both scenarios for the following reasons:
SELL setup:
- USDJPY has been very bullish recently and needs a strong rejection.
- Even with NFP news outcome being positive the USD is currently falling slightly.
- There is a good bearish channel and stoploss is covering our 100-200 moving averages.
Buy setup:
- After the likely rejection I believe a strong pullback to the psychological level 137.00 could trigger huge bullish pressure.
- That's where the 200 moving average is sitting on the daily and the 4h is nearby which usually trigger a reaction in the market.
- Overall market direction is also very bullish in favour for USD.
My personal opinion: I would not sell, I would wait for that pullback and stay patient, but for those who love a little risk, could be a good trade-down.
If moving averages do manage to break to the upside, this trade becomes invalid.

USD JPY - FUNDAMENTAL ANALYSISUSD/JPY has reversed from a high near 141, largely on the back of shrinking expectations that the Fed would hike in June. That is now priced with a 25% probability rather than a 70% probability attached to it last month. We have noted that the current environment should continue to see interest in carry trade strategies – where the Japanese yen scores poorly. However, USD/JPY looks overvalued relative to the terms of trade story – which is much better for the yen than a year ago.
In addition, there is still the risk that the Bank of Japan surprises on 16 June by further normalising its Yield Curve Control policy. That would be a yen positive. And thus it would not be a surprise to see speculator investors trying to re-position short USD/JPY above 140 – even if such a strategy has already proved painful this year.
✨NEW: USDJPY ✨ SWING TRADE ✨SLO @ 144.05 ⏳
SSO @ 138.33 ⏳
TP1 @ 134.00 (shaving 25%)
TP2 @ 125.50 (shaving 25%)
TP3 @ 119.25 (shaving 25%)
TP4 @ 110.75 (shaving 25%)
TP5 @ 103.85 (shaving 25%)
BSO @ 101.66 ⏳
BLO @ 99.66 ⏳
ADDITIONAL INFO:
TP1 @ 134.00, before Pivot Low
TP2 @ 125.50, at Mid-Pivot
TP3 @ 119.25, at Major Support
TP4 @ 110.75, above Upper Demand
TP5 @ 103.85, above Lower Demand
BSO @ 101.66, after Price Action drops below
TECHNICAL ANALYSIS:
As of June 1, 2023, the USDJPY is trading around 139.80.
The RSI is overbought, which indicates that the market is due for a correction. The MACD is also starting to turn down, which could be another sign that the trend is about to change.
⚠️Be mindful that the moving averages are all sloping upwards, which is a bullish sign.
Overall, the technical analysis for the USDJPY is mixed. There are some bullish signs, however the bearish signs seem to be forging ahead. Traders should be cautious and wait for a clear downtrend to emerge before taking any short trades.
Here are some of the key levels to watch for:
* SUPPORT: 139.45
⚠️ For a more aggressive approach, you can place a Market Order to Sell once price opens and closes below Support
* RESISTANCE: 140.65
⚠️ For a more aggressive approach, you can place a Market Order to Buy once price opens and closes above Resistance
If the price breaks below the support level, it could signal a change in trend to the downside. If the price breaks above the resistance level, it could signal a continuation of the bullish trend.
Here are some of the factors that could affect the USDJPY in the near future:
* The US Federal Reserve's interest rate decision on June 15.
* The Japanese government's economic data releases.
Traders should keep an eye on these factors and adjust their positions accordingly.

USDJPY - Potential Daily Retracement comingFundamental Analysis
The Japanese Yen is doing great lately, thanks to a mix of factors. This makes the USD/JPY pair go down for the third day in a row. The official Chinese PMI numbers for May were not so good, which makes people worry about the global economy and look for safer options. The JPY is one of them, especially because the Japanese authorities might step in to stop it from falling too much.
Japan’s Vice Finance Minister for international affairs, Masato Kanda, said they will watch the currency market closely and do what they need to do. He also said they won't rule out any option. On top of that, the US Treasury bond yields are going down too, which makes the US-Japan rate difference smaller and favors the JPY. However, the Bank of Japan (BoJ) is not so keen on the JPY rising too much, so that might limit its gains.
Another thing that helps the USD/JPY pair stay afloat is the strong US Dollar. The USD Index, which measures the Greenback against other currencies, is near its highest level since mid-March that it reached on Tuesday. It is supported by the expectations that the Federal Reserve (Fed) will keep interest rates high for longer. The markets think that the US central bank will raise interest rates by another 25 bps at the June FOMC meeting.
The US economic data, such as the Chicago PMI and JOLTS Job Openings, will influence the USD demand. Also, pay attention to what the FOMC members say and how the US bond yields change. These factors will affect the USD/JPY pair too. And don't forget to check the overall mood of the market. It can give you some clues about the USD/JPY pair and help you find short-term opportunities.
Technical Analysis
As per the daily price action we believe USD/JPY, will very likely retrace to last broken high / Trenline zone (grey arrow) before seeing any true bullish move aiming for $144 price zone. That retracement could be deeper (see dotted grey arrow), and even more complex, i.e. through a corrective wave. Right now we are watching the current level for potential retracement, which could be a nice opportunity for a short.

USDJPY Upside PotentialHey Traders! 👋
For Day 21/100 of our challenge, we will look at USDJPY upside potential this week.
Technicals:
- Currently on pivot area (expecting support to form)
- But price is still creating LLs-LHs
- Better to go long above 139.600
- Target previous high 140.800
Fundamentals:
- Market to price in higher probability of rate hikes as positive data continues to support this narrative
- BoJ remains with dovish policy and no changes are foreseen in the near-term

USD/JPY Chart H1Here is my view for USDJPY on H1. The price could go bearish, you can put a pending order on the Order block or find an entry on LTF within OB Zone. Trade Safe!

USDJPY Potential UpsidesHey Traders, in today's trading session we are monitoring USDJPY for a buying opportunity around 139.300 zone, USDJPY is trading in an uptrend and currently seems to be in a correction phase in which it is approaching the major trend at 139.300 support and resistance zone.
Trade safe, Joe.

USDJPY correction time; RSI/BBAND/STOCH/HAIKEN ASHIInstructions:
1)The Relative Strength Index (RSI) shows that the asset is temporarily overbought/oversold, suggesting a possible trend reversal.
2) Bollinger Bands indicator shows that the asset is currently in an upper/lower resistance/support zone.
3) The Forex Stochastic Oscillator (Stoch) helps identify buy and sell moments based on comparing the current price with the price range over a specific time frame.
4) In addition, I use Heiken Ashi candles, which help to see the trend in a smoother and smoother way.
Intervals:
H1:
1) RSI near the 70 level and the indicator is falling
2) Price bounced off the Bollinger band
3) Stoch above 80 and the sell line (red) is on top of the buy line (green)
4) Red candle Haiken Ashi
Notes:
Additional confirmation will be the red Haiken Ashi candle on the H4 interval.
Conclusions:
Based on the analysis of the RSI, Bollinger Bands, Stoch and the Heiken Ashi candles, it appears that the USDJPY asset may be at a turning point.
Stop Lose:
Above the top of the Bollinger Band +10/15pips. SL will be set at break even after a 10/15pips gain.

USDJPY Breaks above key resistance at 137.900Hey Traders, on above chart we have a breakout of 137.900 resistance area due to bullish USD data, currently we are keeping an eye for a potential retrace of the breakout before further bullish momentum,
Trade safe, Joe.

USD/JPY can ascend further🌟The USDJPY is in a Bullish phase by reaching a PRZ zone
🌟 Bullish signals are:
- Bullish Cup & Handle
- Dynamic Support zone
- Pivot R1 weekly
- Ascending Triangle
⭐ Note if the PRZ is broken downwards with the strength of Bearish candles from bottom Of the PRZ zone , this analysis of ours will be failed.
⏮️Previous Analysis⏮️
✅If this post was useful for you, like it ❤️ and if you think it is useful for your friends, be sure to send it to them.
_ _ _ _ _ _ _ _ _ _ _ _ _ _ _ _ _ _ _ _ _ _ _ _ _ _ _ _ _ _ _ _ _
🌍Thank you for seeing idea .
Have a nice day and Good luck.

USD JPY - FUNDAMENTAL ANALYSISThe US dollar (USD) has staged a comeback against the Pound Sterling (GBP) and Euro (EUR) over the past few weeks, but foreign exchange analysts at MUFG still consider that medium-term depreciation is the most likely outcome.
The bank considers that the US Dollar exchange rates are overvalued, especially against the Japanese Yen (JPY) and net capital flows are likely to be less supportive.
It also considers that the Euro-Zone and Chinese outlooks are more favourable, especially given that gas prices have declined sharply.
MUFG also expects the Fed will cut rates before the ECB while the Bank of Japan will tighten policy.
Monetary policy will inevitably be a key aspect. Although the immediate debate is still surrounding the potential for further interest rate hikes, MUFG expects the debate will switch to the potential for a Federal Reserve policy reversal as the US economy deteriorates.
According to the bank; “ The Fed will be cutting rates prior to the ECB. Inflation in Europe is stickier due to energy and food prices and the Fed will have much more scope to respond once economic conditions in the US weaken further from here. ”
After an extended period of quantitative easing, MUFG also expects that the ECB quantitative tightening programme through bond sales will put upward pressure on longer-term yields and support the Euro.
Global Growth Trends Still Favourable
MUFG notes that previous forecasts of an extended UK recession have been revised away and the Euro-Zone has also been resilient.
As far as China is concerned it adds; “ Recent data has disappointed, in particular on the manufacturing side of the economy, but pent-up domestic demand likely has further to run which will act as a source of global growth this year. ”
Although market sentiment has been more cautious, it expects overall growth dynamics will not favour the US dollar as Asia rebounds.
A related issue is the key area of energy prices.
The jump in energy costs last year was a key reason why agencies such as the IMF and central banks were so negative surrounding the European economic outlook last year.
Gas prices have, however, declined sharply with a slump from over 90% from the peak and close to 2-year lows.
Gas storage levels are also at very high levels in historic terms ang MUFG expects storage levels will hit 100% in the summer.
In this context, lower gas prices will improve the growth outlook and strengthen the trade outlook.
The Bank of Japan has resisted tightening monetary policy, but MUFG notes that the economy is strengthening and inflation has increased.
According to MUFG; “ we maintain that YCC has passed its sell-by-date and while it remains unclear whether price stability at 2% can be achieved, the BoJ will still move to widen the band or scrap it completely. ”
The bank expects that the yen will strengthen sharply if the Bank of Japan lets yields increase which will drag the dollar lower.
Negative Long-Term US Debt Dynamics
The immediate focus is on the US debt ceiling and political brinkmanship ahead of early June when the US Treasury will run out of cash.
These short-term dynamics are mixed for the US dollar with concerns over the economy, but potential defensive support if risk appetite deteriorates.
MUFG focusses on the underlying debt dynamics and the potentially unsustainable situation.
MUFG notes that the budget deficit in the first seven months of fiscal 2022/23 amounted to $928bn from $360bn the previous year.
On a longer-term view, in considers the debt dynamics will be potentially negative for the US currency.
De-Dollarization Hype
Although MUFG considers that the de-dollarization rhetoric is rather more hype than substance, there is still the risk that long-term confidence in the dollar will decline with scope for some further increase in Euro and yuan central bank reserve holdings.
MUFG also notes that there has been strong central bank gold buying and it expects this trend will continue.
The bank also sees a risk that the US use of financial sanctions will discourage official players to hold reserves in the dollar due to fears over asset freezes.
MUFG notes that there has been an extended period of Wall Street out-performance, but expects this trend will reverse and net capital flows will be less supportive for the US currency.
It adds; “ We see a renewed drop in US equities as investors position more assertively for US recession. ”
Japan’s Nikkei 225 index has posted a 32-year high and the German DAX index has hit a record high.
It also sees scope for a sustained rebound in emerging-market equities after an extended period of under-performance.
It adds; “ A reversal of the current period of deep EM undervaluation poses downside risks for the USD in the medium-term. ”
Long-Term Peak, Dollar Overvalued
MUFG notes that the dollar last year reached the highest level for over 20 years.
It also notes that at the October peak the currency index was 2 standard deviations stronger than the average over the past 40 years.
It adds; “ Similar extreme levels of USD overvaluation were last recorded in the early 2000’s and mid-1980’s and subsequently proved to be long-term bearish turning points for the USD. ”
The bank also considers that the dollar is substantially overvalued, especially against the yen, increasing the likelihood of mean reversion.

une reprise vers le haut de cette pairecette paire monte toujours une tendance haussière. elle vient de casser sa résistance.

USDJPY Potential UpsidesHey Traders, in today's trading session we are monitoring USDJPY for a buying opportunity around 138.1 zone, USDJPY is trading in an uptrend and currently seems to be in a correction phase in which it is approaching the major trend at 138.100 support and resistance zone.
Trade safe, Joe.

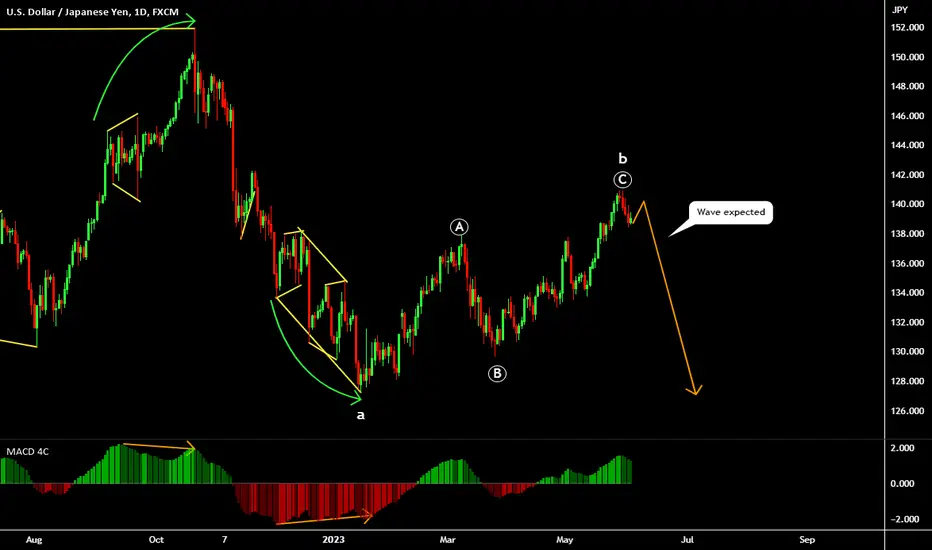
USDJPY Next move!(bearish)Hello Traders
In bigger picture(TF daily) the price is making an ABC correction.
In smaller TF Wave B is completing and trend still bullish in 4hr TF.
RSI has been reached in overbought zone so we should expect a small correction.
Our technical view has been shown in the chart.
If you like it then Support us by Like, Following, and Sharing.
Thanks For Reading
Team Fortuna
-RC
(Disclaimer: Published ideas and other Contents on this page are for educational purposes and do not include a financial recommendation. Trading is Risky, so before any action do your research.)

USD JPY - FUNDAMENTAL ANALYSISForeign exchange analysts at Goldman Sachs still expect that the US Dollar to lose ground over 2023 as a whole, but expect this will take longer than expected previously due to US and global developments.
It notes; “Our underlying view for FX markets this year is that we are likely to see only a “bumpy deceleration” for the Dollar, because slack in the US economy is still limited, and we are still “waiting for a challenger.”
The 3-month Dollar to Yen (USD/JPY) exchange rate has been revised higher to 140 from 132 previously while the 6-month forecast has been revised to 135 from 125.
The 12-month forecast remains at 125.0.
From a longer-term perspective, Goldman still expects that the dollar will lose ground, but it considers that the short-term perspective has changed slightly.
It adds; “we think the recent rally in the broad Dollar more appropriately reflects the fine balance facing currency markets at the moment.”
Goldman points out that the US economy has performed more strongly than expected after the Silicon Valley Bank collapse in March.
According to Goldman; “In the US, recent data on credit conditions have been a bit better than feared. And cost pressures have eased somewhat but remain a top priority, so that a number of Fed officials have said they still see some risk that rates may ultimately have to rise further.”
Another key element for exchange rates is that dollar selling necessitates the buying of another currency.
In this context, Goldman is less confident that there are attractive alternatives. The narrative earlier in the year was of a strong rebound in China and notable resilience in the Euro-Zone.
Both these elements have come into doubt over the next few weeks.
The Bank of Japan has also not engaged in any shift in monetary policy with the ceiling for the 10-year yield held at 0.5%.
The delay in tightening policy has undermined the yen in global markets.
Goldman adds; “Dollar depreciation usually coincides with strong activity in the rest of the world, not US underperformance. We think recent developments all support this view, and should also support some further Dollar strength over the near term.”
The 3,6 and 12-month Euro to Dollar (EUR/USD) exchange rate forecasts are unchanged at 1.05,1.05 and 1.10 respectively.
