USDJPY - Scalping pullback to descending parallel channel?After the positive US news yesterday USDJPY broke out of the descending parallel channel it had been in for the past 12 weeks.
I believe DXY is due either a retracement from its current impulse (back to around 107.4 (0.5 fib), or it will indeed completely reverse up based on fundamentals. If this is the case then UJ's breakout will likely become a big move to the upside.
In the very short-term though, I believe UJ will retest the channel (around 250 pips).
It's over-sold and channel breaks normally respond with a retest before continuing the move away, so I'm looking for shorts around 131.500.
Usd-jpy

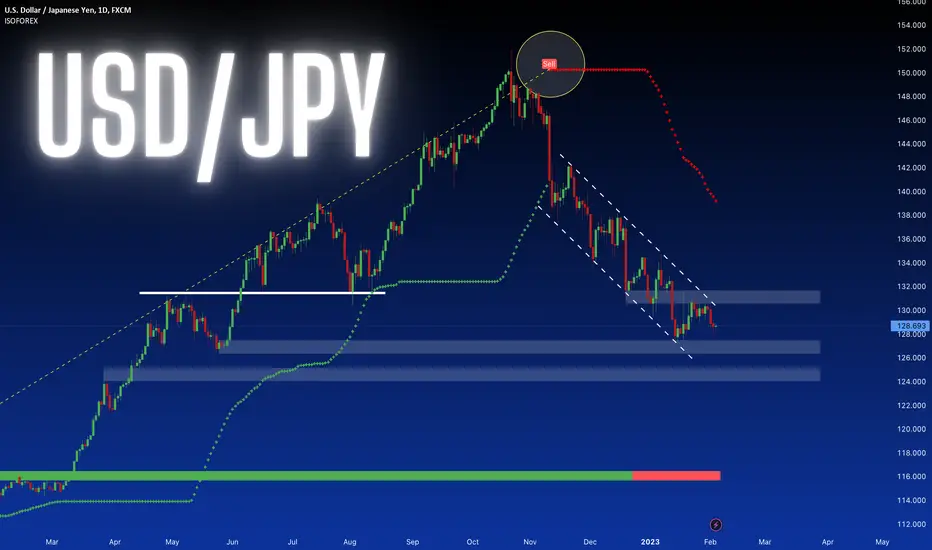
USDJPY SHORT it resisted the BOJ interest rate levels after the NFP outburst i do expect the price of 128.88 8 to kick in very aggressively now

USDJPY BUY ZONEGood evening everyone! Don't forget to put your thumbs up and write comment if you like the idea.
USDJPY buy zone 128.500 and 127.900 and 127.400 SL 126.900. Risk 1%. Buy from monthly and weekly target area. First Target Standard, Global Target Return to Area 130.600 and 132.500
DISCLAIMER:
The opinion of the author may not coincide with yours! Keep this in mind and consider in your trading transactions before making a trading decision.

USDJPY SHORT I do expect these short to kick in - trendline is looking clear from BOJ interest rates. i do now expect USDJPY to start shorting really hard. been a hectic Thursday and Friday.

USD/JPY is stuck in a range around mid-128,000 waiting US-NFPThe USD/JPY pair oscillates in a constrained range on Friday as it fails to build on the previous day's small recovery from close to the two-week low of 128.00. Spot prices remain stable above mid-128.00s throughout the early European session, oscillating between tepid gains and slight losses.
The US Dollar is seen operating as a tailwind for the USD/JPY pair as it moves higher on the final day of the week and aims to build on its rebound from a nine-month low set on Thursday. The US dollar's increase may be linked to some repositioning trading before the release of the much anticipated US monthly jobs report later in the early North American session. The underlying resilience in the labor market was highlighted by the US Weekly Initial Jobless Claims data issued on Thursday, which raised hopes for robust Nonfarm Payrolls (NFP). As a result, investors were obliged to reassess their predictions for future rate increases by the Fed, which helped to sustain the USD. However, lower US Treasury bond yields limit the amount of profit.
The Bank of Japan (BoJ), on the other hand, is expected to adopt a more hawkish position later this year, which is expected to bolster the Japanese Yen. The Nationwide Core Inflation Rate for Japan, which recorded its highest annualized reading since December 1981, helped to increase the bets. This is considered to be another element that, at least temporarily, restrains the USD/JPY pair.
In the wake of the overnight breach below a symmetrical triangle and before of the important US macro data, bullish traders also appear cautious to place new bets. However, it appears that the USD/JPY pair will experience losses for the first time in three weeks.
USDJPY 127.777 by NFP NEWS i do expect USDJPY to reach this take profit zone by NFP - it is falling very hard make sure to have a good risk management on this trade.
TP 127.777

USDJPY Potential for Bearish Drop to previous swing lowLooking at the H4 chart, my overall bias for USDJPY is bearish due to the current price being below the Ichimoku cloud, indicating a bearish market. Looking for a pullback sell entry at 129.204, where the overlap resistance is. Stop loss will be at 131.115, where the recent high is. Take profit will be at 127.215, where the previous swing low is.
Please be advised that the information presented on TradingView is provided to Vantage (‘Vantage Global Limited’, ‘we’) by a third-party provider (‘Everest Fortune Group’). Please be reminded that you are solely responsible for the trading decisions on your account. There is a very high degree of risk involved in trading. Any information and/or content is intended entirely for research, educational and informational purposes only and does not constitute investment or consultation advice or investment strategy. The information is not tailored to the investment needs of any specific person and therefore does not involve a consideration of any of the investment objectives, financial situation or needs of any viewer that may receive it. Kindly also note that past performance is not a reliable indicator of future results. Actual results may differ materially from those anticipated in forward-looking or past performance statements. We assume no liability as to the accuracy or completeness of any of the information and/or content provided herein and the Company cannot be held responsible for any omission, mistake nor for any loss or damage including without limitation to any loss of profit which may arise from reliance on any information supplied by Everest Fortune Group.

USDJPY Potential for Bearish Drop | 3rd February 2023Looking at the H4 chart, my overall bias for USDJPY is bearish due to the current price being below the Ichimoku cloud, indicating a bearish market. Looking for a pullback sell entry at 129.204, where the overlap resistance is. Stop loss will be at 131.115, where the recent high is. Take profit will be at 127.215, where the previous swing low is.
Any opinions, news, research, analyses, prices, other information, or links to third-party sites contained on this website are provided on an "as-is" basis, as general market commentary, and do not constitute investment advice. The market commentary has not been prepared in accordance with legal requirements designed to promote the independence of investment research, and it is therefore not subject to any prohibition on dealing ahead of dissemination. Although this commentary is not produced by an independent source, FXCM takes all sufficient steps to eliminate or prevent any conflicts of interest arising out of the production and dissemination of this communication. The employees of FXCM commit to acting in the clients' best interests and represent their views without misleading, deceiving, or otherwise impairing the clients' ability to make informed investment decisions. For more information about the FXCM's internal organizational and administrative arrangements for the prevention of conflicts, please refer to the Firms' Managing Conflicts Policy. Please ensure that you read and understand our Full Disclaimer and Liability provision concerning the foregoing Information, which can be accessed on the website.

USDJPY Best sell entry but RSI on Bullish DivergenceThe USDJPY pair has been trading within an extremely well structured Channel Down since the November 21 2022 High. Every Lower Lows since then has been very symmetrical on approximately a -6.05% drop from the Lower High. With the price currently on the top (Lower Highs trend-line) of the Channel Down, this is technically the most optimal level to sell. A -6.05% drop from the Lower High, gives us a 123.315 price target.
We must be careful however, especially ahead of the Fed Rate Decision, as the 1D RIS hasn been trading within a Channel Up, while the price is on a Channel Down, signalling a Bearish Divergence. A break above the Channel Up, and more importantly the last Lower High can push the price to the 1D MA50 (blue trend-line) on the short-term and if broken, then the 1D MA200 (orange trend-line) on the medium-term.
The long-term bearish trend shouldn't be affected by this so in that case we will be looking for the safest short entry on the top. Below you can see our long-term cheat-sheet on USDJPY:
-------------------------------------------------------------------------------
** Please LIKE 👍, FOLLOW ✅, SHARE 🙌 and COMMENT ✍ if you enjoy this idea! Also share your ideas and charts in the comments section below! **
-------------------------------------------------------------------------------
💸💸💸💸💸💸
👇 👇 👇 👇 👇 👇

FOREX/EQUITIES/COMMODITIES UPDATE!Hi Snipers,
Please refer to the recording for the next price levels and scenarios.
Thanks
MS

USD/JPY:Trading participants appear hesitant to make big bearishTrading in USD/JPY is restricted to a small range as investors eagerly anticipate the FOMC decision.
Throughout the early portion of Wednesday's European session, the USD/JPY pair struggles to generate any noticeable momentum and swings between tepid gains and modest losses. As traders look hesitant and anxiously await the results of a two-day FOMC monetary policy meeting, spot prices linger below the mid-130.00s. On Monday, the USD/JPY pair experiences some intraday selling at the 130.30 region and declines by more than 100 pip from the day's peak. However, spot prices are still firmly inside a trading range that dates back a week and have now appeared to have stabilized above the mid-129.00s during the early European session.
Fresh concern that high inflation may prompt a more hawkish posture from the Bank of Japan later this year is continuing to bolster the Japanese Yen (JPY). In addition, a generally negative outlook for the equities markets supports the safe-haven JPY. The USD/JPY pair has some downward pressure as a result, which adds to the overall adverse sentiment around the US Dollar and the intraday decline.
In fact, as expectations for a less aggressive Fed policy tightening increase, the USD Index, which measures the value of the dollar against a basket of currencies, is currently hovering close to a multi-month low.
The markets appear to be confident that the US central bank would moderate its aggressive approach and announce a lower 25 bps rate hike on Wednesday at the conclusion of a two-day meeting. This impacts on the USD and keeps US Treasury bond yields low.
Trading participants appear hesitant to make big bearish wagers on the USD/JPY pair as the significant central bank event risk approaches. In addition, remarks made by BoJ Governor Kuroda Haruhiko, who stated that the bank must maintain its loose monetary policy and 2% inflation objective, limit the JPY's upward potential. This calls for more care before positioning for any appreciable significant fall, at least initially.

USDJPY Potential DownsidesHey Traders, in today's trading session we are monitoring USDJPY for a selling opportunity around 130.6 zone, once we will receive any bearish confirmation the trade will be executed.
Trade safe, Joe.

USDJPY Weekly View - February 2023Hello Guys, Weekly Analysis is on the USDJPY Symbol in 4H Time frame, I Hope it Will be Useful for You, Don't Forget to Like, Follow, Comment

j.Hejazi | USDJPY Breakout PotentialUSDJPY may attempt to break out of the descending channel, facing resistance at 130.400 and the 12-hour 50 MA. If it successfully breaks out, this could signal the end of the downward move and the start of an upward trend.
----------------------
Let me know your thoughts in the comments, and show your support by liking the idea.
Please follow if you're interested in more ideas like this.
Your support is greatly appreciated!

230130 - CORRECTION - USD/JPY Price Action AnglesCorrection. I didn't realise I published the wrong view of the chart. And now also learned that Tradingview only allows for 15minutes to correct mistakes.
Recap:
USD-index #DXY is short long term.
JPY is long term.
USD/JPY is short long term.
Therefore:
The breakout will be in the direction of precious impulsive moves down.
Because USD is short and JPY is long, I was expecting this JPY-pair to produce the biggest move on all JPY-crosses.
Introduction
Last week, full of confidence I called a significant down-move on USD/JPY. It hasn't happened yet, while USD/JPY price action in the past week has been frustrating, insomuch that it is stuck.
But then; the longer the market congestion, the more violent the breakout.
In times like this when Price Action traders like to quote Munehisa Homma, "There are three market phases; buying, selling, and resting.", I would rather say that the resting period is the busiest time, because that’s when there is time to delve deeper into Price Action;
Price Action Angle
Is an analysis method in which the speed of buying or selling in a wave is measured.
For an up-move, we draw a straight line from a swingpoint-low, where a wave starts, to the swingpoint-high, where it ends, and visa versa for a down-move.
We measure this angle with the x-axis
In up-waves these angle may get steeper as time progresses, which means increased buying-pressure. And visa versa in down waves
Or if the angles are getting shallower, the buying/selling pressure is waning.
This means:
In congested zones: that a breakout becomes immanent in the direction of the steeper angles.
In trends: that the trend is intensifying, and blow outs become more likely.
Market Breadth;
It's a phrase I borrowed from the stock market. ‘Market Breadth’ is an indicator that measures the ratio between the number of advancing stocks, and number of declining stocks.
In FX Price Action analysis, you can measure the range of the rise and decline in each subsequent wave, and the time it takes to cover the range.
If the range is getting larger, the intensity of buying/selling is increasing, and visa versa if the range is getting smaller.
In the illustration, the market breadth is getting smaller. --- I didn’t even put it on the chart to avoid overloading the illustration. In ranging markets this may be an indication of immanent breakout, if the volume rises.
When we apply this to USD/JPY:
Firstly; This is a bad example because USD/JPY is currently a mixed bag of everything. It has no structure at all. Still, Price Action Angles can be deduced:
After the knock-back of 24 January, that down-waves are getting steeper - ever so slightly, and the up-waves are getting shallower - ever so slightly.
Last week I called an open at 130 and a stop at 131.00. This is still valid, and I’m still in the trade. Although now I would call an open at 131.00.
Other JPY-crosses proof more promising. EUR/JPY and CHF/JPY support the idea that the JPY is long (meaning USD/JPY should short, depending on USD) CHF/JPY is even close to breaking its congestion channel.
It’s just USD/JPY that’s holding on.

230130 - USD/JPY - Price Action Angles and Market BreadthIntroduction
In my post Last week, full of confidence I called a significant down-move on USD/JPY. It hasn't happened yet, while USD/JPY price action in the past week has been frustrating, insomuch that it is stuck.
But then; the longer the market congestion, the more violent the breakout.
In times like this when Price Action traders like to quote Munehisa Homma, "There are three market phases; buying, selling, and resting.", I would rather say that the resting period is the busiest time, because that’s when there is time to delve deeper into Price Action;
Recap:
USD-index #DXY is short long term.
JPY is long term.
USD/JPY is short long term.
Therefore:
The breakout will be in the direction of precious impulsive moves down.
Because USD is short and JPY is long, I was expecting this JPY-pair to produce the biggest move on all JPY-crosses.
Price Action Angle
Is an analysis method in which the speed of buying or selling in a wave is measured.
For an up-move, we draw a straight line from a swingpoint-low, where a wave starts, to the swingpoint-high, where it ends, and visa versa for a down-move.
We measure this angle with the x-axis
In up-waves these angle may get steeper as time progresses, which means increased buying-pressure. And visa versa in down waves
Or if the angles are getting shallower, the buying/selling pressure is waning.
This means:
In congested zones: that a breakout becomes immanent in the direction of the steeper angles.
In trends: that the trend is intensifying, and blow outs become more likely.
Market Breadth;
It's a phrase I borrowed from the stock market. ‘Market Breadth’ is an indicator that measures the ratio between the number of advancing stocks, and number of declining stocks.
In FX Price Action analysis, you can measure the range of the rise and decline in each subsequent wave, and the time it takes to cover the range.
If the range is getting larger, the intensity of buying/selling is increasing, and visa versa if the range is getting smaller.
In the illustration, the market breadth is getting smaller. --- I didn’t even put it on the chart to avoid overloading the illustration. In ranging markets this may be an indication of immanent breakout, if the volume rises.
When we apply this to USD/JPY:
Firstly; This is a bad example because USD/JPY is currently a mixed bag of everything. It has no structure at all. Still, Price Action Angles can be deduced:
After the knock-back of 24 January, that down-waves are getting steeper - ever so slightly, and the up-waves are getting shallower - ever so slightly.
Last week I called an open at 130 and a stop at 131.00. This is still valid, and I’m still in the trade. Although now I would call an open at 131.00.
Other JPY-crosses proof more promising. EUR/JPY and CHF/JPY support the idea that the JPY is long (meaning USD/JPY should short, depending on USD) CHF/JPY is even close to breaking its congestion channel.
It’s just USD/JPY that’s holding on.

USDJPY (BULLISH) LONG BIAS!Hello all!
This pair looks interesting for next week! I have a LTF POI marked where i will watch and monitor the price of UJ before buying!
I am long-term bullish on this pair, however like i mentioned, in the case of price breaking below 126. The next monthly demand is down near 116!!
However, my projection is showing long, and until this monthly Demand Zone breaks, i will not think of selling UJ
Take care!

USDJPY Long After a Break of the Confluence Zone at 131 🦐Based on the 4 hour timeframe, the USDJPY pair is currently in a bearish trend, as evidenced by its price action inside a descending channel.
The market has recently tested the upper trendline of the descending channel with equal highs and rising lows, this could indicate a potential bullish reversal and a shift from bearish to bullish momentum.
The price of USDJPY was rejected by the daily resistance at the 131 level and tested the 50% level of the Fibonacci retracement, this could indicate that the bears are still in control of the market, but the bulls may be trying to regain momentum.
We can consider trading a long order on USDJPY, after a break of the resistance zone at the 131 level, confirm the clear break above the confluence zone, and set a position according to the Plancton's strategy.
Using multiple timeframes, and tools can help validate the trade setup and adjust your trade as needed.

USDJPY: Reached the top of the Channel. Rejection possible.The USDJPY pair has reached the top of the Channel Down after a a rebound two weeks ago near both its bottom and Support 1. The 1D technicals remain bearish (RSI = 43.265, MACD = -1.260, ADX = 20.176) prompting to a continuation of this downward trend.
The short-term target is Support 1, with a break below it capable of inflicting an extension as low as the bottom of the Channel Down. In the same way, a break above the Channel Down is technically capable of testing the 134.475 - 134.750 Resistance Zone where a Double Top wa previously formed, or at least the 1D MA50, which has been unbroken since November 10th.
The RSI's Rectangle can be a guide for buying/ selling inside the Channel Down.
## If you like our free content follow our profile to get more daily ideas. ##
## Comments and likes are greatly appreciated. ##

USD/JPY USD/JPY
Time frame:4H
well,i use in this technical analys the ict systems and fibo
we see that blocks on 4h time frame ,there are mitigation blocks that the price retested every time ,
Also,we will wait for a retest of the area between 133.800 and 134.134 ,
If he could penetrate that area with a volume , we can reached the second goal 136.500 ,
otherwise we will comeback to area between 128.000 and 127.500
This analysis remains my own analysis and not investment advice

usdjpyThe price is reaching a static resistance and reaching the ceiling of the long-term down trend, and there is also a divergence in the price.....

USDJPY short term analsyis 🦐USD/JPY on the 4-hour timeframe is currently testing a key resistance level. The recent low in price has established a support level, which suggests that we can see a short-term bullish momentum.
A break above the resistance level would be a buying signal if the strategy will be satisfied.
Traders should watch for a bullish candle such as a long green candle, which would confirm the breakout and further support at the bullish outlook.
A series of rising lows and equal highs can indicate that the price is building momentum to the upside.
This signals that buyers are becoming more aggressive and that the bulls are pushing the price higher. A break above the resistance level would indicate that a bullish short-term momentum can happen.

USDJPY Potential for Bearish Drop towards previous swing lowLooking at the H4 chart, my overall bias for USDJPY is bearish due to the current price crossing below the Ichimoku cloud, indicating a bearish market structure. Looking for a pullback sell entry at 130.018, where the overlap resistance and 38.2% Fibonacci line is. Stop loss will be at 131.115, where the recent swing high is. Take profit will be at 127.215, where the previous swing low was.
Please be advised that the information presented on TradingView is provided to Vantage (‘Vantage Global Limited’, ‘we’) by a third-party provider (‘Everest Fortune Group’). Please be reminded that you are solely responsible for the trading decisions on your account. There is a very high degree of risk involved in trading. Any information and/or content is intended entirely for research, educational and informational purposes only and does not constitute investment or consultation advice or investment strategy. The information is not tailored to the investment needs of any specific person and therefore does not involve a consideration of any of the investment objectives, financial situation or needs of any viewer that may receive it. Kindly also note that past performance is not a reliable indicator of future results. Actual results may differ materially from those anticipated in forward-looking or past performance statements. We assume no liability as to the accuracy or completeness of any of the information and/or content provided herein and the Company cannot be held responsible for any omission, mistake nor for any loss or damage including without limitation to any loss of profit which may arise from reliance on any information supplied by Everest Fortune Group.
