Falling towards overlap support?USD/JPY is falling towards the support level which is an overlap support that aligns with the 61.8% Fibonacci retracement and the 138.2% Fibonacci extension and could bounce from this level to our take profit.
Entry: 149.59
Why we like it:
There is an overlap support level that aligns with the 61.8% Fibonacci retracement and the 138.2% Fibonacci extension.
Stop loss: 149.21
Why we like it:
There is a pullback support level that lines up with the 78.6% Fibonacci retracement.
Take profit: 150.11
Why we like it:
There is a pullback resistance level.
Enjoying your TradingView experience? Review us!
Please be advised that the information presented on TradingView is provided to Vantage (‘Vantage Global Limited’, ‘we’) by a third-party provider (‘Everest Fortune Group’). Please be reminded that you are solely responsible for the trading decisions on your account. There is a very high degree of risk involved in trading. Any information and/or content is intended entirely for research, educational and informational purposes only and does not constitute investment or consultation advice or investment strategy. The information is not tailored to the investment needs of any specific person and therefore does not involve a consideration of any of the investment objectives, financial situation or needs of any viewer that may receive it. Kindly also note that past performance is not a reliable indicator of future results. Actual results may differ materially from those anticipated in forward-looking or past performance statements. We assume no liability as to the accuracy or completeness of any of the information and/or content provided herein and the Company cannot be held responsible for any omission, mistake nor for any loss or damage including without limitation to any loss of profit which may arise from reliance on any information supplied by Everest Fortune Group.
Usd-jpy

Bearish drop off overlap resistance?USD/JPY is reacting off the pivot and could drop to the 1st support which has been identified as an overlap support.
Pivot: 151.23
1st Support: 149.91
1st Resistance: 152.23
Risk Warning:
Trading Forex and CFDs carries a high level of risk to your capital and you should only trade with money you can afford to lose. Trading Forex and CFDs may not be suitable for all investors, so please ensure that you fully understand the risks involved and seek independent advice if necessary.
Disclaimer:
The above opinions given constitute general market commentary, and do not constitute the opinion or advice of IC Markets or any form of personal or investment advice.
Any opinions, news, research, analyses, prices, other information, or links to third-party sites contained on this website are provided on an "as-is" basis, are intended only to be informative, is not an advice nor a recommendation, nor research, or a record of our trading prices, or an offer of, or solicitation for a transaction in any financial instrument and thus should not be treated as such. The information provided does not involve any specific investment objectives, financial situation and needs of any specific person who may receive it. Please be aware, that past performance is not a reliable indicator of future performance and/or results. Past Performance or Forward-looking scenarios based upon the reasonable beliefs of the third-party provider are not a guarantee of future performance. Actual results may differ materially from those anticipated in forward-looking or past performance statements. IC Markets makes no representation or warranty and assumes no liability as to the accuracy or completeness of the information provided, nor any loss arising from any investment based on a recommendation, forecast or any information supplied by any third-party.

USD/JPY(20250326)Today's AnalysisToday's buying and selling boundaries:
150.12
Support and resistance levels:
151.50
150.98
150.65
149.59
149.25
148.73
Trading strategy:
If the price breaks through 150.12, consider buying, the first target price is 150.65
If the price breaks through 149.59, consider selling, the first target price is 149.25

Bearish drop?USD/JPY is rising towards the resistance level which is a pullback resistance that lines up with the 50% Fibonacci retracement and could reverse from this level to our take profit.
Entry: 150.14
Why we like it:
There is a pullback resistance level that lines up with the 50% Fibonacci retracement.
Stop loss: 150.92
Why we like it:
There is a pullback resistance level.
Take profit: 148.97
Why we like it:
There is a pullback support that is slightly below the 78.6% Fibonacci retracement.
Enjoying your TradingView experience? Review us!
Please be advised that the information presented on TradingView is provided to Vantage (‘Vantage Global Limited’, ‘we’) by a third-party provider (‘Everest Fortune Group’). Please be reminded that you are solely responsible for the trading decisions on your account. There is a very high degree of risk involved in trading. Any information and/or content is intended entirely for research, educational and informational purposes only and does not constitute investment or consultation advice or investment strategy. The information is not tailored to the investment needs of any specific person and therefore does not involve a consideration of any of the investment objectives, financial situation or needs of any viewer that may receive it. Kindly also note that past performance is not a reliable indicator of future results. Actual results may differ materially from those anticipated in forward-looking or past performance statements. We assume no liability as to the accuracy or completeness of any of the information and/or content provided herein and the Company cannot be held responsible for any omission, mistake nor for any loss or damage including without limitation to any loss of profit which may arise from reliance on any information supplied by Everest Fortune Group.

USD/JPY(20250325)Today's AnalysisToday's buying and selling boundaries:
150.25
Support and resistance levels:
151.62
151.11
150.78
149.73
149.40
148.89
Trading strategy:
If the price breaks through 150.78, consider buying, the first target price is 151.11
If the price breaks through 150.25, consider selling, the first target price is 149.73

Weekly Analysis for Week 13 2025!Hello fellow traders , my regular and new friends!
Did you managed to get some pips from EURUSD before the mid week reversal ?
Or did you catch some pips from EJ as well?
No? Missed out on it? No worries, check out my trading analysis for next week (week 13) to get some insights and tips for the potential moves in the Forex market!
Do Like and Boost if you have learnt something and enjoyed the content, thank you!
-- Get the right tools and an experienced Guide, you WILL navigate your way out of this "Dangerous Jungle"! --
*********************************************************************
Disclaimers:
The analysis shared through this channel are purely for educational and entertainment purposes only. They are by no means professional advice for individual/s to enter trades for investment or trading purposes.
*********************************************************************

USD/JPY(20250324)Today's AnalysisToday's buying and selling boundaries:
149.18
Support and resistance levels:
150.25
149.85
148.59
148.77
148.51
148.11
Trading strategy:
If the price breaks through 148.59, consider buying, the first target price is 149.85
If the price breaks through 149.18, consider selling, the first target price is 148.77

Potential bearish reversal?USD/JPY is rising towards the pivot and could reverse to the 1st support which has been identified as an overlap support.
Pivot: 151.21
1st Support: 146.92
1st Resistance: 154.40
Risk Warning:
Trading Forex and CFDs carries a high level of risk to your capital and you should only trade with money you can afford to lose. Trading Forex and CFDs may not be suitable for all investors, so please ensure that you fully understand the risks involved and seek independent advice if necessary.
Disclaimer:
The above opinions given constitute general market commentary, and do not constitute the opinion or advice of IC Markets or any form of personal or investment advice.
Any opinions, news, research, analyses, prices, other information, or links to third-party sites contained on this website are provided on an "as-is" basis, are intended only to be informative, is not an advice nor a recommendation, nor research, or a record of our trading prices, or an offer of, or solicitation for a transaction in any financial instrument and thus should not be treated as such. The information provided does not involve any specific investment objectives, financial situation and needs of any specific person who may receive it. Please be aware, that past performance is not a reliable indicator of future performance and/or results. Past Performance or Forward-looking scenarios based upon the reasonable beliefs of the third-party provider are not a guarantee of future performance. Actual results may differ materially from those anticipated in forward-looking or past performance statements. IC Markets makes no representation or warranty and assumes no liability as to the accuracy or completeness of the information provided, nor any loss arising from any investment based on a recommendation, forecast or any information supplied by any third-party.

Bearish reversal off pullback resistance?USD/JPY is rising towards the resistance level that is a pullback resistance and could reverse from this level to our take profit.
Entry: 149.68
Why we like it:
There is a pullback resistance level which is a pullback resistance.
Stop loss: 150.16
Why we like it:
There is a pullback resistance level that line sup wit the 138.2% Fibonacci extension.
Take profit: 148.96
Why we like it:
There is a pullback support level.
Enjoying your TradingView experience? Review us!
Please be advised that the information presented on TradingView is provided to Vantage (‘Vantage Global Limited’, ‘we’) by a third-party provider (‘Everest Fortune Group’). Please be reminded that you are solely responsible for the trading decisions on your account. There is a very high degree of risk involved in trading. Any information and/or content is intended entirely for research, educational and informational purposes only and does not constitute investment or consultation advice or investment strategy. The information is not tailored to the investment needs of any specific person and therefore does not involve a consideration of any of the investment objectives, financial situation or needs of any viewer that may receive it. Kindly also note that past performance is not a reliable indicator of future results. Actual results may differ materially from those anticipated in forward-looking or past performance statements. We assume no liability as to the accuracy or completeness of any of the information and/or content provided herein and the Company cannot be held responsible for any omission, mistake nor for any loss or damage including without limitation to any loss of profit which may arise from reliance on any information supplied by Everest Fortune Group.

USDJPY Potential DownsidesHey Traders, in today's trading session we are monitoring USDJPY for a selling opportunity around 149.500 zone, USDJPY is trading in a downtrend and currently is in a correction phase in which it is approaching the trend at 149.500 support and resistance area.
Trade safe, Joe.

USDJPY: Critical moment for the 2 month Channel Down.USDJPY is neutral on its 1D technical outlook (RSI = 46.506, MACD = -0.960, ADX = 25.882) as it is on the tightest range possible between the 4H MA50 and 4H MA200. This consolidation is taking place at the top of the 2 month Channel Down. As long as it holds, the trade is short, aiming for a -3.20% bearish wave (TP = 145.500). If the price crosses above the 4H MA200 though, go long, aiming for the R1 level (TP = 154.835).
## If you like our free content follow our profile to get more daily ideas. ##
## Comments and likes are greatly appreciated. ##

Bullish rise?USD/JPY has reacted off the pivot and could rise to the 1st resistance.
Pivot: 148.96
1st Support: 148.34
1st Resistance: 149.97
Risk Warning:
Trading Forex and CFDs carries a high level of risk to your capital and you should only trade with money you can afford to lose. Trading Forex and CFDs may not be suitable for all investors, so please ensure that you fully understand the risks involved and seek independent advice if necessary.
Disclaimer:
The above opinions given constitute general market commentary, and do not constitute the opinion or advice of IC Markets or any form of personal or investment advice.
Any opinions, news, research, analyses, prices, other information, or links to third-party sites contained on this website are provided on an "as-is" basis, are intended only to be informative, is not an advice nor a recommendation, nor research, or a record of our trading prices, or an offer of, or solicitation for a transaction in any financial instrument and thus should not be treated as such. The information provided does not involve any specific investment objectives, financial situation and needs of any specific person who may receive it. Please be aware, that past performance is not a reliable indicator of future performance and/or results. Past Performance or Forward-looking scenarios based upon the reasonable beliefs of the third-party provider are not a guarantee of future performance. Actual results may differ materially from those anticipated in forward-looking or past performance statements. IC Markets makes no representation or warranty and assumes no liability as to the accuracy or completeness of the information provided, nor any loss arising from any investment based on a recommendation, forecast or any information supplied by any third-party.

USD/JPY(20250321)Today's AnalysisToday's buying and selling boundaries:
148.63
Support and resistance levels:
149.40
149.11
148.92
148.33
148.14
147.85
Trading strategy:
If the price breaks through 148.92, consider buying, the first target price is 149.11
If the price breaks through 148.63, consider selling, the first target price is 148.33

Heading into overlap resistance?USD/JPY is rising towards the resistance level which is an overlap resistance that lines up with the 50% Fibonacci retracement and could reverse from this level to our take profit.
Entry: 149.13
Why we like it:
There is an overlap resistance level that line sup with the 50% Fibonacci retracement.
Stop loss: 149.83
Why we like it:
There is a pullback resistance level that is slightly above the 78.6% Fibonacci retracement.
Take profit: 148.19
Why we like it:
There is a pullback support level.
Enjoying your TradingView experience? Review us!
Please be advised that the information presented on TradingView is provided to Vantage (‘Vantage Global Limited’, ‘we’) by a third-party provider (‘Everest Fortune Group’). Please be reminded that you are solely responsible for the trading decisions on your account. There is a very high degree of risk involved in trading. Any information and/or content is intended entirely for research, educational and informational purposes only and does not constitute investment or consultation advice or investment strategy. The information is not tailored to the investment needs of any specific person and therefore does not involve a consideration of any of the investment objectives, financial situation or needs of any viewer that may receive it. Kindly also note that past performance is not a reliable indicator of future results. Actual results may differ materially from those anticipated in forward-looking or past performance statements. We assume no liability as to the accuracy or completeness of any of the information and/or content provided herein and the Company cannot be held responsible for any omission, mistake nor for any loss or damage including without limitation to any loss of profit which may arise from reliance on any information supplied by Everest Fortune Group.

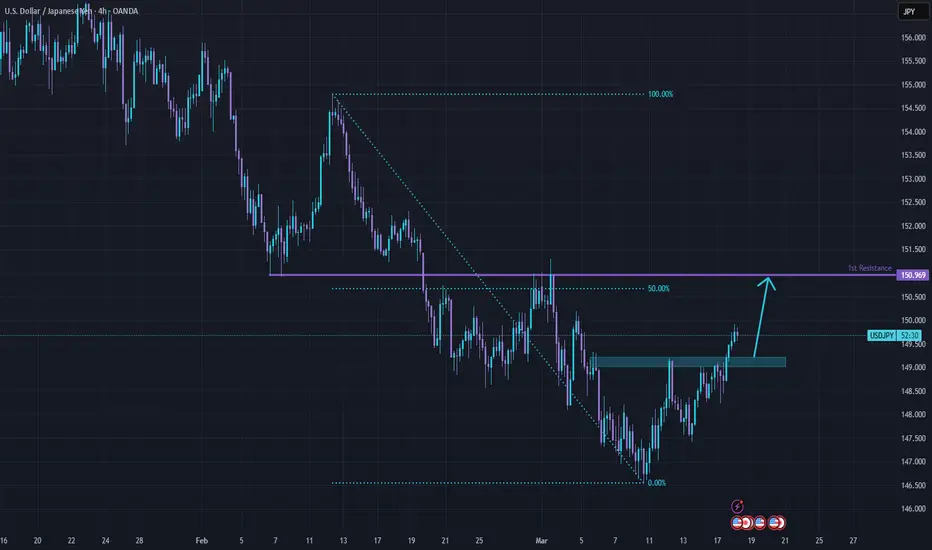
USDJPY - Fake BreakdownHello Traders !
The USDJPY failed to break the support level (149.356 - 148.639).
Currently, The resistance line is broken !
So, I expect a bullish move📈
_______________
TARGET: 150.580🎯

USDJPY Breakout And Potential RetraceHey Traders, in today's trading session we are monitoring USDJPY for a selling opportunity around 149.300 zone, USDJPY was trading in an uptrend and successfully managed to break it out. Currently is in a correction phase in which it is approaching the retrace area at 149.300 support and resistance area.
Trade safe, Joe.

Bearish drop?USD/JPY is reacting off the resistance level which is a pullback resistance that aligns with the 127.2% Fibonacci extension and the 61.8% Fibonacci retracement and could reverse from this level to our take profit.
Entry: 149.44
Why we like it:
There is a pullback resistance level that aligns with the 127.2% Fibonacci extension and the 61.8 Fibonacci retracement.
Stop loss: 150.97
Why we like it:
There is an overlap resistance level that is slightly above the 50% Fibonacci retracement.
Take profit: 147.54
Why we like it:
There is a pullback support level.
Enjoying your TradingView experience? Review us!
Please be advised that the information presented on TradingView is provided to Vantage (‘Vantage Global Limited’, ‘we’) by a third-party provider (‘Everest Fortune Group’). Please be reminded that you are solely responsible for the trading decisions on your account. There is a very high degree of risk involved in trading. Any information and/or content is intended entirely for research, educational and informational purposes only and does not constitute investment or consultation advice or investment strategy. The information is not tailored to the investment needs of any specific person and therefore does not involve a consideration of any of the investment objectives, financial situation or needs of any viewer that may receive it. Kindly also note that past performance is not a reliable indicator of future results. Actual results may differ materially from those anticipated in forward-looking or past performance statements. We assume no liability as to the accuracy or completeness of any of the information and/or content provided herein and the Company cannot be held responsible for any omission, mistake nor for any loss or damage including without limitation to any loss of profit which may arise from reliance on any information supplied by Everest Fortune Group.

Bullish momentum to extend?USD/JPY has reacted of the resistance level which is a pullback resistance and could potentially rise from this level to the upside.
Bearish reversal?USD/JPY is rising towards the resistance level which is an overlap resistance that aligns with the 61.8% Fibonacci retracement and the 127.2% Fibonacci extension and could reverse from this level to our take profit.
Entry: 149.44
Why we like it:
There is an overlap resistance level that aligns with the 61.8% Fibonacci retracement and the 127.2% Fibonacci extension.
Stop loss: 150.97
Why we like it:}
There is an overlap resistance level that is slightly above the 50% Fibonacci retracement.
Take profit: 147.54
Why we like it:
There is a pullback support level.
Enjoying your TradingView experience? Review us!
Please be advised that the information presented on TradingView is provided to Vantage (‘Vantage Global Limited’, ‘we’) by a third-party provider (‘Everest Fortune Group’). Please be reminded that you are solely responsible for the trading decisions on your account. There is a very high degree of risk involved in trading. Any information and/or content is intended entirely for research, educational and informational purposes only and does not constitute investment or consultation advice or investment strategy. The information is not tailored to the investment needs of any specific person and therefore does not involve a consideration of any of the investment objectives, financial situation or needs of any viewer that may receive it. Kindly also note that past performance is not a reliable indicator of future results. Actual results may differ materially from those anticipated in forward-looking or past performance statements. We assume no liability as to the accuracy or completeness of any of the information and/or content provided herein and the Company cannot be held responsible for any omission, mistake nor for any loss or damage including without limitation to any loss of profit which may arise from reliance on any information supplied by Everest Fortune Group.

USDJPY Channel Down to make an important decision.The USDJPY pair has been trading within a Channel Down pattern since the January 10 High. During that time it technically got rejection upon every 4H MA100 (green trend-line) contact or close contact into a new Bearish Leg.
Three out of those four Bearish Legs have been -3.16% so even if a rejection does happen at the top (Lower Highs trend-line) of the Channel Down, you can still be expecting 145.350 as a Target.
If however the 4H RSI Bullish Divergence on Higher Lows prevails and causes the price to break above the Channel Down, we will accept the small loss on the short and go long instead, targeting the 2.0 Fibonacci extension at 156.000. A lower Target in that scenario can also be Resistance 2 (154.800).
-------------------------------------------------------------------------------
** Please LIKE 👍, FOLLOW ✅, SHARE 🙌 and COMMENT ✍ if you enjoy this idea! Also share your ideas and charts in the comments section below! This is best way to keep it relevant, support us, keep the content here free and allow the idea to reach as many people as possible. **
-------------------------------------------------------------------------------
Disclosure: I am part of Trade Nation's Influencer program and receive a monthly fee for using their TradingView charts in my analysis.
💸💸💸💸💸💸
👇 👇 👇 👇 👇 👇

Potential bullish rise?USD/JPY has bounced off the pivot which has been identified as an overlap support and could rise to the 1st resistance.
Pivot: 148.14
1st Support: 147.58
1st Resistance: 149.25
Risk Warning:
Trading Forex and CFDs carries a high level of risk to your capital and you should only trade with money you can afford to lose. Trading Forex and CFDs may not be suitable for all investors, so please ensure that you fully understand the risks involved and seek independent advice if necessary.
Disclaimer:
The above opinions given constitute general market commentary, and do not constitute the opinion or advice of IC Markets or any form of personal or investment advice.
Any opinions, news, research, analyses, prices, other information, or links to third-party sites contained on this website are provided on an "as-is" basis, are intended only to be informative, is not an advice nor a recommendation, nor research, or a record of our trading prices, or an offer of, or solicitation for a transaction in any financial instrument and thus should not be treated as such. The information provided does not involve any specific investment objectives, financial situation and needs of any specific person who may receive it. Please be aware, that past performance is not a reliable indicator of future performance and/or results. Past Performance or Forward-looking scenarios based upon the reasonable beliefs of the third-party provider are not a guarantee of future performance. Actual results may differ materially from those anticipated in forward-looking or past performance statements. IC Markets makes no representation or warranty and assumes no liability as to the accuracy or completeness of the information provided, nor any loss arising from any investment based on a recommendation, forecast or any information supplied by any third-party.

Bullish bounce?USD/JPY is falling towards the support level which is an overlap support that aligns with the 127.2% Fibonacci extension and the 71% Fibonacci retracement and could bounce from this level to our take profit.
Entry: 147.31
Why we like it:
There is an overlap support level that aligns with the 127.2% Fibonacci extension and the 71% Fibonacci retracement.
Stop loss: 146.54
Why we like it:
There is a pullback support level.
Take profit: 148.14
Why we like it:
There is a pullback resistance level.
Enjoying your TradingView experience? Review us!
Please be advised that the information presented on TradingView is provided to Vantage (‘Vantage Global Limited’, ‘we’) by a third-party provider (‘Everest Fortune Group’). Please be reminded that you are solely responsible for the trading decisions on your account. There is a very high degree of risk involved in trading. Any information and/or content is intended entirely for research, educational and informational purposes only and does not constitute investment or consultation advice or investment strategy. The information is not tailored to the investment needs of any specific person and therefore does not involve a consideration of any of the investment objectives, financial situation or needs of any viewer that may receive it. Kindly also note that past performance is not a reliable indicator of future results. Actual results may differ materially from those anticipated in forward-looking or past performance statements. We assume no liability as to the accuracy or completeness of any of the information and/or content provided herein and the Company cannot be held responsible for any omission, mistake nor for any loss or damage including without limitation to any loss of profit which may arise from reliance on any information supplied by Everest Fortune Group.

Falling towards 50% Fibonacci support?USD/JPY is falling towards the support level which is a pullback support that aligns with the 50% Fibonacci retracement and could bunce from this level to our take profit.
Entry: 148.03
Why we like it:
There is a pullback support level that aligns with the 50% Fibonacci retracement.
Stop loss: 149.23
Why we like it:
There is a pullback support level that lines up with he 78.6% Fibonacci retracement.
Take profit: 149.23
Why we like it:
There is a pullback resistance level.
Enjoying your TradingView experience? Review us!
Please be advised that the information presented on TradingView is provided to Vantage (‘Vantage Global Limited’, ‘we’) by a third-party provider (‘Everest Fortune Group’). Please be reminded that you are solely responsible for the trading decisions on your account. There is a very high degree of risk involved in trading. Any information and/or content is intended entirely for research, educational and informational purposes only and does not constitute investment or consultation advice or investment strategy. The information is not tailored to the investment needs of any specific person and therefore does not involve a consideration of any of the investment objectives, financial situation or needs of any viewer that may receive it. Kindly also note that past performance is not a reliable indicator of future results. Actual results may differ materially from those anticipated in forward-looking or past performance statements. We assume no liability as to the accuracy or completeness of any of the information and/or content provided herein and the Company cannot be held responsible for any omission, mistake nor for any loss or damage including without limitation to any loss of profit which may arise from reliance on any information supplied by Everest Fortune Group.
