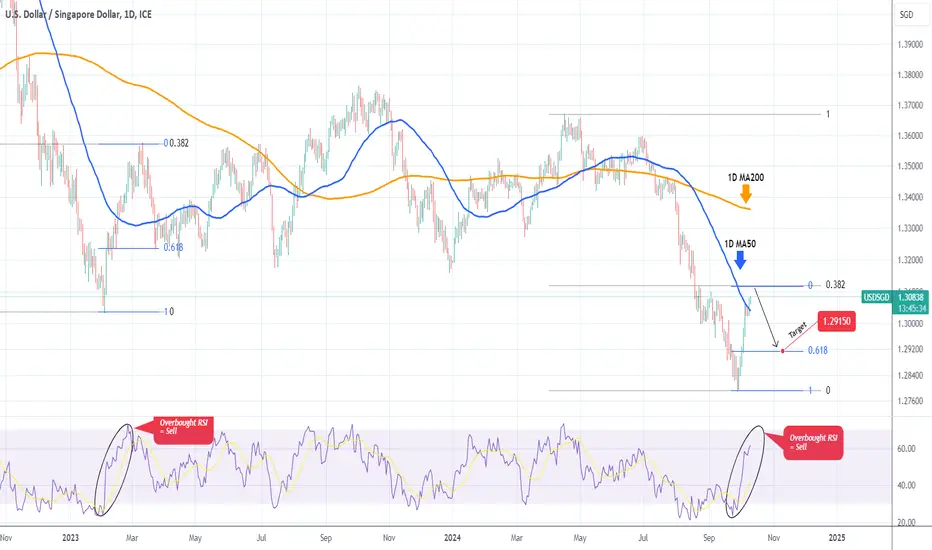
USDSGD Time to sell this rally.The USDSGD pair has been rebounding non-stop since the September 27 bottom and yesterday broke above its 1D MA50 (blue trend-line) for the first time in more than 3 months (since July 04). This confirmed that the correction since July is over but with the 1D RSI above 60.00 and heading towards the overbought barrier (70.00), we expect a rejection there.
In fact, there was a similar fractal that was rejected on March 10 2023, on the correction's 0.382 Fibonacci retracement level a little after the 1D RSI turned overbought. This resulted into a test of the 0.618 Fib of the rebound Leg.
As a result, we are expecting a rejection on the 0.382 Fib or when the 1D RSI gets overbought above 70.00 and our Target is the 0.618 Fib at 1.29150.
-------------------------------------------------------------------------------
** Please LIKE 👍, FOLLOW ✅, SHARE 🙌 and COMMENT ✍ if you enjoy this idea! Also share your ideas and charts in the comments section below! This is best way to keep it relevant, support us, keep the content here free and allow the idea to reach as many people as possible. **
-------------------------------------------------------------------------------
💸💸💸💸💸💸
👇 👇 👇 👇 👇 👇
Usd-sgd
USDSGD Buy signal at the bottom of a Channel Down.The USDSGD pair has been trading within a Channel Down pattern since the April 16 2024 High and today almost touched its bottom (Lower Lows trend-line). That is a technical short-term buy opportunity towards its top (Lower Highs trend-line).
The previous Bullish Leg of the pattern registered a +1.31% rise. Our Target is slightly lower than a new potential rise of this magnitude at 1.35000.
-------------------------------------------------------------------------------
** Please LIKE 👍, FOLLOW ✅, SHARE 🙌 and COMMENT ✍ if you enjoy this idea! Also share your ideas and charts in the comments section below! This is best way to keep it relevant, support us, keep the content here free and allow the idea to reach as many people as possible. **
-------------------------------------------------------------------------------
💸💸💸💸💸💸
👇 👇 👇 👇 👇 👇

USDSGD Bullish unless this Support breaks.The USDSGD pair is on the 1D MA50 (blue trend-line) currently but within conflicting Channels. The long-term one is a Channel Up that hasn't yet been invalidated, the medium term one a Channel Down and the shortest term a Channel Up.
As long as Support 1 (1.34225) holds, we will go with the short-term Channel Up and stay bullish, targeting 1.37250, which will be a Lower High on the medium-term Channel Down. If on the other hand, Support 1 breaks, we will take the loss and go short instead, targeting 1.32725 (Support 2).
-------------------------------------------------------------------------------
** Please LIKE 👍, FOLLOW ✅, SHARE 🙌 and COMMENT ✍ if you enjoy this idea! Also share your ideas and charts in the comments section below! This is best way to keep it relevant, support us, keep the content here free and allow the idea to reach as many people as possible. **
-------------------------------------------------------------------------------
💸💸💸💸💸💸
👇 👇 👇 👇 👇 👇

USDSGD Still a buy but not for long.The USDSGD pair has been trading within a Channel Up pattern (blue) since the February 02 2023 Low but on December 28 2023 it posted a Lower Low, so we have to consider the possibility of an emerging (dotted) Channel Down.
As a result, the trend remains bullish but technically we should be careful and only target the top of Channel Down at 1.37350 (symmetrical Bullish Leg at +4.49%).
-------------------------------------------------------------------------------
** Please LIKE 👍, FOLLOW ✅, SHARE 🙌 and COMMENT ✍ if you enjoy this idea! Also share your ideas and charts in the comments section below! This is best way to keep it relevant, support us, keep the content here free and allow the idea to reach as many people as possible. **
-------------------------------------------------------------------------------
💸💸💸💸💸💸
👇 👇 👇 👇 👇 👇

USDSGD Strong bullish signal above the 1D MA200It's been again a long time since we traded the USDSGD pair (October 03 2023, see chart below) but it did manage to give us a low risk sell opportunity:
The price hit today the 1D MA200 (orange trend-line) for the first time in exactly 2 months (since November 17). That is a major pressure level as it is also exactly where Resistance 1 (1.34550) is. The long-term pattern is a Channel Up and technically this is the 3rd Bullish Leg. The previous two rose by more than +4.00% but the 2nd made a temporary pause at +3.44%.
That is our 1D MA200 break-out target and it interestingly falls almost exactly on Resistance 2. We are targeting 1.36100 but if the 1D MACD forms a Bearish Cross earlier, we will the the profit on that market price.
-------------------------------------------------------------------------------
** Please LIKE 👍, FOLLOW ✅, SHARE 🙌 and COMMENT ✍ if you enjoy this idea! Also share your ideas and charts in the comments section below! This is best way to keep it relevant, support us, keep the content here free and allow the idea to reach as many people as possible. **
-------------------------------------------------------------------------------
💸💸💸💸💸💸
👇 👇 👇 👇 👇 👇

Usdsgd still bearish bias Hello fellow traders , my regular and new friends!
Welcome and thanks for dropping by my post.
Last week, i mentioned about USDSGD having to make more downwards movement (in my tradingview stream), this coming week i believe it would be the same considering the break of the support and currently just tested and seems rejecting it.
Let's see how it unfolds next week.
Do Like and Boost if you have learnt something and enjoyed the content, thank you!
-- Get the right tools and an experienced Guide, you WILL navigate your way out of this "Dangerous Jungle"! --
*********************************************************************
Disclaimers:
The analysis shared through this channel are purely for educational and entertainment purposes only. They are by no means professional advice for individual/s to enter trades for investment or trading purposes.
*********************************************************************

USDSGD: Breakout supported by the 4H MA50.USDSGD is trading inside a Channel Up pattern on the 4H timeframe, on a bullish technical outlook both on the 4H and 1D charts (RSI = 57.738, MACD = 0.002, ADX = 20.427). Yesterday it crossed over the LH trendline and has up to now stayed supported on the 4H MA50. The 4H MACD Bullish Cross has originated this breakout and it appears that it is fairly symmetric with the one in September. Both around the 0.5 Fibonacci level. As such, we turn bullish and target Fibonacci 1.236 (TP = 1.3800).
## If you like our free content follow our profile to get more daily ideas. ##
## Comments and likes are greatly appreciated. ##

Long USDSGDIt appears that USDSGD may be setting up for a multi-day bull run.
Last week USDSGD posted a green weekly Heiken Ashi candle and I suspect it may do it again.
It is also the case that USDSGD posted a green daily Heiken Ashi candle after multiple red Heiken Ashi candles on the daily.
This signals to me that we may be in for a bull run this week.

USDSGD Triangle break-out. Buy signal.Last time we looked at the USDSGD pair (October 11 2022) we gave the best sell signal possible (see idea below) as the price entered the 6 year Resistance Zone:
This time we have a buy signal flashing as the price not only broke above the Triangle pattern on the 1D time-frame but also above the 1D MA50 (blue trend-line). As long as Support 1 holds, we are bullish targeting 1.35500. If Support 1 breaks (1.32050), we will book the loss and open a sell, targeting 1.30550.
-------------------------------------------------------------------------------
** Please LIKE 👍, FOLLOW ✅, SHARE 🙌 and COMMENT ✍ if you enjoy this idea! Also share your ideas and charts in the comments section below! **
-------------------------------------------------------------------------------
💸💸💸💸💸💸
👇 👇 👇 👇 👇 👇

USDSGD Reaching a key level to watch**Find out more from my Tradingview Stream this week**
***************************************************************************************
Hello there!
If you like my analysis and it helped you ,do give me a thumbs ups on tradingview! 🙏
And if you would like to show further support for me, you can gift me some coins on tradingview! 😁
Thank you!
Disclaimers:
The analysis shared through this channel are purely for educational and entertainment purposes only. They are by no means professional advice for individual/s to enter trades for investment or trading purposes.
The author/producer of these content shall not and will not be responsible for any form of financial/physical/assets losses incurred from trades executed from the derived conclusion of the individual from these content shared.
Thank you, and please do your due diligence before any putting on any trades!

usdsgd a down trend It is down on the daily and h4 timeframe..just look for setup to go short.
Hello there!
If you like my analysis and it helped you ,do give me a thumbs ups on tradingview! 🙏
And if you would like to show further support for me, you can gift me some coins on tradingview! 😁
Thank you!
Disclaimers:
The analysis shared through this channel are purely for educational and entertainment purposes only. They are by no means professional advice for individual/s to enter trades for investment or trading purposes.
The author/producer of these content shall not and will not be responsible for any form of financial/physical/assets losses incurred from trades executed from the derived conclusion of the individual from these content shared.
Thank you, and please do your due diligence before any putting on any trades!

Shorting the USD/SGD; 0.5% of portfolio risk.One of our investment programs have shorted a few USD-related exchange-traded derivatives, including A-book CFDs (with Global Prime).
In the very short-term, with very risk-adjusted positions, we are entering long in equities, shorting the USD, and executing other correlated positions with a portfolio hedge of 30%.
We have this position both in our systematic, algorithmic trend-following programs as well as a global discretionary one.
Position:
SS: 1.3111
GTSL: 1.3180
TP: 1.2860
Our risk algos can modify the weight of the position if needed in the future.

USDSGD, long position, H4 intervalI expect a breakout of the designated resistance and an upward move.
The green last weekly candle also indicates future growth (I think).
TP around 1.3750
GG
P.S. This is not financial advice of course, just my idea.

Usdsgd having more bearish toneMore downside to come?
**Find out more from my Tradingview Stream this week**
***************************************************************************************
Hello there!
If you like my analysis and it helped you ,do give me a thumbs ups on tradingview! 🙏
And if you would like to show further support for me, you can gift me some coins on tradingview! 😁
Thank you!
Disclaimers:
The analysis shared through this channel are purely for educational and entertainment purposes only. They are by no means professional advice for individual/s to enter trades for investment or trading purposes.
The author/producer of these content shall not and will not be responsible for any form of financial/physical/assets losses incurred from trades executed from the derived conclusion of the individual from these content shared.
Thank you, and please do your due diligence before any putting on any trades!

USDSGD Entered its 6 year Resistance Zone.The USDSGD pair has entered a Resistance Zone where it has made long-term tops and got rejected since January 2016. Even if the long-term pattern is a Channel Up, technically there isn't much room for further growth before a correction near the 0.786 Fibonacci retracement level at least.
It is interesting to see also that all rejections had the same aggressive sell-off behind them, reaching the middle of the Channel (0.5 Fib) in a matter of 2-3 months. Also check the 1W RSI. Strong rejections took place once it broke above the 70.000 overbought barrier. Right now we are above it.
-------------------------------------------------------------------------------
** Please LIKE 👍, SUBSCRIBE ✅, SHARE 🙌 and COMMENT ✍ if you enjoy this idea! Also share your ideas and charts in the comments section below! This is best way to keep it relevant, support me, keep the content here free and allow the idea to reach as many people as possible. **
-------------------------------------------------------------------------------
You may also TELL ME 🙋♀️🙋♂️ in the comments section which symbol you want me to analyze next and on which time-frame. The one with the most posts will be published tomorrow! 👏🎁
-------------------------------------------------------------------------------
👇 👇 👇 👇 👇 👇
💸💸💸💸💸💸
👇 👇 👇 👇 👇 👇

With USD strengthening, Usdsgd should be for a LONG***************************************************************************************
Hello there!
If you like my analysis and it helped you ,do give me a thumbs ups on tradingview! 🙏
And if you would like to show further support for me, you can gift me some coins on tradingview! 😁
Thank you!
Disclaimers:
The analysis shared through this channel are purely for educational and entertainment purposes only. They are by no means professional advice for individual/s to enter trades for investment or trading purposes.
The author/producer of these content shall not and will not be responsible for any form of financial/physical/assets losses incurred from trades executed from the derived conclusion of the individual from these content shared.
Thank you, and please do your due diligence before any putting on any trades!

USDSGD pulling back. Two levels to buy.The USDSGD pair made a Double Top rejection two days ago and is currently on a strong bearish 1D candle. With the 1D RSI also rejected on a Double Top last since in September 29 2021, the next level to consider entering is just above the 1D MA50 (blue trend-line), which is where the June 16 Bull Flag found Support. A 1D candle close below the 1D MA50, should target the bottom of the long-term Channel, just above the 1D MA200 (orange trend-line), which is where the last two Higher Lows were formed on August 11 2022 and April 14 2022.
--------------------------------------------------------------------------------------------------------
** Please support this idea with your likes and comments, it is the best way to keep it relevant and support me. **
--------------------------------------------------------------------------------------------------------

Difficult decisions The bot signalled a double confirmation long on SGDJPY but looking at the chart I have my doubts. USDJPY is clearly the stronger of the two and has moved back above the inflection level, where as SGD is looking weaker after falling below INF and showing some bearish price action.
Interestingly however USDJPY didn't signal from the bot, so the difficult decision is to trust the bot and enter SGD or go without a clear signal and buy USD?
Neither trade really fits into my playbook, so I'm sitting on my hands for now.

💡Don't miss the great buy opportunity in USDSGDTrading suggestion:
". There is a possibility of temporary retracement to the suggested support line (1.3463).
. if so, traders can set orders based on Price Action and expect to reach short-term targets."
Technical analysis:
. USDSGD is in a range bound, and the beginning of an uptrend is expected.
. The price is above the 21-Day WEMA, which acts as a dynamic support.
. The RSI is at 72.
Take Profits:
TP1= @ 1.3508
TP2= @ 1.3549
TP3= @ 1.3605
TP4= @ 1.3668
TP5= @ 1.3713
SL= Break below S2
❤️ If you find this helpful and want more FREE forecasts in TradingView
. . . . . Please show your support back,
. . . . . . . . Hit the 👍 LIKE button,
. . . . . . . . . . Drop some feedback below in the comment!
❤️ Your support is very much 🙏 appreciated!❤️
💎 Want us to help you become a better Forex / Crypto trader?
Now, It's your turn!
Be sure to leave a comment; let us know how you see this opportunity and forecast.
Trade well, ❤️
ForecastCity English Support Team ❤️

💡Don't miss the great buy opportunity in USDSGDTrading suggestion:
". There is a possibility of temporary retracement to the suggested support line (1.3463).
. if so, traders can set orders based on Price Action and expect to reach short-term targets."
Technical analysis:
. USDSGD is in a range bound, and the beginning of an uptrend is expected.
. The price is above the 21-Day WEMA, which acts as a dynamic support.
. The RSI is at 72.
Take Profits:
TP1= @ 1.3508
TP2= @ 1.3549
TP3= @ 1.3605
TP4= @ 1.3668
TP5= @ 1.3713
SL= Break below S2
❤️ If you find this helpful and want more FREE forecasts in TradingView
. . . . . Please show your support back,
. . . . . . . . Hit the 👍 LIKE button,
. . . . . . . . . . Drop some feedback below in the comment!
❤️ Your support is very much 🙏 appreciated! ❤️
💎 Want us to help you become a better Forex / Crypto trader ?
Now, It's your turn !
Be sure to leave a comment; let us know how you see this opportunity and forecast.
Trade well, ❤️
ForecastCity English Support Team ❤️

USDSGDOn the monthly we are coming out of a weekly buyzone. Looking for price to retrace the previous high. We are on the low side of the macd with it losing some momentum. It may take a while to reach its target. However, I need to focus on one chart that looked promising on the forex side of things. I don't need to trade everyday. I'm working on my discipline as a trader and am learning how important it is to just calm down. I like the DXY gaining strength towards the end of next year with interest rate hikes. I like the positioning of this chart. I will be patient and will update this chart as I see fit.
Not Advice. Good luck!

USDSGD looking up 🦐USDSGD on the daily chart is trading between 2 narrowing trendlines.
The price is now moving in a bullish momentum and according to Plancton's strategy if the market will break above and satisfy the academy rules we will set a nice long order.
--––
Follow the Shrimp 🦐
Keep in mind.
🟣 Purple structure -> Monthly structure.
🔴 Red structure -> Weekly structure.
🔵 Blue structure -> Daily structure.
🟡 Yellow structure -> 4h structure.
⚫️ Black structure -> <4h structure.
Here is the Plancton0618 technical analysis , please comment below if you have any question.
The ENTRY in the market will be taken only if the condition of the Plancton0618 strategy will trigger.

USDSGD: BUYBased off of higher time frames, especially on the Daily time frame, we can see that our Relative Strength Index shows an obvious time to sell on this pair. As you see can also see from the Fibonacci drawn on the daily time frame here, price can expect to hit the 50.0 level for bulls to enter and to eventually take profit around 1.40028 price.
