Bearish reversal off pullback resistance?The Silver (XAG/USD) is re4acting off the pivot which has been identified as a pullback resistance and could drop to the 1st suport.
Pivot: 36.76
1st Support: 35.73
1st Resistance: 37.29
Risk Warning:
Trading Forex and CFDs carries a high level of risk to your capital and you should only trade with money you can afford to lose. Trading Forex and CFDs may not be suitable for all investors, so please ensure that you fully understand the risks involved and seek independent advice if necessary.
Disclaimer:
The above opinions given constitute general market commentary, and do not constitute the opinion or advice of IC Markets or any form of personal or investment advice.
Any opinions, news, research, analyses, prices, other information, or links to third-party sites contained on this website are provided on an "as-is" basis, are intended only to be informative, is not an advice nor a recommendation, nor research, or a record of our trading prices, or an offer of, or solicitation for a transaction in any financial instrument and thus should not be treated as such. The information provided does not involve any specific investment objectives, financial situation and needs of any specific person who may receive it. Please be aware, that past performance is not a reliable indicator of future performance and/or results. Past Performance or Forward-looking scenarios based upon the reasonable beliefs of the third-party provider are not a guarantee of future performance. Actual results may differ materially from those anticipated in forward-looking or past performance statements. IC Markets makes no representation or warranty and assumes no liability as to the accuracy or completeness of the information provided, nor any loss arising from any investment based on a recommendation, forecast or any information supplied by any third-party.
USD

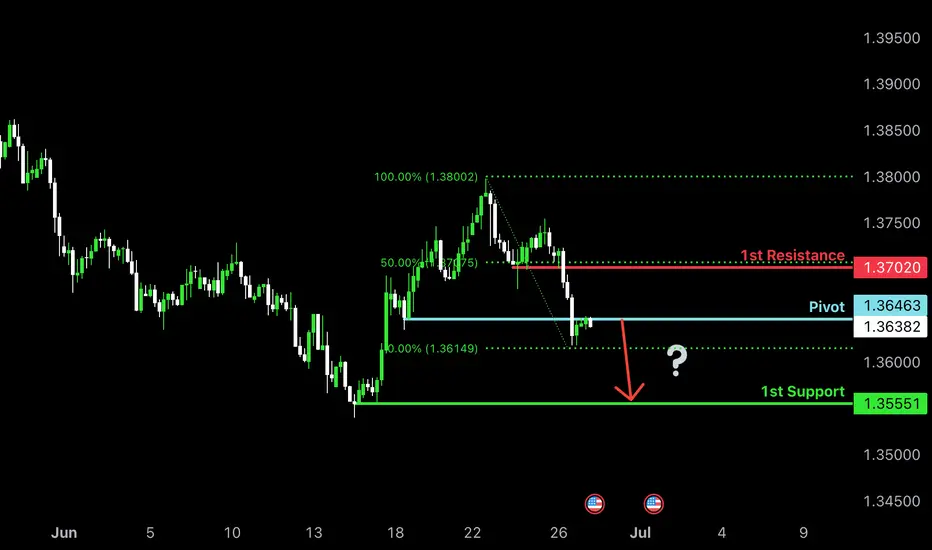
Bearish drop off pullback resistance?USD/CAD is reacting off the pivot which is a pullback resistance and could drop to the 1st support which acts as a pullback support.
Pivot: 1.3646
1st Support: 1.3555
1st Resistance: 1.3702
Risk Warning:
Trading Forex and CFDs carries a high level of risk to your capital and you should only trade with money you can afford to lose. Trading Forex and CFDs may not be suitable for all investors, so please ensure that you fully understand the risks involved and seek independent advice if necessary.
Disclaimer:
The above opinions given constitute general market commentary, and do not constitute the opinion or advice of IC Markets or any form of personal or investment advice.
Any opinions, news, research, analyses, prices, other information, or links to third-party sites contained on this website are provided on an "as-is" basis, are intended only to be informative, is not an advice nor a recommendation, nor research, or a record of our trading prices, or an offer of, or solicitation for a transaction in any financial instrument and thus should not be treated as such. The information provided does not involve any specific investment objectives, financial situation and needs of any specific person who may receive it. Please be aware, that past performance is not a reliable indicator of future performance and/or results. Past Performance or Forward-looking scenarios based upon the reasonable beliefs of the third-party provider are not a guarantee of future performance. Actual results may differ materially from those anticipated in forward-looking or past performance statements. IC Markets makes no representation or warranty and assumes no liability as to the accuracy or completeness of the information provided, nor any loss arising from any investment based on a recommendation, forecast or any information supplied by any third-party.
Bearish drop?USD/JPY is reacting off te pivot and could drop t the 1st support.
Pivot: 144.67
1st Support: 143.07
1st Resistance: 145.89
Risk Warning:
Trading Forex and CFDs carries a high level of risk to your capital and you should only trade with money you can afford to lose. Trading Forex and CFDs may not be suitable for all investors, so please ensure that you fully understand the risks involved and seek independent advice if necessary.
Disclaimer:
The above opinions given constitute general market commentary, and do not constitute the opinion or advice of IC Markets or any form of personal or investment advice.
Any opinions, news, research, analyses, prices, other information, or links to third-party sites contained on this website are provided on an "as-is" basis, are intended only to be informative, is not an advice nor a recommendation, nor research, or a record of our trading prices, or an offer of, or solicitation for a transaction in any financial instrument and thus should not be treated as such. The information provided does not involve any specific investment objectives, financial situation and needs of any specific person who may receive it. Please be aware, that past performance is not a reliable indicator of future performance and/or results. Past Performance or Forward-looking scenarios based upon the reasonable beliefs of the third-party provider are not a guarantee of future performance. Actual results may differ materially from those anticipated in forward-looking or past performance statements. IC Markets makes no representation or warranty and assumes no liability as to the accuracy or completeness of the information provided, nor any loss arising from any investment based on a recommendation, forecast or any information supplied by any third-party.

USD/CAD: Momentum Turns South Again with Fed Cut Bets BuildingDownside risks flagged in a separate trade idea earlier this week finally materialised for USD/CAD, resulting in the initial target being achieved. With the price now trading marginally below those levels and momentum indicators still bearish, another short setup has presented itself.
If USD/CAD continues to hold beneath 1.3650, shorts could be initiated below the level with a stop above for protection. The obvious target would be support at 1.3550, where the price bounced strongly in May.
With market pricing for Fed rate cuts continuing to build, narrowing yield differentials between the United States and Canada, downside is also favoured from a fundamental perspective.
Good luck!
DS

Dollar Index Bearish to $96 (UPDATE)I posted this DXY sell thesis yesterday for you all while price was still at $97.70. Since then sellers have taken out the previous Wave 3 low, creating a new daily low today at $96.90📉
We still have more downside yet to come towards our $96.60 target. So, use this 'DXY Sell Thesis' to help you with your trading, so once you can use this as a confluence to buy inverse correlated markets

bearish reversal off pullback resistance?The Ethereum (ETH/USD) has rejected off the pivot and could drop to the 1st support that aligns with the 61.8% Fibonacci retracement.
Pivot: 2,483.49
1st Support: 2,289.88
1st Resistance: 2,587.09
Risk Warning:
Trading Forex and CFDs carries a high level of risk to your capital and you should only trade with money you can afford to lose. Trading Forex and CFDs may not be suitable for all investors, so please ensure that you fully understand the risks involved and seek independent advice if necessary.
Disclaimer:
The above opinions given constitute general market commentary, and do not constitute the opinion or advice of IC Markets or any form of personal or investment advice.
Any opinions, news, research, analyses, prices, other information, or links to third-party sites contained on this website are provided on an "as-is" basis, are intended only to be informative, is not an advice nor a recommendation, nor research, or a record of our trading prices, or an offer of, or solicitation for a transaction in any financial instrument and thus should not be treated as such. The information provided does not involve any specific investment objectives, financial situation and needs of any specific person who may receive it. Please be aware, that past performance is not a reliable indicator of future performance and/or results. Past Performance or Forward-looking scenarios based upon the reasonable beliefs of the third-party provider are not a guarantee of future performance. Actual results may differ materially from those anticipated in forward-looking or past performance statements. IC Markets makes no representation or warranty and assumes no liability as to the accuracy or completeness of the information provided, nor any loss arising from any investment based on a recommendation, forecast or any information supplied by any third-party.

Bearish reversal?The Bitcoin (BTC/USD) is reacting off the pivot and could drop to the 1st support.
Pivot: 108,836.36
1st Support: 103,622.00
1st Resistance: 112,088.89
Risk Warning:
Trading Forex and CFDs carries a high level of risk to your capital and you should only trade with money you can afford to lose. Trading Forex and CFDs may not be suitable for all investors, so please ensure that you fully understand the risks involved and seek independent advice if necessary.
Disclaimer:
The above opinions given constitute general market commentary, and do not constitute the opinion or advice of IC Markets or any form of personal or investment advice.
Any opinions, news, research, analyses, prices, other information, or links to third-party sites contained on this website are provided on an "as-is" basis, are intended only to be informative, is not an advice nor a recommendation, nor research, or a record of our trading prices, or an offer of, or solicitation for a transaction in any financial instrument and thus should not be treated as such. The information provided does not involve any specific investment objectives, financial situation and needs of any specific person who may receive it. Please be aware, that past performance is not a reliable indicator of future performance and/or results. Past Performance or Forward-looking scenarios based upon the reasonable beliefs of the third-party provider are not a guarantee of future performance. Actual results may differ materially from those anticipated in forward-looking or past performance statements. IC Markets makes no representation or warranty and assumes no liability as to the accuracy or completeness of the information provided, nor any loss arising from any investment based on a recommendation, forecast or any information supplied by any third-party.

Bullish breakout for the Gold?The price is reacting off the resistance level which is a pullback resistance that aligns with the 50% Fibonacci retracement and a breakout of this level could lead the price from this level to our take profit.
Entry: 3,343.14
Why we like it:
There is a pullback resistance level that lines up with the 50% Fibonacci retracement.
Stop loss: 3,296.15
Why we like it:
There is a pullback support level.
Take profit: 3,390.77
Why we like it:
There is a pullback resistance level that aligns with the 61.8% Fibonacci retracement.
Enjoying your TradingView experience? Review us!
Please be advised that the information presented on TradingView is provided to Vantage (‘Vantage Global Limited’, ‘we’) by a third-party provider (‘Everest Fortune Group’). Please be reminded that you are solely responsible for the trading decisions on your account. There is a very high degree of risk involved in trading. Any information and/or content is intended entirely for research, educational and informational purposes only and does not constitute investment or consultation advice or investment strategy. The information is not tailored to the investment needs of any specific person and therefore does not involve a consideration of any of the investment objectives, financial situation or needs of any viewer that may receive it. Kindly also note that past performance is not a reliable indicator of future results. Actual results may differ materially from those anticipated in forward-looking or past performance statements. We assume no liability as to the accuracy or completeness of any of the information and/or content provided herein and the Company cannot be held responsible for any omission, mistake nor for any loss or damage including without limitation to any loss of profit which may arise from reliance on any information supplied by Everest Fortune Group.

Potential bullish rise?AUD/USD is reacting off the resistance level which is a pullback resistance and could rise from this level to our take profit.
Entry: 0.6537
Why we like it:
There is a pullback resistance level.
Stop loss: 0.6490
Why we like it:
There is an overlap support level.
Take profit: 0.6624
Why we like it:
There is a resistance level that aligns with the 138.2% Fibonacci extension and the 100% Fibonacci projection.
Enjoying your TradingView experience? Review us!
Please be advised that the information presented on TradingView is provided to Vantage (‘Vantage Global Limited’, ‘we’) by a third-party provider (‘Everest Fortune Group’). Please be reminded that you are solely responsible for the trading decisions on your account. There is a very high degree of risk involved in trading. Any information and/or content is intended entirely for research, educational and informational purposes only and does not constitute investment or consultation advice or investment strategy. The information is not tailored to the investment needs of any specific person and therefore does not involve a consideration of any of the investment objectives, financial situation or needs of any viewer that may receive it. Kindly also note that past performance is not a reliable indicator of future results. Actual results may differ materially from those anticipated in forward-looking or past performance statements. We assume no liability as to the accuracy or completeness of any of the information and/or content provided herein and the Company cannot be held responsible for any omission, mistake nor for any loss or damage including without limitation to any loss of profit which may arise from reliance on any information supplied by Everest Fortune Group.

Bearish drop off pullback resistance?USD/JPY is rising towards the resistance level which is a pullback resistance that lines up with the 23.6% Fibonacci retracement and could drop from this level to our take profit.
Entry: 144.61
Why we like it:
There is a pullback resistance level that aligns with the 23.6% Fibonacci retracement.
Stop loss: 146.11
Why we like it:
There is a pullback resistance level that aligns with the 50% Fibonacci retracement.
Take profit: 142.70
Why we like it:
There is a pullback support level that aligns with the 100% Fibonacci projection.
Enjoying your TradingView experience? Review us!
Please be advised that the information presented on TradingView is provided to Vantage (‘Vantage Global Limited’, ‘we’) by a third-party provider (‘Everest Fortune Group’). Please be reminded that you are solely responsible for the trading decisions on your account. There is a very high degree of risk involved in trading. Any information and/or content is intended entirely for research, educational and informational purposes only and does not constitute investment or consultation advice or investment strategy. The information is not tailored to the investment needs of any specific person and therefore does not involve a consideration of any of the investment objectives, financial situation or needs of any viewer that may receive it. Kindly also note that past performance is not a reliable indicator of future results. Actual results may differ materially from those anticipated in forward-looking or past performance statements. We assume no liability as to the accuracy or completeness of any of the information and/or content provided herein and the Company cannot be held responsible for any omission, mistake nor for any loss or damage including without limitation to any loss of profit which may arise from reliance on any information supplied by Everest Fortune Group.

Bullish reversal?USD/CAD is falling towards a support level, which acts as a pullback support just above the 78.6% Fibonacci projection. A bounce from this level could indicate the formation of a double bottom pattern, potentially leading to a price rise toward our take profit target.
Entry: 1.3555
Why we like it:
There is a pullback support levle.
Stop loss: 1.3465
Why we like it:
There is a support level that lines up with the 127.2% Fibonacci extension and the 100% Fibonacci projection.
Take profit: 1.3677
Why we like it:
There is a pullback resistance.
Enjoying your TradingView experience? Review us!
Please be advised that the information presented on TradingView is provided to Vantage (‘Vantage Global Limited’, ‘we’) by a third-party provider (‘Everest Fortune Group’). Please be reminded that you are solely responsible for the trading decisions on your account. There is a very high degree of risk involved in trading. Any information and/or content is intended entirely for research, educational and informational purposes only and does not constitute investment or consultation advice or investment strategy. The information is not tailored to the investment needs of any specific person and therefore does not involve a consideration of any of the investment objectives, financial situation or needs of any viewer that may receive it. Kindly also note that past performance is not a reliable indicator of future results. Actual results may differ materially from those anticipated in forward-looking or past performance statements. We assume no liability as to the accuracy or completeness of any of the information and/or content provided herein and the Company cannot be held responsible for any omission, mistake nor for any loss or damage including without limitation to any loss of profit which may arise from reliance on any information supplied by Everest Fortune Group.

DXY Short-term rebound quite likely.The U.S. Dollar index (DXY) has been trading within almost a 3-year Channel Down, which has assisted us in choosing the right levels to sell high and buy low.
Despite being now on its 2nd major Bearish Leg, we see a short-term bounce possibly up to August quite likely based on the previous major Bearish Leg. As you see, the current setup resembles the April 13 023 Low after which the price rebounded short-term just above the 0.786 Fibonacci level, only to get rejected later and complete the bottom on the 1.1 Fib extension.
Even the 1W RSI sequences between the two fractals are identical. Therefore, before diving below 96.000, we believe a 100.000 test is quite likely.
-------------------------------------------------------------------------------
** Please LIKE 👍, FOLLOW ✅, SHARE 🙌 and COMMENT ✍ if you enjoy this idea! Also share your ideas and charts in the comments section below! This is best way to keep it relevant, support us, keep the content here free and allow the idea to reach as many people as possible. **
-------------------------------------------------------------------------------
💸💸💸💸💸💸
👇 👇 👇 👇 👇 👇

AUDUSD Potential UpsidesHey Traders, in today's trading session we are monitoring AUDUSD for a buying opportunity around 0.63800 zone, AUDUSD is trading in an uptrend and currently is in a correction phase in which it is approaching the trend at 0.63800 support and resistance area.
Trade safe, Joe.

Potential bullish rise?The Gold (XAU/USD) is reacting off the pivot and could rise to the 1st resistance.
Pivot: 3,334.86
1st Support: 3,315.22
1st Resistance: 3,356.66
Risk Warning:
Trading Forex and CFDs carries a high level of risk to your capital and you should only trade with money you can afford to lose. Trading Forex and CFDs may not be suitable for all investors, so please ensure that you fully understand the risks involved and seek independent advice if necessary.
Disclaimer:
The above opinions given constitute general market commentary, and do not constitute the opinion or advice of IC Markets or any form of personal or investment advice.
Any opinions, news, research, analyses, prices, other information, or links to third-party sites contained on this website are provided on an "as-is" basis, are intended only to be informative, is not an advice nor a recommendation, nor research, or a record of our trading prices, or an offer of, or solicitation for a transaction in any financial instrument and thus should not be treated as such. The information provided does not involve any specific investment objectives, financial situation and needs of any specific person who may receive it. Please be aware, that past performance is not a reliable indicator of future performance and/or results. Past Performance or Forward-looking scenarios based upon the reasonable beliefs of the third-party provider are not a guarantee of future performance. Actual results may differ materially from those anticipated in forward-looking or past performance statements. IC Markets makes no representation or warranty and assumes no liability as to the accuracy or completeness of the information provided, nor any loss arising from any investment based on a recommendation, forecast or any information supplied by any third-party.

Falling towards major support?The Loonie (USD/CAD) is falling towards the pivot, which has been identified as an overlap support and could bounce to the 1st resistance.
Pivot: 1.3690
1st Support: 1.3667
1st Resistance: 1.3747
Risk Warning:
Trading Forex and CFDs carries a high level of risk to your capital and you should only trade with money you can afford to lose. Trading Forex and CFDs may not be suitable for all investors, so please ensure that you fully understand the risks involved and seek independent advice if necessary.
Disclaimer:
The above opinions given constitute general market commentary, and do not constitute the opinion or advice of IC Markets or any form of personal or investment advice.
Any opinions, news, research, analyses, prices, other information, or links to third-party sites contained on this website are provided on an "as-is" basis, are intended only to be informative, is not an advice nor a recommendation, nor research, or a record of our trading prices, or an offer of, or solicitation for a transaction in any financial instrument and thus should not be treated as such. The information provided does not involve any specific investment objectives, financial situation and needs of any specific person who may receive it. Please be aware, that past performance is not a reliable indicator of future performance and/or results. Past Performance or Forward-looking scenarios based upon the reasonable beliefs of the third-party provider are not a guarantee of future performance. Actual results may differ materially from those anticipated in forward-looking or past performance statements. IC Markets makes no representation or warranty and assumes no liability as to the accuracy or completeness of the information provided, nor any loss arising from any investment based on a recommendation, forecast or any information supplied by any third-party.

Bearish continuation?The Swissie (USD/CHF) has rejected off the pivot which has been identified as a pullback resistance and could drop to the 1st support.
Pivot: 0.8070
1st Support: 0.7962
1st Resistance: 0.8104
Risk Warning:
Trading Forex and CFDs carries a high level of risk to your capital and you should only trade with money you can afford to lose. Trading Forex and CFDs may not be suitable for all investors, so please ensure that you fully understand the risks involved and seek independent advice if necessary.
Disclaimer:
The above opinions given constitute general market commentary, and do not constitute the opinion or advice of IC Markets or any form of personal or investment advice.
Any opinions, news, research, analyses, prices, other information, or links to third-party sites contained on this website are provided on an "as-is" basis, are intended only to be informative, is not an advice nor a recommendation, nor research, or a record of our trading prices, or an offer of, or solicitation for a transaction in any financial instrument and thus should not be treated as such. The information provided does not involve any specific investment objectives, financial situation and needs of any specific person who may receive it. Please be aware, that past performance is not a reliable indicator of future performance and/or results. Past Performance or Forward-looking scenarios based upon the reasonable beliefs of the third-party provider are not a guarantee of future performance. Actual results may differ materially from those anticipated in forward-looking or past performance statements. IC Markets makes no representation or warranty and assumes no liability as to the accuracy or completeness of the information provided, nor any loss arising from any investment based on a recommendation, forecast or any information supplied by any third-party.

Could the price reverse from here?The Cable (GBP?USD) is reacting off the pivot and could reverse to the 1st support which acts as a pullback support.
Pivot: 1.3710
1st Support: 1.3620
1st Resistance: 1.3799
Risk Warning:
Trading Forex and CFDs carries a high level of risk to your capital and you should only trade with money you can afford to lose. Trading Forex and CFDs may not be suitable for all investors, so please ensure that you fully understand the risks involved and seek independent advice if necessary.
Disclaimer:
The above opinions given constitute general market commentary, and do not constitute the opinion or advice of IC Markets or any form of personal or investment advice.
Any opinions, news, research, analyses, prices, other information, or links to third-party sites contained on this website are provided on an "as-is" basis, are intended only to be informative, is not an advice nor a recommendation, nor research, or a record of our trading prices, or an offer of, or solicitation for a transaction in any financial instrument and thus should not be treated as such. The information provided does not involve any specific investment objectives, financial situation and needs of any specific person who may receive it. Please be aware, that past performance is not a reliable indicator of future performance and/or results. Past Performance or Forward-looking scenarios based upon the reasonable beliefs of the third-party provider are not a guarantee of future performance. Actual results may differ materially from those anticipated in forward-looking or past performance statements. IC Markets makes no representation or warranty and assumes no liability as to the accuracy or completeness of the information provided, nor any loss arising from any investment based on a recommendation, forecast or any information supplied by any third-party.

Bullish continuation for the Fiber?The price is falling towards the pivot point, which is a pullback support, and could bounce to the 1st resistance, which is also a pullback resistance.
Pivot: 1.1630
1st Support: 1.1591
1st Resistance: 1.1692
Risk Warning:
Trading Forex and CFDs carries a high level of risk to your capital and you should only trade with money you can afford to lose. Trading Forex and CFDs may not be suitable for all investors, so please ensure that you fully understand the risks involved and seek independent advice if necessary.
Disclaimer:
The above opinions given constitute general market commentary, and do not constitute the opinion or advice of IC Markets or any form of personal or investment advice.
Any opinions, news, research, analyses, prices, other information, or links to third-party sites contained on this website are provided on an "as-is" basis, are intended only to be informative, is not an advice nor a recommendation, nor research, or a record of our trading prices, or an offer of, or solicitation for a transaction in any financial instrument and thus should not be treated as such. The information provided does not involve any specific investment objectives, financial situation and needs of any specific person who may receive it. Please be aware, that past performance is not a reliable indicator of future performance and/or results. Past Performance or Forward-looking scenarios based upon the reasonable beliefs of the third-party provider are not a guarantee of future performance. Actual results may differ materially from those anticipated in forward-looking or past performance statements. IC Markets makes no representation or warranty and assumes no liability as to the accuracy or completeness of the information provided, nor any loss arising from any investment based on a recommendation, forecast or any information supplied by any third-party.

USDCHF LONG FORECAST Q2 W26 D26 Y25USDCHF LONG FORECAST Q2 W26 D26 Y25
Professional Risk Managers👋
HTF BOS REQUIRED
Welcome back to another FRGNT chart update📈
Diving into some Forex setups using predominantly higher time frame order blocks alongside confirmation breaks of structure.
Let’s see what price action is telling us today!
💡Here are some trade confluences📝
✅Daily order block
✅Weekly order block
✅Intraday breaks of structure Required
✅4H Order block
🔑 Remember, to participate in trading comes always with a degree of risk, therefore as professional risk managers it remains vital that we stick to our risk management plan as well as our trading strategies.
📈The rest, we leave to the balance of probabilities.
💡Fail to plan. Plan to fail.
🏆It has always been that simple.
❤️Good luck with your trading journey, I shall see you at the very top.
🎯Trade consistent, FRGNT X

XAU/USD - Channel Breakout (26.06.2025)The XAU/USD pair on the M30 timeframe presents a Potential Buying Opportunity due to a recent Formation of a Channel Breakout Pattern. This suggests a shift in momentum towards the upside and a higher likelihood of further advances in the coming hours.
Possible Long Trade:
Entry: Consider Entering A Long Position around Trendline Of The Pattern.
Target Levels:
1st Resistance – 3385
2nd Resistance – 3410
🎁 Please hit the like button and
🎁 Leave a comment to support for My Post !
Your likes and comments are incredibly motivating and will encourage me to share more analysis with you.
Best Regards, KABHI_TA_TRADING
Thank you.
Disclosure: I am part of Trade Nation's Influencer program and receive a monthly fee for using their TradingView charts in my analysis.

EURUSD Breakout and Potential RetraceHey Traders, in today's trading session we are monitoring EURUSD for a buying opportunity around 1.15700 zone, EURUSD was trading in a downtrend and successfully managed to break it out. Currently is in a correction phase in which it is approaching the retrace area at 1.15700 support and resistance area.
Trade safe, Joe.

$DXY Repeating 2016 Post-Election I have highlighted the 2016 to 2020 Presidential Elections time period and then pasted that timeframe onto the 2024 election and found that the pattern is going along very similarly to Trump 1.0.
If we assume that the future unfolds the same as last time, which is low probability, of course, then the future will unfold as shown in the yellow bars going into the future, as shown.
Initially in 2016 post election there was a 7% rally in the U.S. Dollar Index and then a 15% retreat for the following year. So far in 2025 we have seen the same rally and a similar decline, but only faster this time.
It would appear as thought the bulk majority of the declines in the TVC:DXY are over at this time with perhaps 4% further downside over the balance of the year.
The Dollar Index has been useful for predicting changes in the earnings estimates for the S&P500 in the USA due to the high percentage of earnings coming back to the US for quarterly reporting. I have posted a few charts in the past which have been helpful at determining the risk in the stock market.
The behavior of the global central banks has certainly had its impact on monetary aggregates and inflation. The policy response since the Covid Pandemic has been for maximum liquidity and maximum Government spending to keep the global economy afloat. The post-Covid response is now coming to a head along with new policy directives to cut wasteful Government spending and to reduce inflation (caused the Gov't spending).
Global investors have flocked to the US for access to high technology stocks and have driven up the value of US assets to extreme levels compared to other markets. This adjustment phase where investors remove money from overvalued, or highly valued, US assets back to other markets has created a wave of selling in the US Dollar and US listed equities.
What does the future hold? We never know but we sure can learn from what happened in the past by looking at charts just like this one to see what may happen. Looks like a bounce in the TVC:DXY from here, followed by a new low and then a rebound into the next few years.
All the best,
Tim
April 22, 2025 1:16PM EST TVC:DXY 98.78 last

GOLD - SHORT TO $2,800 (VIDEO ANALYSIS)Confluences👇
⭕️Wave 3 Peaked at Psychological Number of $2,500 (LQ Point).
⭕️Minor Wave 1 & 2 of Major Wave 4 Complete. But Wave 3 Pending.
⭕️Thin Liquidity In The Markets.
⭕️Gold Overbought/DXY Oversold.
✅HUGE 4,700 PIPS (14% ROI) POTENTIAL PROFIT✅
