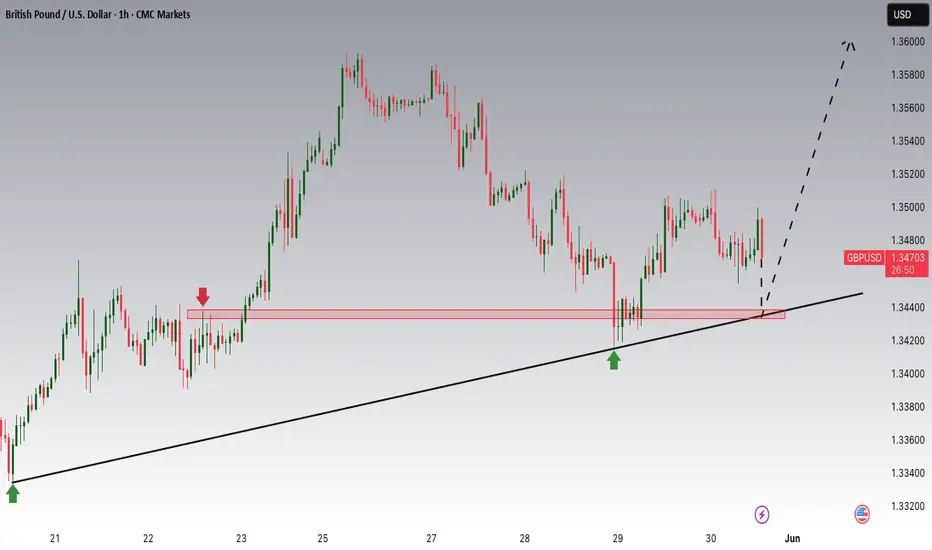
GBPUSD is Nearing an Important Support!!Hey Traders, in today's trading session we are monitoring GBPUSD for a buying opportunity around 1.34400 zone, GBPUSD is trading in an uptrend and currently is in a correction phase in which it is approaching the trend at 1.34400 support and resistance area.
Trade safe, Joe.
USD
EURUSD Bull Flag and 1week Golden Cross pushing it higher.EURUSD is on a Bull Flag pattern and just completed a 1week Golden Cross.
The structure is identical to the last 1week Golden Cross on January 11th 2021, which was also formed at the end of a Bull Flag pattern.
That formation pushed the pair higher to complete a 2.0 Fibonacci extension Top.
Buy and target 1.1800.
Follow us, like the idea and leave a comment below!!

GOLD - WAVE 4 CORRECTION TO $2,800 (UPDATE)Gold has once again rejected the 0.618 Fib level & dropped back into the lower bound of the range zone overnight, which is what we like to see.
But overall, we remain within the range so we exercise patience & keep an eye out for any possible alternatives which might happen for Gold. Nice profits for us either way.

USDJPY: Weekly overviewHello Traders, US news could move this pair dramatically.
I've made the white zone no trade because of strong additional zone around 148.225 for the bullish side and a sharp move needed to reach the zone.
The zone around 142.892 is more suitable for short trades, regarding the trend and distance from median of the channel. This zone is only suitable for long if the break be strong enough to overpass the median of the channel.
The indicated levels are determined based on the most reaction points and the assumption of approximately equal distance between the zones.
Some of these points can also be confirmed by the mathematical intervals of Murray.
You can enter with/without confirmation. IF you want to take confirmation you can use LTF analysis, Spike move confirmation, Trend Strength confrimation and ETC.
SL could be placed below the zone or regarding the LTF swings.
TP is the next zone or the nearest moving S&R, which are median and borders of the drawn channels.
*******************************************************************
Role of different zones:
GREEN: Just long trades allowed on them.
RED: Just Short trades allowed on them.
BLUE: both long and short trades allowed on them.
WHITE: No trades allowed on them! just use them as TP points

Bearish drop?The Gold (XAU/USD) has reacted off the pivot and could potentially drop from this level to the 1st support.
Pivot: 3,237.46
1st Support: 3,239.71
1st Resistance: 3,415.22
Risk Warning:
Trading Forex and CFDs carries a high level of risk to your capital and you should only trade with money you can afford to lose. Trading Forex and CFDs may not be suitable for all investors, so please ensure that you fully understand the risks involved and seek independent advice if necessary.
Disclaimer:
The above opinions given constitute general market commentary, and do not constitute the opinion or advice of IC Markets or any form of personal or investment advice.
Any opinions, news, research, analyses, prices, other information, or links to third-party sites contained on this website are provided on an "as-is" basis, are intended only to be informative, is not an advice nor a recommendation, nor research, or a record of our trading prices, or an offer of, or solicitation for a transaction in any financial instrument and thus should not be treated as such. The information provided does not involve any specific investment objectives, financial situation and needs of any specific person who may receive it. Please be aware, that past performance is not a reliable indicator of future performance and/or results. Past Performance or Forward-looking scenarios based upon the reasonable beliefs of the third-party provider are not a guarantee of future performance. Actual results may differ materially from those anticipated in forward-looking or past performance statements. IC Markets makes no representation or warranty and assumes no liability as to the accuracy or completeness of the information provided, nor any loss arising from any investment based on a recommendation, forecast or any information supplied by any third-party.

Bearish drop off overlap resistance?The Loonie (USD/CAD) is rising towards the pivot, which has been identified as an overlap resistance and could drop to the 50% Fibonacci support.
Pivot: 1.3861
1st Support: 1.3767
1st Resistance: 1.3912
Risk Warning:
Trading Forex and CFDs carries a high level of risk to your capital and you should only trade with money you can afford to lose. Trading Forex and CFDs may not be suitable for all investors, so please ensure that you fully understand the risks involved and seek independent advice if necessary.
Disclaimer:
The above opinions given constitute general market commentary, and do not constitute the opinion or advice of IC Markets or any form of personal or investment advice.
Any opinions, news, research, analyses, prices, other information, or links to third-party sites contained on this website are provided on an "as-is" basis, are intended only to be informative, is not an advice nor a recommendation, nor research, or a record of our trading prices, or an offer of, or solicitation for a transaction in any financial instrument and thus should not be treated as such. The information provided does not involve any specific investment objectives, financial situation and needs of any specific person who may receive it. Please be aware, that past performance is not a reliable indicator of future performance and/or results. Past Performance or Forward-looking scenarios based upon the reasonable beliefs of the third-party provider are not a guarantee of future performance. Actual results may differ materially from those anticipated in forward-looking or past performance statements. IC Markets makes no representation or warranty and assumes no liability as to the accuracy or completeness of the information provided, nor any loss arising from any investment based on a recommendation, forecast or any information supplied by any third-party.

Could the price bounce from here?USD/JPY is falling towards the pivot and could bounce to the 1st resistance, which acts as a pullback resistance.
Pivot: 143.25
1st Support: 141.80
1st Resistance: 145.97
Risk Warning:
Trading Forex and CFDs carries a high level of risk to your capital and you should only trade with money you can afford to lose. Trading Forex and CFDs may not be suitable for all investors, so please ensure that you fully understand the risks involved and seek independent advice if necessary.
Disclaimer:
The above opinions given constitute general market commentary, and do not constitute the opinion or advice of IC Markets or any form of personal or investment advice.
Any opinions, news, research, analyses, prices, other information, or links to third-party sites contained on this website are provided on an "as-is" basis, are intended only to be informative, is not an advice nor a recommendation, nor research, or a record of our trading prices, or an offer of, or solicitation for a transaction in any financial instrument and thus should not be treated as such. The information provided does not involve any specific investment objectives, financial situation and needs of any specific person who may receive it. Please be aware, that past performance is not a reliable indicator of future performance and/or results. Past Performance or Forward-looking scenarios based upon the reasonable beliefs of the third-party provider are not a guarantee of future performance. Actual results may differ materially from those anticipated in forward-looking or past performance statements. IC Markets makes no representation or warranty and assumes no liability as to the accuracy or completeness of the information provided, nor any loss arising from any investment based on a recommendation, forecast or any information supplied by any third-party.

Bearish drop off pullback resistance?GBP/USD has rejected off the pivot and could drop to the 1st support, which aligns with the 127.2% Fibonacci extension.
Pivot: 0.6446
1st Support: 0.6358
1st Resistance: 0.6538
Risk Warning:
Trading Forex and CFDs carries a high level of risk to your capital and you should only trade with money you can afford to lose. Trading Forex and CFDs may not be suitable for all investors, so please ensure that you fully understand the risks involved and seek independent advice if necessary.
Disclaimer:
The above opinions given constitute general market commentary, and do not constitute the opinion or advice of IC Markets or any form of personal or investment advice.
Any opinions, news, research, analyses, prices, other information, or links to third-party sites contained on this website are provided on an "as-is" basis, are intended only to be informative, is not an advice nor a recommendation, nor research, or a record of our trading prices, or an offer of, or solicitation for a transaction in any financial instrument and thus should not be treated as such. The information provided does not involve any specific investment objectives, financial situation and needs of any specific person who may receive it. Please be aware, that past performance is not a reliable indicator of future performance and/or results. Past Performance or Forward-looking scenarios based upon the reasonable beliefs of the third-party provider are not a guarantee of future performance. Actual results may differ materially from those anticipated in forward-looking or past performance statements. IC Markets makes no representation or warranty and assumes no liability as to the accuracy or completeness of the information provided, nor any loss arising from any investment based on a recommendation, forecast or any information supplied by any third-party.

Falling towards 61.8% Fibonacci support?The Cable (GBP/USD) is falling towards the pivot, which serves as pullback support and could bounce to the 1st resistance, which acts as pullback resistance.
Pivot: 1.3315
1st Support: 1.3159
1st Resistance: 1.3586
Risk Warning:
Trading Forex and CFDs carries a high level of risk to your capital and you should only trade with money you can afford to lose. Trading Forex and CFDs may not be suitable for all investors, so please ensure that you fully understand the risks involved and seek independent advice if necessary.
Disclaimer:
The above opinions given constitute general market commentary, and do not constitute the opinion or advice of IC Markets or any form of personal or investment advice.
Any opinions, news, research, analyses, prices, other information, or links to third-party sites contained on this website are provided on an "as-is" basis, are intended only to be informative, is not an advice nor a recommendation, nor research, or a record of our trading prices, or an offer of, or solicitation for a transaction in any financial instrument and thus should not be treated as such. The information provided does not involve any specific investment objectives, financial situation and needs of any specific person who may receive it. Please be aware, that past performance is not a reliable indicator of future performance and/or results. Past Performance or Forward-looking scenarios based upon the reasonable beliefs of the third-party provider are not a guarantee of future performance. Actual results may differ materially from those anticipated in forward-looking or past performance statements. IC Markets makes no representation or warranty and assumes no liability as to the accuracy or completeness of the information provided, nor any loss arising from any investment based on a recommendation, forecast or any information supplied by any third-party.

Bearish reversal off pullback resistance?The Fiber (EUR/USD) is rising towards the pivot and could reverse to the support.
Pivot: 1.1424
1st Support: 1.1237
1st Resistance: 1.1555
Risk Warning:
Trading Forex and CFDs carries a high level of risk to your capital and you should only trade with money you can afford to lose. Trading Forex and CFDs may not be suitable for all investors, so please ensure that you fully understand the risks involved and seek independent advice if necessary.
Disclaimer:
The above opinions given constitute general market commentary, and do not constitute the opinion or advice of IC Markets or any form of personal or investment advice.
Any opinions, news, research, analyses, prices, other information, or links to third-party sites contained on this website are provided on an "as-is" basis, are intended only to be informative, is not an advice nor a recommendation, nor research, or a record of our trading prices, or an offer of, or solicitation for a transaction in any financial instrument and thus should not be treated as such. The information provided does not involve any specific investment objectives, financial situation and needs of any specific person who may receive it. Please be aware, that past performance is not a reliable indicator of future performance and/or results. Past Performance or Forward-looking scenarios based upon the reasonable beliefs of the third-party provider are not a guarantee of future performance. Actual results may differ materially from those anticipated in forward-looking or past performance statements. IC Markets makes no representation or warranty and assumes no liability as to the accuracy or completeness of the information provided, nor any loss arising from any investment based on a recommendation, forecast or any information supplied by any third-party.

Bearish reversal for the Aussie?AUD/USD is rising towards the resistance level which is a pullback resistance that lines up with the 38.2% Fibonacci retracement and could drop from this level to our take profit.
Entry: 0.6464
Why we like it:
There is a pullback resistance level that lines up with the 38.2% Fibonacci retracement.
Stop loss: 0.6499
Why we like it:
There is a pullback resistance level that is slightly below the 78.6% Fibonacci retracement.
Take profit: 0.6397
Why we like it:
There is a pullback support level.
Enjoying your TradingView experience? Review us!
Please be advised that the information presented on TradingView is provided to Vantage (‘Vantage Global Limited’, ‘we’) by a third-party provider (‘Everest Fortune Group’). Please be reminded that you are solely responsible for the trading decisions on your account. There is a very high degree of risk involved in trading. Any information and/or content is intended entirely for research, educational and informational purposes only and does not constitute investment or consultation advice or investment strategy. The information is not tailored to the investment needs of any specific person and therefore does not involve a consideration of any of the investment objectives, financial situation or needs of any viewer that may receive it. Kindly also note that past performance is not a reliable indicator of future results. Actual results may differ materially from those anticipated in forward-looking or past performance statements. We assume no liability as to the accuracy or completeness of any of the information and/or content provided herein and the Company cannot be held responsible for any omission, mistake nor for any loss or damage including without limitation to any loss of profit which may arise from reliance on any information supplied by Everest Fortune Group.

EURUSD: Bullish Megaphone unfolds its new bullish wave.EURUSD just turned bullish on its 1D technical outlook (RSI = 56.015, MACD = 0.004, ADX = 31.789) as it maintains a sustainable short term uptrend through a Bullish Megaphone pattern. The 1D MA50 has assumed the role of the medium term Support and the 3rd bullish wave is already under way. We expect it to repeat at least the previous +2.59% wave, having a TP = 1.14950.
## If you like our free content follow our profile to get more daily ideas. ##
## Comments and likes are greatly appreciated. ##

BTCUSDT – Risk of trend break, bearish signs emergingBTCUSDT is trading right at the lower boundary of its ascending channel, around the 108,800 mark. After several bounces from this trendline, price action now appears to be stalling—indicating that buying pressure is weakening. If the price breaks below the 107,500–106,500 support zone (marked by the 34 EMA and recent swing low), the short-term uptrend could be invalidated.
A confirmed break below 106,500 could trigger a further correction toward the 89 EMA around 102,800.
On the news front: Latest data shows Bitcoin’s dominance is slightly decreasing as capital rotates back into altcoins. Additionally, market uncertainty surrounding the Fed's monetary policy outlook is making investors more cautious about riskier assets like crypto.

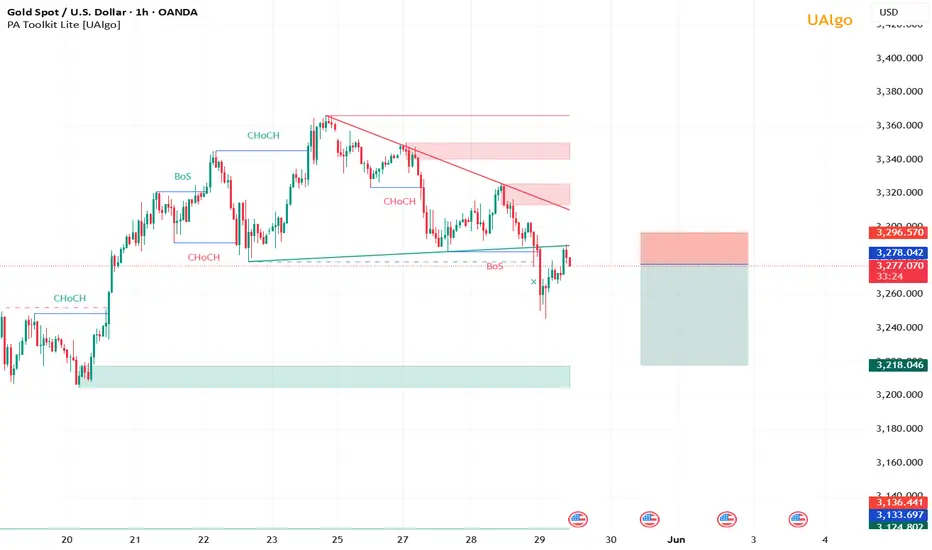
xaud/usd sell📉 Market Structure Analysis:
The market was previously in an uptrend, confirmed by BoS and CHoCH.
Then, a bearish shift occurred with a BoS to the downside and the break of the ascending trendline.
A valid descending structure is now in play.
Price retraced into a supply zone, where selling pressure is visible.
The most recent BoS to the downside confirms a bearish bias.
Currently, the price is forming a potential lower high under the trendline and may continue lower toward the demand zone at ~3218.046.
📌 Trade Setup:
Entry (Sell): Around 3278 level.
Stop Loss (SL): Placed above the supply zone, around 3296.
Take Profit (TP): Targeting the demand zone near 3218.
This setup offers a good risk-to-reward ratio.
📊 Conclusion:
✅ Primary Scenario: Bearish continuation toward the demand zone (~3218), with selling pressure likely to dominate below the trendline.
⚠️ Alternative Scenario: If price breaks and closes above 3296, the bearish structure may be invalidated, and a shift back to bullish momentum is possible.
EURUSD PLAN – Is the Rebound Just a Pause Before the Drop? EURUSD PLAN – Is the Rebound Just a Pause Before the Drop? | All Eyes on PCE
📊 MACRO OUTLOOK:
Following the latest FOMC meeting, the Fed kept interest rates unchanged, as expected, but maintained a hawkish tone. Chair Powell reiterated that inflation remains too sticky to consider rate cuts in the near term.
Markets now await this week’s US PCE data — the Fed’s preferred inflation gauge — which could provide the next major catalyst for USD strength or weakness.
On the Euro side, weak consumer confidence and tepid growth have strengthened expectations for an ECB rate cut in June. This divergence in monetary policy is weighing on the Euro, as the Dollar finds new demand amid global risk recalibration.
📉 TECHNICAL OUTLOOK (H1):
EURUSD has broken down from recent highs near 1.1412 and is now forming a bearish retracement pattern.
Price has broken below the 89-EMA and 200-EMA, signaling bearish structure.
Current price action suggests a temporary bounce from the 1.1260–1.1280 support zone (Fibo 38.2%–50%), but the broader trend remains bearish.
Fibonacci retracement from recent swing lows highlights 1.1338 and 1.1372 as key resistance levels to watch.
🔑 KEY TECHNICAL ZONES:
Resistance Zones:
• 1.1313 – Minor intraday level (Fibo 0.5)
• 1.1338 – EMA confluence + former structure
• 1.1372 – Major rejection zone (previous distribution top)
Support Zones:
• 1.1280 – 1.1260 – Current support bounce area
• 1.1220 – Key liquidity sweep zone
🧭 TRADE STRATEGY:
Scenario A – Sell the Pullback:
• Wait for a rebound into the 1.1313 – 1.1338 zone
• Enter SELL if bearish rejection forms
• SL: 1.1376
• TP: 1.1280 → 1.1260 → 1.1220
Scenario B – Invalid Breakout:
• If price breaks above 1.1372 with momentum, this plan is invalidated — wait for a confirmed breakout retest.
Scenario C – Reactive Buy Scalp:
• If price shows strong rejection from 1.1260 again, scalpers may consider a temporary BUY back toward 1.1300–1.1310
• This is high-risk and counter-trend.
⚠️ STRATEGIC NOTES:
EURUSD remains in a bearish bias until major resistance levels are broken. With PCE data approaching, volatility is likely. Trade setups should be based on confirmation signals and managed tightly as macro data can shift momentum rapidly.

Bearish reversal?The Loonie (USD/CAD) is rising towards the pivot and could reverse to the 1st support.
Pivot: 1.3895
1st Support: 1.3792
1st Resistance: 1.3943
Risk Warning:
Trading Forex and CFDs carries a high level of risk to your capital and you should only trade with money you can afford to lose. Trading Forex and CFDs may not be suitable for all investors, so please ensure that you fully understand the risks involved and seek independent advice if necessary.
Disclaimer:
The above opinions given constitute general market commentary, and do not constitute the opinion or advice of IC Markets or any form of personal or investment advice.
Any opinions, news, research, analyses, prices, other information, or links to third-party sites contained on this website are provided on an "as-is" basis, are intended only to be informative, is not an advice nor a recommendation, nor research, or a record of our trading prices, or an offer of, or solicitation for a transaction in any financial instrument and thus should not be treated as such. The information provided does not involve any specific investment objectives, financial situation and needs of any specific person who may receive it. Please be aware, that past performance is not a reliable indicator of future performance and/or results. Past Performance or Forward-looking scenarios based upon the reasonable beliefs of the third-party provider are not a guarantee of future performance. Actual results may differ materially from those anticipated in forward-looking or past performance statements. IC Markets makes no representation or warranty and assumes no liability as to the accuracy or completeness of the information provided, nor any loss arising from any investment based on a recommendation, forecast or any information supplied by any third-party.

Bearish reversal off pullback resistance?The Gold (XAU/USD) is rising towards the pivot, which acts as a pullback resistance and could reverse to the 1st support, which has been identified as a pullback support.
Pivot: 3,284.50
1st Support: 3,205.30
1st Resistance: 3,232.71
Risk Warning:
Trading Forex and CFDs carries a high level of risk to your capital and you should only trade with money you can afford to lose. Trading Forex and CFDs may not be suitable for all investors, so please ensure that you fully understand the risks involved and seek independent advice if necessary.
Disclaimer:
The above opinions given constitute general market commentary, and do not constitute the opinion or advice of IC Markets or any form of personal or investment advice.
Any opinions, news, research, analyses, prices, other information, or links to third-party sites contained on this website are provided on an "as-is" basis, are intended only to be informative, is not an advice nor a recommendation, nor research, or a record of our trading prices, or an offer of, or solicitation for a transaction in any financial instrument and thus should not be treated as such. The information provided does not involve any specific investment objectives, financial situation and needs of any specific person who may receive it. Please be aware, that past performance is not a reliable indicator of future performance and/or results. Past Performance or Forward-looking scenarios based upon the reasonable beliefs of the third-party provider are not a guarantee of future performance. Actual results may differ materially from those anticipated in forward-looking or past performance statements. IC Markets makes no representation or warranty and assumes no liability as to the accuracy or completeness of the information provided, nor any loss arising from any investment based on a recommendation, forecast or any information supplied by any third-party.

Bearish drop?The Bitcoin (BTC/USD) has reacted off the pivot, which lines up with the 38.2% Fibonacci retracement, and could drop to the 1st support, which lines up with the 127.2% Fibonacci extension.
Pivot: 108,411.31
1st Support: 105,349.38
1st Resistance: 109,146.02
Risk Warning:
Trading Forex and CFDs carries a high level of risk to your capital and you should only trade with money you can afford to lose. Trading Forex and CFDs may not be suitable for all investors, so please ensure that you fully understand the risks involved and seek independent advice if necessary.
Disclaimer:
The above opinions given constitute general market commentary, and do not constitute the opinion or advice of IC Markets or any form of personal or investment advice.
Any opinions, news, research, analyses, prices, other information, or links to third-party sites contained on this website are provided on an "as-is" basis, are intended only to be informative, is not an advice nor a recommendation, nor research, or a record of our trading prices, or an offer of, or solicitation for a transaction in any financial instrument and thus should not be treated as such. The information provided does not involve any specific investment objectives, financial situation and needs of any specific person who may receive it. Please be aware, that past performance is not a reliable indicator of future performance and/or results. Past Performance or Forward-looking scenarios based upon the reasonable beliefs of the third-party provider are not a guarantee of future performance. Actual results may differ materially from those anticipated in forward-looking or past performance statements. IC Markets makes no representation or warranty and assumes no liability as to the accuracy or completeness of the information provided, nor any loss arising from any investment based on a recommendation, forecast or any information supplied by any third-party.

GBP/USD Breakout (28.05.2025)The GBP/USD Pair on the M30 timeframe presents a Potential Selling Opportunity due to a recent Formation of a Breakout Pattern. This suggests a shift in momentum towards the downside in the coming hours.
Possible Short Trade:
Entry: Consider Entering A Short Position around Trendline Of The Pattern.
Target Levels:
1st Support – 1.3424
2nd Support – 1.3380
🎁 Please hit the like button and
🎁 Leave a comment to support for My Post !
Your likes and comments are incredibly motivating and will encourage me to share more analysis with you.
Best Regards, KABHI_TA_TRADING
Thank you.
Disclosure: I am part of Trade Nation's Influencer program and receive a monthly fee for using their TradingView charts in my analysis.

NZDUSD to form a higher low?NZDUSD - 24h expiry
There is no clear indication that the upward move is coming to an end.
The correction lower is assessed as being complete.
A move through 0.5960 will confirm the bullish momentum.
The measured move target is 0.6000.
Pivot resistance is at 0.6000.
We look to Buy at 0.5940 (stop at 0.5915)
Our profit targets will be 0.5990 and 0.6000
Resistance: 0.5975 / 0.5990 / 0.6000
Support: 0.5940 / 0.5925 / 0.5900
Risk Disclaimer
The trade ideas beyond this page are for informational purposes only and do not constitute investment advice or a solicitation to trade. This information is provided by Signal Centre, a third-party unaffiliated with OANDA, and is intended for general circulation only. OANDA does not guarantee the accuracy of this information and assumes no responsibilities for the information provided by the third party. The information does not take into account the specific investment objectives, financial situation, or particular needs of any particular person. You should take into account your specific investment objectives, financial situation, and particular needs before making a commitment to trade, including seeking advice from an independent financial adviser regarding the suitability of the investment, under a separate engagement, as you deem fit.
You accept that you assume all risks in independently viewing the contents and selecting a chosen strategy.
Where the research is distributed in Singapore to a person who is not an Accredited Investor, Expert Investor or an Institutional Investor, Oanda Asia Pacific Pte Ltd (“OAP“) accepts legal responsibility for the contents of the report to such persons only to the extent required by law. Singapore customers should contact OAP at 6579 8289 for matters arising from, or in connection with, the information/research distributed.

GOLD - WAVE 4 CORRECTION TO $2,800 (UPDATE)Gold sellers have pushed Wave C back into last week's range low. Last week's candle closed bullish, so I'd like to see sellers close below the range low of $3,281 for a stronger confirmation of selling continuation.

Could the price bounce from here?XAU/USD is falling towards the support level which is a pullback support that lines up with the 38.2% Fibonacci retracement and could bounce from this level to our take profit.
Entry: 3,260.13
Why we like it:
There is a pullback support level that lines up with the 38.2% Fibonacci retracement.
Stop loss: 3,213.54
Why we like it:
There is a pullback support level that aligns with the 61.89% Fibonacci retracement.
Take profit: 3,344.27
Why we like it:
There is as pullback resistance level.
Enjoying your TradingView experience? Review us!
Please be advised that the information presented on TradingView is provided to Vantage (‘Vantage Global Limited’, ‘we’) by a third-party provider (‘Everest Fortune Group’). Please be reminded that you are solely responsible for the trading decisions on your account. There is a very high degree of risk involved in trading. Any information and/or content is intended entirely for research, educational and informational purposes only and does not constitute investment or consultation advice or investment strategy. The information is not tailored to the investment needs of any specific person and therefore does not involve a consideration of any of the investment objectives, financial situation or needs of any viewer that may receive it. Kindly also note that past performance is not a reliable indicator of future results. Actual results may differ materially from those anticipated in forward-looking or past performance statements. We assume no liability as to the accuracy or completeness of any of the information and/or content provided herein and the Company cannot be held responsible for any omission, mistake nor for any loss or damage including without limitation to any loss of profit which may arise from reliance on any information supplied by Everest Fortune Group.

Bullish bounce for the Kiwi?The price has bounced off the support level which is a pullback support that lines up with the 71% Fibonacci retracement and could potentially rise from this level to our take profit.
Entry: 0.5931
Why we like it:
There is a pullback support level that lines up with the 71% Fibonacci retracement.
Stop loss: 0.5898
Why we like it:
There is a pullback support level.
Take profit: 0.6017
Why we like it:
There is a pullback resistance level.
Enjoying your TradingView experience? Review us!
Please be advised that the information presented on TradingView is provided to Vantage (‘Vantage Global Limited’, ‘we’) by a third-party provider (‘Everest Fortune Group’). Please be reminded that you are solely responsible for the trading decisions on your account. There is a very high degree of risk involved in trading. Any information and/or content is intended entirely for research, educational and informational purposes only and does not constitute investment or consultation advice or investment strategy. The information is not tailored to the investment needs of any specific person and therefore does not involve a consideration of any of the investment objectives, financial situation or needs of any viewer that may receive it. Kindly also note that past performance is not a reliable indicator of future results. Actual results may differ materially from those anticipated in forward-looking or past performance statements. We assume no liability as to the accuracy or completeness of any of the information and/or content provided herein and the Company cannot be held responsible for any omission, mistake nor for any loss or damage including without limitation to any loss of profit which may arise from reliance on any information supplied by Everest Fortune Group.
