USD/CAD still selling offEarlier I posted a USD/CAD SHORT trade which was unforunately blocked because of a TV house violation I was unaware off bit one that I fully understand.
I had an initial target for this trade at 1.3492 which we have reached.
There's no sign that this pair have finished selling off following the major Retail Sales shock out of the US.
Core Retail Sales were expected in at +0.2% but missed by an astonishing 8 points to come in at -0.6%.
This has seriously impacted all USD pairs and as I'm in this USD/CAD SHORT I see no reason to close the position just yet.
My next target is 1.3470.
Usdcadanalysis

USDCAD - Still bullish ✅Hello traders!
‼️ This is my perspective on USDCAD.
Technical analysis: Here we are in a bullish market structure from 4H timeframe perspective, so I am looking for a long. I want price to go a little bit lower to fulfill the imbalance and then to reject from support zone for a long position.
Like, comment and subscribe to be in touch with my content!

USDCAD LONG TERM BULLISH CONTINUATION USDCAD Long term bullish continuation.
The Formation of long term yearly double bottom that was broken long ago and now the yearly candles are finishing the heavy load retesting heavy that took years to form.
And on 2024 I'm expecting USDCAD to start the long gone rally that is supposedly to finish the formation of double bottom, break and retest of it and a rally finish that finishes the pattern.

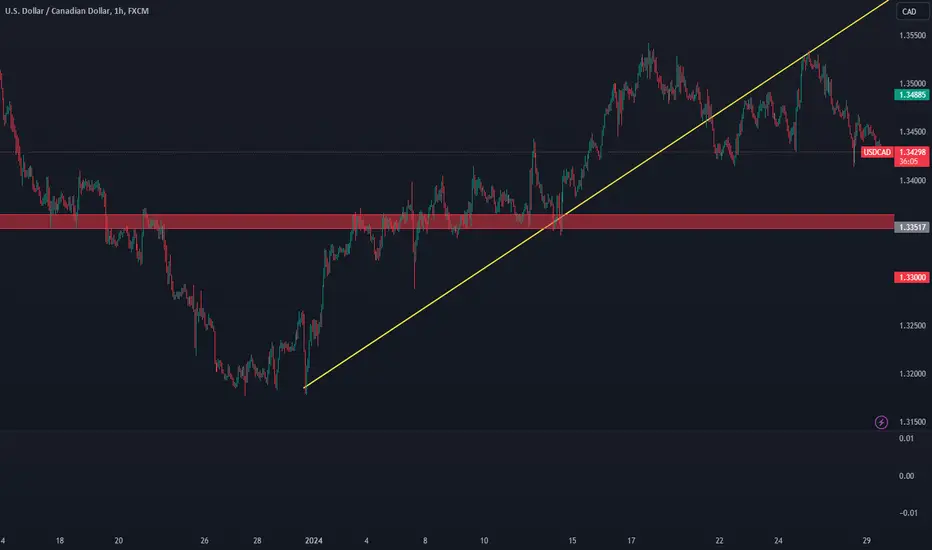
USD/CAD LONG from 1.3473 USD/CAD has broken through the neckline of a W pattern and has the look of heading higher.
The price is now above all significant EMA's that are now grouped on the H1 time frame and its the same story on the H4 time frame.
With no significant news until tomorrow's US CPI numbers at 13:30 GMT , there shouldn't anything that would encourage USD/CAD BEARS so the WR1 pivot at 1.3530 looks a reasonable target though we're not likely to get there until well into tomorrow.
STOP is under the recent lows 1.3449.

USD / CAD Long Still very choppy but im long bias, but in order to take the entry I would be looking for break out of the wedge shape pattern with a 4h close above blue zone above structure.
Alternatively I would be looking for a pull back and rejection from the bottom of structure with a long back to the top.

USDCAD potential buyusdcad is making higher highs and higher lows on higher time frames and on the 4hr intraday time frame price is respecting support so i decided to get in at a one hour engulfing i also gave an update on AUDCAD.While AUDCAD is moving in a downward direction showing selling pressure at the moment i am waitin fot it to play out as planned.

USDCAD Short From Resistance!USD-CAD will soon hit
The horizontal resistance
Of 1.35257 from where
We are likely to see
A local bearish correction !

USDCAD,🔴Will the price drop further?🔴
As you can see, I expected that the price rose to more than 180 Pips and had a bearish reaction after collecting the liquidity above the previous high.
Now, by examining the 12-hour chart we can see the price created the FVG and I expect it to fill in the short term, then we can define a bullish order block where we should study the price in the lower time frame and see the bullish reaction in this zone.
So if the price stays below 1.3506, the price falls more to 1.3366- 1.33875
💡Wait for the update!
🗓️07/02/2024
🔎 DYOR
💌It is my honor to share your comments with me💌

USDCAD - Long opportunity ✅ Hello traders!
‼️ This is my perspective on USDCAD.
Technical analysis: Here I think we are still bullish, so I am looking for short. I expect price to continue the retracement to fill half of imbalance and then to reject from support zone + institutional big figure 1.34000.
Fundamental news: Tomorrow we will see results of Unemployment Rate on CAD.
Like, comment and subscribe to be in touch with my content!

USDCAD, First long then short... (Read the caption)
By examining the 8-hour USDCAD chart, we can define the market structure as bearish.
There is a strong supply zone that broke the structure and also it coincided with the POC line, previously the price felt the FVG but could not enter to supply zone and was rejected.
Now the price created the liquidity pool formed as an equal high below the institutional flow.
So we can expect the price to rise to the supply zone and then fall.
I should mention the other supply zone that formed at 1.34362- 1.34644, we can look for a short-term sell position in that zone in a lower time frame.
💡Wait for the update!
🗓️02/02/2024
🔎 DYOR
💌It is my honor to share your comments with me💌

USDCAD BUY | Day Trading AnalysisHello Traders, here is the full analysis.
The completed correction, recovery and formation of a pre-breakout set-up hint at the continuation of growth. GOOD LUCK! Great BUY opportunity USDCAD
I still did my best and this is the most likely count for me at the moment.
Support the idea with like and follow my profile TO SEE MORE.
Traders, if you liked this idea or if you have your own opinion about it, write in the comments. I will be glad 🤝
Patience is the If You Have Any Question, Feel Free To Ask 🤗
Just follow chart with idea and analysis and when you are ready come in THE GROVE | VIP GROUP, earn more and safe, wait for the signal at the right moment and make money with us💰

USDCAD Sell-Short Trade Idea15minute timeframe entry
After NFP session Friday price has reached new highs. Scaling into lower timeframes we're anticipating the sell off to rebalance market structure.

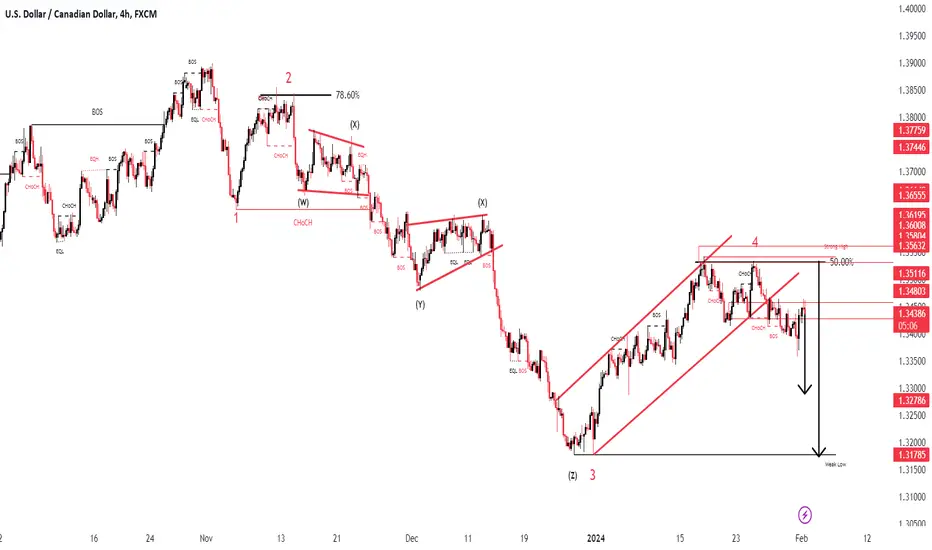
USDCAD Pair : USDCAD ( U.S Dollar / Canadian Dollar )
Description :
Completed " 1234 " Impulsive Waves and Rejection from Daily Demand Zone or Fibonacci Level - 50.0%. Bullish Channel as an Corrective Pattern in Short Time Frame with the Breakout of the Lower Trend Line. Strong Divergence in RSI and Break of Structure
USDCAD Local Short! USD-CAD went up to retest
The horizontal resistance
Of 1.34272from where
I think we will see
A local move down !

USDCADUSDCAD is displaying a bullish trend on the 4-hour chart, supported by a breakout above the ascending trendline after completing the 5th wave. The current formation suggests a bullish pattern following a 38% retracement and adherence to an ABC wave structure. Consider potential long entries in anticipation of a continued upward trajectory in the market.

USDCAD Bounce levelI am waiting for a retrace on USDCAD. After the break and retest of major trendline, i think we will see a sell pressure till the buy zone in the 1.334-1.336 area. This is a good bounce point targeting the 4Hr resistance at 1.3475
USDCAD I Bearish flag continuation Welcome back! Let me know your thoughts in the comments!
** USDCAD Analysis - Listen to video!
We recommend that you keep this pair on your watchlist and enter when the entry criteria of your strategy is met.
Please support this idea with a LIKE and COMMENT if you find it useful and Click "Follow" on our profile if you'd like these trade ideas delivered straight to your email in the future.
Thanks for your continued support!

USDCAD 4 HR | Bearish Trend ContinuationUSDCAD could fall 138 pips if it can stay below 1.35342
Why 1.35342?
Let's just round it and say $1.353 Canadian dollar. The exchange price for the United States Dollar is decreasing which means Canadians are able to buy the Dollar at a cheaper price.
Evidence
High(H) & Low(L)
Per the 4 our timeframe, price is declining. The current falling price of the Dollar price per the Canadian Dollar has been 1.34152(L), 1.35342(H), and 1.34136(L).
We can see the high and low prices are decreasing hence what is called LOWER LOWs and LOWER HIGHs.
Actions
The best action to take is to sell since currently the trend is down. That is what the chart per this timeframe is showing.
The best price to sell below as stated above is 1.35342. The entry price is between 1.35207 and 1.35342. This range equates to 13 pips.
This means if you enter at market order, you can wait for price to enter the range and provide evidence price can decrease.
Or, if you set a pending order , you can set a pending order at 1.35207 with a TP down to the low or further.
Why do I believe price can fall 138 pips? This is a Reward to risk drop from the pending order price of 1.35207 based on my stop loss placement.
Sidenote:
Your Reward to Risk will vary from mine analyzing this trade using your own risk management strategy and trading plan.
What can invalidate this trade?
If price pushes higher than 1.35342, showing evidence buyers have taken control, the trade in invalidated. Or, price could continue to drop from here which means we'd have to update the sell idea.
What would this mean?
If you entered the trade and price went higher than 1.35342 you'd be stopped out. However, if price were to continue lower without pushing past the highs, you'd be in profit.
Should you trade this?
If this fits how you trade, yes.
If not no.
Let's keep it that simple.
I hope you enjoyed this analysis.
Like this post and share it if you did.😁
Many blessings,
Shaquan

USDCAD bearish modeThere are indications that the USD/CAD pair is poised for a shift towards a bearish trend. A double top pattern has emerged on the 4-hour chart, suggesting a potential reversal. Additionally, the presence of a breakout from the existing trend raises the prospect of a trend reversal. Traders may anticipate a retest of the breached zone, providing an opportunity to enter at a discounted price and capitalize on a potential bearish movement."

Classic play USDCADI see a tipycal setup on USDCAD. Break of major trendline, retest, divergence on H4 timeframe. I expect a drop of the price till the daily resistance at 1.336. Dollar weakness should confirm the setup

USDCAD - Short IdeaThe USDCAD pair has overbought conditions and Canadian dollar gains strength on strong crude oil prices, which indicates a potential downside move for USDCAD.

USDCAD 23/01 Pair : USDCAD ( U.S Dollar / Canadian Dollar )
Description :
Completed " 12345 " Impulsive Waves and " A - 1234 " Impulsive Waves. Falling Wedge as an Corrective Pattern in Short Time Frame with the Breakout of the Upper Trend Line and Retracement. Break of Structure and Retracement.

DeGRAM | USDCAD completion AB=CD patternUSDCAD pulled back from the resistance level.
The market created a divergence and bounced off the support.
Price is most likely to break the channel and make a new extension.
We anticipate a retest of the major resistance and a complete AB=CD pattern.
-------------------
Share your opinion in the comments and support the idea with like. Thanks for your support!
