USDCAD : Short Trade , 4hHello traders, we want to check the USDCAD chart. The overall price trend is bearish and the price has made a correction to the indicated key level. We expect this level to play the role of a resistance level and the price will fall to around 1.31800. Good luck.
Usdcadanalysis

USDCAD - Looking To Buy Pullbacks In The Short TermH1 - Higher highs.
No opposite signs.
Until the strong support zone holds I expect the price to move higher further after pullbacks in the short term.

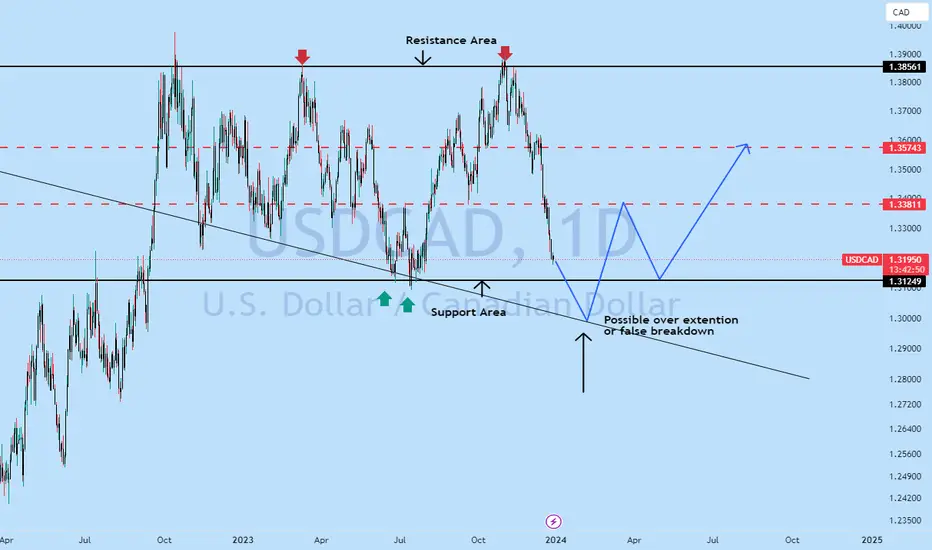
USDCAD HIGHEST SPECULATIONIm looking for a higher range of swing trades on this pair, price goes to the smartmoney transfer zone base on weekly, thats why it retrace to 1.34,
if price breaks below the line, still a buy for me. for that higher zone being mark up.
Looking for a good buy for swing.
Lets roll.
If you like swing trades master the art of smart money transfer, you either waiting for months and months for price to effects.
This is only my view base on the charts being given by TV, this is not a financial advice no signal being plotted just an Idea how market and money transfer being explained.
GOodluck and happy Trading.
FOr more ideas on swing follow for more.
Trade only at your own risk.

USDCAD Looking BullishIn the existing downtrend of the USDCAD currency pair, there is a distinct possibility that the exchange rate may approach and test the support level at 1.31142, unless there is a significant breakthrough in market dynamics. The technical analysis of the market structure points towards a potential pullback, implying a temporary reversal in the prevailing downward movement.
This setup could be viewed as an opportunity for traders to consider initiating buy positions. Buying at the support level involves anticipating a rebound or a corrective move in the exchange rate. Traders often look for confirmation signals, such as candlestick patterns or other technical indicators, to strengthen the rationale for entering a trade.
It's important to note that trading decisions should be made based on a comprehensive analysis of various factors, including technical, fundamental, and market sentiment indicators. Additionally, risk management strategies should be employed to mitigate potential losses in case the market does not behave as anticipated.

USDCAD possible buy after falsebreakdwon!The USDCAD trend remains downward, presenting a chance to test the 1.31142 support level unless a breakthrough occurs. The technical structure suggests a potential pullback, so contemplate purchasing in on Support
In the ongoing downtrend of USDCAD, there's a likelihood of testing the 1.31142 support level if no breakthrough occurs. The technical setup indicates the potential for a pullback, making it worth considering buying .
USDCAD H1 / BEARISH TREND, POTTENTIAL RETRACEMENT UNTIL 1.33100✅Hello Traders!
This is my perspective for USDCAD H1. As we can see, in this parity we're in a bearish trend, and I expect a retracement until the price of 1.33100, where we have a resistance level and also an OB. Also, it looks like a formation of BOSS vs COACH.
Traders, if you liked my idea or if you have a different vision related to this trade, write in the comments. I will be glad to see your perspective.
____________________________________
Follow, like, and comment to see my content:
www.tradingview.com

#USDCAD= Beginning of the big trade! FX:USDCAD possible downtrend to continue towards 1.3200, as price have shown significant bearish pressure in last few days of the week. while dxy remain bearish cad has gained vast majority of bullish interest and it is likely that this is just beginning of downfall for USDCAD.
Good Luck

USD/CAD Eyes Further Losses Following Hawkish Remarks by BoC GovUSD/CAD Eyes Further Losses Following Hawkish Remarks by BoC Governor
After a brief pause in its three-day losing streak, USD/CAD is hovering around 1.3380 during the Asian session on Monday. The Canadian Dollar (CAD) has gained momentum against the US Dollar (USD) following hawkish comments from Bank of Canada (BoC) Governor Tiff Macklem on Friday.
In his speech at the Canadian Club Toronto, Macklem hinted that the BoC is considering lowering the policy interest rate once they are confident that the economy is on a clear path back to price stability. This sentiment has bolstered the Canadian Dollar, putting additional pressure on USD/CAD.
Currently trading around 1.3382, the pair is entrenched in a strong bearish downtrend. The technical analysis suggests a potential short continuation, especially with the breakout of a Triangle pattern. Traders are eyeing downside targets of 1.3330 in the short term, with the possibility of extending losses to 1.3300.
As events unfold, market participants will closely monitor further developments, central bank communications, and economic indicators that could impact the trajectory of USD/CAD in the coming sessions.
Our preference
Short positions below 1.3450 with targets at 1.3330 & 1.3300 in extension.

USDCAD Long Term buying Trading IdeaHello Traders
In This Chart USDCAD HOURLY Forex Forecast By FOREX PLANET
today USDCAD analysis 👆
🟢This Chart includes_ (USDCAD market update)
🟢What is The Next Opportunity on USDCAD Market
🟢how to Enter to the Valid Entry With Assurance Profit
This CHART is For Trader's that Want to Improve Their Technical Analysis Skills and Their Trading By Understanding How To Analyze The Market Using Multiple Timeframes and Understanding The Bigger Picture on the Charts

USDCAD Analysis H1Here is my analysis for USDCAD on H1 using Order Block. The price could go bearish, you can put a pending order on the Order block or find an entry on LTF within OB Zone. Trade Safe!

USDCAD Could provide a nice bullish move due to CAD CPIThere are several reasons why we could see a bullish move in the USD/CAD currency pair:
1. **Moderating Canadian Inflation**: Multiple sources, including RBC Economics, NBF, and CIBC, suggest that Canadian inflation is expected to moderate in November. This is primarily driven by factors like a drop in gasoline prices, easing food price growth, and a slowdown in core inflation measures. A moderation in inflation can weaken the Canadian dollar (CAD) as it reduces the pressure on the Bank of Canada to raise interest rates, potentially leading to a bullish move in USD/CAD.
2. **Headline CPI within Target Range**: RBC Economics points out that the expected drop in inflation would bring the headline CPI back within the Bank of Canada's target range of 1%-3%. This suggests that there may not be excessive inflationary pressures, which can be interpreted as a positive for USD/CAD bulls.
3. **Economic Backdrop and Interest Rates**: The analysis mentions that further softening in the economic backdrop and slower price growth should reinforce the idea that the Bank of Canada is unlikely to hike interest rates further in the near term. This anticipation of a pause in rate hikes can weigh on the CAD, making USD/CAD more attractive to traders.
4. **Core Inflation Deceleration**: The expectation of continued deceleration in core inflation measures, such as CPI-trim and CPI-median, indicates that underlying inflationary pressures may not be a concern. This can weaken the CAD and support a bullish move in USD/CAD.
5. **Caution Regarding Rate Cuts**: It's worth noting that the central banks, including the Bank of Canada, are expected to be cautious about declaring victory over inflation too early and pivoting to rate cuts. However, the anticipation of an extended pause in rate hikes rather than an immediate pivot to rate cuts can be seen as a positive factor for USD/CAD bulls.
In conclusion, the expected moderation in Canadian inflation, the potential return of headline CPI within the target range, the economic backdrop, and the likelihood of a pause in rate hikes by the Bank of Canada, along with continued core inflation deceleration, are factors that could support a bullish move in USD/CAD.

USDCAD Buy Idea, Bullish reversal?Strong bearish rally makes this reversal unlikely. However, the opportunity is still out there. There are several confluences that give me this idea.
1 - Many buyers in this region according to volume profile.
2 - Fib 32.8%, at this region of support.
3 - It is a former support level.
Price could still keep pushing down however, be aware of that.

USDCAD Technical Analysis And Trade Idea Recently, the USDCAD has demonstrated a strong downward trend, touching a significant support level on both daily and weekly charts. In the accompanying video, a detailed examination of this trend is presented, carefully analysing price movements and identifying possible trading opportunities through a thorough analysis across multiple timeframes, ranging from weekly to as short as 15 minutes. Anticipate a comprehensive review covering price variations, market trends, trend evaluations, and crucial technical analysis components. It's crucial to emphasize that the information shared here is purely for educational purposes and should not be considered as financial advice.

USDCAD Long Term buying Trading IdeaHello Traders
In This Chart USDCAD HOURLY Forex Forecast By FOREX PLANET
today USDCAD analysis 👆
🟢This Chart includes_ (USDCAD market update)
🟢What is The Next Opportunity on USDCAD Market
🟢how to Enter to the Valid Entry With Assurance Profit
This CHART is For Trader's that Want to Improve Their Technical Analysis Skills and Their Trading By Understanding How To Analyze The Market Using Multiple Timeframes and Understanding The Bigger Picture on the Charts

USDCAD → Fell HARD to 135.000! Will We Bounce Here?USDCAD fell out of the bull channel as predicted from last week's analysis and hit the profit target of 135.500. We are now sitting on the 200EMA with no sign of support, do we short?
How do we trade this? 🤔
We do not short! We're on potential support, the RSI is at 32.00, we haven't had a good pullback in 10 bars, best to wait on the sidelines. What we *should* be looking for is a bounce off of the 200EMA as previous price action has shown. With a strong bull signal and confirmation bar closing on or near their highs, it would be reasonable to long at this level.
💡 Trade Idea 💡
Long Entry: 1.35470
🟥 Stop Loss: 1.34655
✅ Take Profit: 1.37100
⚖️ Risk/Reward Ratio: 1:2
🔑 Key Takeaways 🔑
1. Breakout of Bull Channel, Bias to Short.
2. Target Short TP at 200EMA 1.35200 Achieved.
3. Look for a test of Daily 200EMA Support.
4. Long if Bull Signal and Confirmation Candle Close.
5. RSI at 32.00, below Moving Average, Supports short-term Short.
⚠️ Risk Warning! ⚠️
Past performance is not necessarily indicative of future results. You are solely responsible for your trades. Trade at your own risk!
Like 👍 and comment if you found this analysis useful!

USDCAD Sell Zonehello traders
this is my analysis for usdcad
based on the fib the zone is very good to sell, as always risk managment is the key.

USDCAD : Long Trade , 4hHello traders, we want to check the USDCAD chart. The price is moving in a descending channel and has reached a key level that the price has reacted to several times in the past. We expect this level to play the role of a support level and the price will grow to around 1.34900. Good luck.

#USDCADFollowing the previous analysis, the usdcad currency pair is moving in a downward channel in the 2-hour period, which can continue its downward trend until the specified areas by completing the pullback to the broken support area.

USDCAD - Short from bearish order block ✅Hello traders!
‼️ This is my perspective on USDCAD.
Technical analysis: Here we are in a bearish market structure from 4H timeframe perspective, so I am looking only for shorts. I want price to make a retracement to fill the imbalance higher and then to reject from bearish order block + institutional big figure 1.35500.
Fundamental news: On Thursday we will see the results of Interest Rate on GBP and EUR.
Like, comment and subscribe to be in touch with my content!

USDCAD Waiting to form this zone, Im expecting the price to go below the monthly open price.
This is not a financial advice.
This is only my view on USDCAD for this week.
IF price goes below I will update it .
Trade at your own risk.
Follow for more.

DeGRAM | USDCAD descending channelUSDCAD is moving in a descending channel, and it's pulling back to resistance at 136500.
Price action is making lower lows and lower closes, indicating a bearish trend on the 1 hourly chart.
We might see continuation of the bearish trend from the confluence zone where we have fibo golden zone dynamic resistance and channel border.
-------------------
Share your opinion in the comments and support the idea with like. Thanks for your support!

USDCAD Long Trade USDCAD looks bullish on higher time frame and we go with bias as we have a clear demand level from where if get confirmation will be looking for buys

USDCAD Long Term buying Trading IdeaHello Traders
In This Chart USDCAD HOURLY Forex Forecast By FOREX PLANET
today USDCAD analysis 👆
🟢This Chart includes_ (USDCAD market update)
🟢What is The Next Opportunity on USDCAD Market
🟢how to Enter to the Valid Entry With Assurance Profit
This CHART is For Trader's that Want to Improve Their Technical Analysis Skills and Their Trading By Understanding How To Analyze The Market Using Multiple Timeframes and Understanding The Bigger Picture on the Charts
