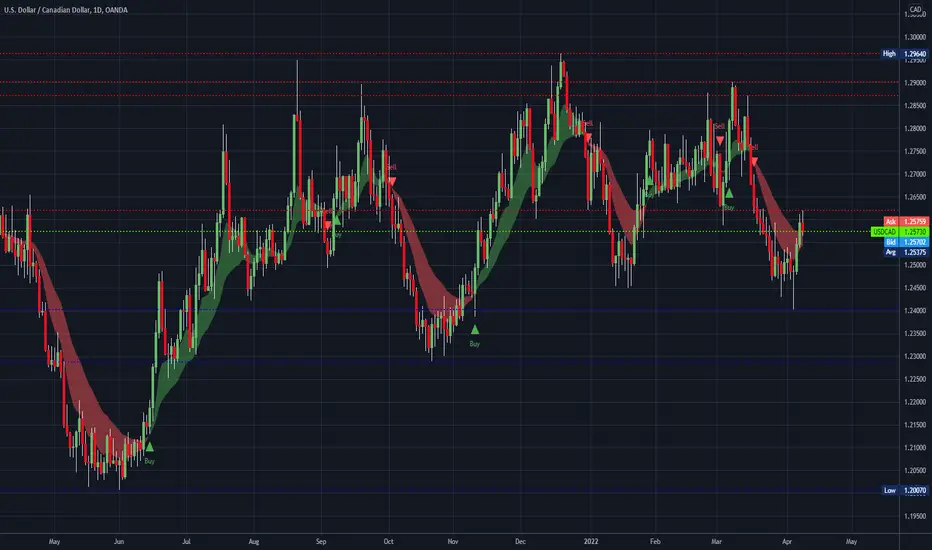
USDCAD Breakout Long !!
USD-CAD broke a key horizontal level
And the breakout is confirmed
Which makes me bullish biased on the pair
And I think that after the pullback and retest horizontal support areas AT 1.26300
We will see bullish continuation
to retest the horizontal resistance at 1.28585
Usdcadbuy


USD/CAD BULLISH NOW.......
AronnoFX will not accept any liability for loss or damage as a result of
reliance on the information contained within this channel including
data, quotes, charts and buy/sell signals.
If you like this idea, do not forget to support with a like and follow.
Traders, if you like this idea or have your own opinion about it,
write in the comments. I will be glad.

USDCAD SHORTS 📉📉📉Expecting bearish price action on USDCAD as price rejectes a bearish orderblock H4 area filling on it's way the bearish imbalance. We are in a bearish market structure from a HTF(higher time frame) premise and we should go lower from there, another bearish confluence is that price made the shift in strucutre from bullish into bearish (bos - break of structure area) price moved below the last low and retraced lower then the last high.
What do you think ? Comment below..

USDCAD SHORTS 📉📉📉Expecting bearish price action on USDCAD as price rejected a bearish orderblock area on the H4 and filled the bearish imbalance, price made the bearish bos (break of strucutre) and right now formed the lower high near the weekly lows. I think we will see lower prices for tomorrow and upcoming week on USDCAD.
What do you think ? Comment below..

USDCAD more room to the downsidein the mean time USDCAD pair facing support at the current levels
a break for the downside can lead the fall till reaching the next support level where a long position has a high chance to be profitable!

LONG ON USD/CADPrice has broken above resistance on a ascending triangle.
It has retested the old resistance as new support and currently has a hammer candle that has formed.
Plenty of room to move up on top of the DXY being strong this morning.

USDCAD Time Frame Day Look BullishFX:USDCAD
USDCAD Position Trading Time Frame Day
Look Cross S&P500 Index
My opportunity for Long ( BUY )

USDCAD top-down analysisHello traders, this is the full breakdown of this pair. We will take this trade if all the conditions are satisfied as discussed in the analysis. Smash the like button if you find value in this analysis and drop a comment if you have any questions or let me know which pair to cover in my next analysis.

USDCAD Prediction H1Here is my view for USDCAD on H1. The price should go up, you can put a pending order on the Order block or find an entry on LTF within OB Zone. Trade Safe!

USDCAD Bullish to 1.28943//REPOST//
Hello ATFX Academy members, we got a fire setup ahead of us. From the YouTube tutorial I just explained, the reason why I was aiming to buy USDCAD. The overall trend is Bullish, so we are only looking for buy opportunities. We saw a clear BOS, after liquify being taking place with EHQ and EQL. Now we are awaiting for a retest off our POI. If the reaction is well within the 1-3min TF showing strong bullish momentum then I’ll be buying!

USDCAD bullish to 1.28943Hi ATFX Academy members, from the YouTube tutorial I explained why I was aiming to but USDCAD. The overall trend is Bullish so we are only looking for buy opportunities. We saw a clear BOS take place, and now we are awaiting for the retest to our POI before taking the trade.
Let’s see how this plans out. Let me know your thoughts traders.

USDCADThe US dollar has rallied significantly during the trading session on Thursday to continue the recovery against the Canadian dollar. The 1.25 level has offered significant support multiple times, and it looks as if we are rallying away from that level. The 50 Day EMA above is offering a bit of dynamic resistance, and it has broken down below the 200 Day EMA. That being said, this is a range-bound market so, therefore, moving averages do not mean too much.
Looking at this chart, the market continues to see a lot of noisy behavior, as is clearly defined by the floor at the 1.25 level, and the ceiling at the 1.2850 level. Ultimately, this is a market that I think continues to go back and forth over the longer term, and perhaps on the whims of the crude oil market. Remember that the Canadian dollar is highly levered to the crude oil market, which is in the process of breaking down. If that continues, then I anticipate that the US dollar will rally from here and eventually make its way to the top of the rectangle that I have marked on the chart.
On the downside, if we do pull back from here, I think there is plenty of support at the 1.25 level to keep the market afloat. In fact, we have already tried to break the market down below there more than once, both times ending up in significant hammers. As long as that is going to be the case, it looks as if there are a lot of defenders in that general vicinity, and therefore a breach of the hammer from the Tuesday session would be a very negative turn of events, wiping out the 1.24 handle, an opening up a move down to the 1.22 level.
Keep in mind that this pair does tend to be very choppy in general, as the United States and Canada do so much cross-border business. Ultimately, this is a market that I think continues to see a lot of back and forth, but it does look like we are trying to find some type of reconciliation to the upside. I do not necessarily see that this market could break out above, but that could be an argument to be made on longer-term charts. In the short term, it is going to be very choppy with an upward tilt.
USDCAD LongHello traders, this is my opinion on what will happen next on USDCAD .
➖➖➖➖➖➖➖➖➖➖➖➖
Price is now trending in accumulation area and clearly looking bullish.
USDCAD now consolidating on support @ 1.24900 and will rise, so best buy scenario is "buy now" as trend line support area is getting stronger.
I expect the price to rise as it already reversed the trend last week. My goal is price to reach resistance @ 1.26000
➖➖➖➖➖➖➖➖➖➖➖➖
Please use small lot's if you gonna trade on this, always use proper risk management and do more research before opening a position.
➖➖➖➖➖➖➖➖➖➖➖➖
My TradingView Community if you like my idea, please like and follow for support.
Also if you have any opinion please write in the comments, always open to new ideas.
Thanks for passing by and have a good day traders!
➖➖➖➖➖➖➖➖➖➖➖➖

USDCAD LONGUSDCAD - new forecast (nr1)
➖➖➖➖➖➖➖➖➖➖➖➖
This is my expectation on USDCAD this week, i think from next week we will see a bullish trend.
Now price had dropped to a strong support level @ 1.24750 where it will stay this week.
Best buy scenario is to wait for price to settle around support level @ 1.24750 before going long on this pair.
Hopefully we will have a bull chart this months and a good algo trade.
➖➖➖➖➖➖➖➖➖➖➖➖
This is just a note for myself for the next coming week, updates will come along daily.
➖➖➖➖➖➖➖➖➖➖➖➖
Please use small lots if you gonna trade on this idea!
➖➖➖➖➖➖➖➖➖➖➖➖
Please like, comment and share if you like my idea.
➖➖➖➖➖➖➖➖➖➖➖➖

USDCAD buy at demandUSDCAD has been showing strong sign of a possible upside movement. We saw a clear break of structure, and liquidity currently in the move. Awaiting for price to pull back to retest our demand for a buy to next supply.

USDCAD LONG - Buy Entry - H4 ChartUSDCAD LONG - Buy Entry - H4 Chart
Buy @ Market
Symbol: USDCAD
Timeframe: H4
Type: BUY
Entry Price: Buy @ Market
Resistance @ 1.29439
Resistance @ 1.28315
Resistance @ 1.26605
Resistance @ 1.25930
Support @ 1.24867
Support @ 1.24557
✅ If you liked this analysis, please consider Following and giving it a Thumbs Up 👍
✅ If you have any feedback or questions, please leave a comment below as I answer each comment 💬
✅ Wishing you enjoyable successful trading 🙏

USD/CAD BULLISH NOW.......
Hello Traders, here is the full analysis for this pair,
let me know in the comment section below if you have any questions,
the entry will be taken only if all rules of the strategies will be
satisfied. I suggest you keep this pair on your watch list and see if
the rules of your strategy are satisfied.
Dear Traders,
If you like this idea, do not forget to support with a like and follow.
PLZ! LIKE COMMAND AND SUBSCRIBE


USDCAD >Buy if TBox BreakUp (Resist) Tf Hourly or BO Mid Band 4HUSD-CAD
Weekly > SideWay > Mid Area
Daily > OverSold, at Bottom
4H > OverSold / #GreenArea (Wait for Miid Band BreakOut)
1H > SideWay
#Note: Ready to buy long on Tf Hourly & 4H:
Buy if TBox BreakUp ( Resistance ) Tf Hourly
or
Breakout Mid Band Tf 4H
(More Komfom Wait for Breakout Miid Band Tf 4H)
#iQTrader #SaDis
#Fx #FOREX💰
#ChartDiscountEverything

USDCAD BUY ANALYSISLooking at USDCAD on 1H
Currently looking for long/buy position
We looking for possible formation of the reaction phase at the current demand zone


USDCAD UP Trend.!#USDCAD Looking for Buy trade setup as I mentioned in the Chart.!
Keep Supporting LIKE, COMMENT And FOLLOW.!
Thank You.!
