Usdcadbuy
USD/CAD Technical Analysis
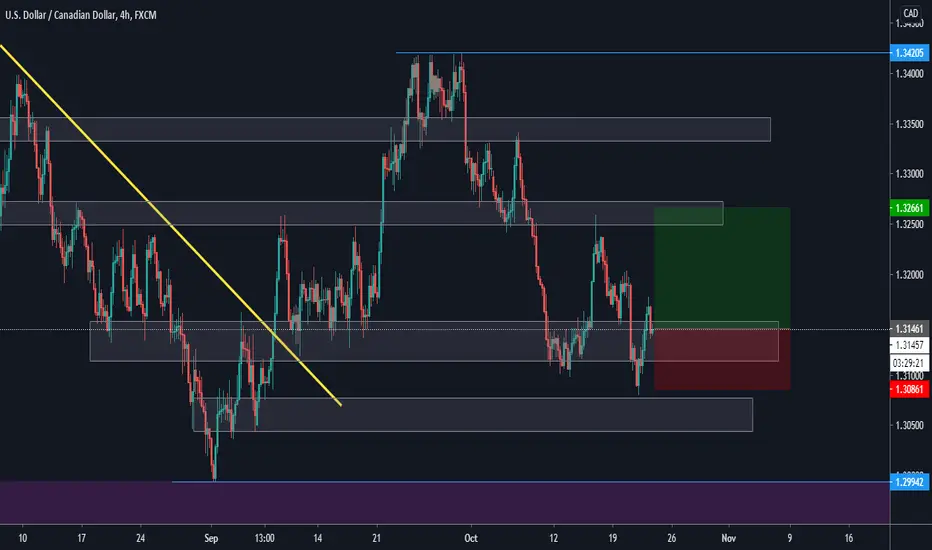
The counter has bounced off strongly from the support 1.31, after trapping the bears with a fakeout.
Now, it has taken down a bearish trendline as well.
Hence, we expect the pair to be bullish in the short-term.

USDCAD - SWING - 20. OCTO. 2020Welcome to our weekly trade setup ( USDCAD )!
-
1 HOUR
Price indecision right now, expecting another push to the upside tho!
4 HOUR
Overall bearish market about to turn bullish.
DAILY
Good price action after pullback.
-
FOREX SWING
BUY USDCAD
ENTRY LEVEL @ 1.31610
SL @ 1.31080
TP @ 1.32410
Max Risk. 0.5% - 1%!
(Remember to add a few pips to all levels - different Brokers!)
Leave us a comment or like to keep our content for free and alive.
Have a great week everyone!
ALAN

USDCAD SWING TRADE 16-Oct-2020USDCAD-Technical analysis
^ Trend reversal
^ Downside pressure
^ Minor pull back - Bearish correction
^ Upward momentum
^ Fundamental support for USD
^ Technical support for CAD
SWING TRADE-USDCAD
Buy Entry @ 1.31580
Take profit @ 1.33240
Stop lose @ 1.31080
70 Pips target R:R 1:1.5
💌 Leave your valuable comments and suggestions related to this idea in the comment section.
Thanks for your time. Good day guys 💝


usdcadusdcad is on a downtrend.
what i am waiting from this pair is a retracement at fibb levels 0.5- 0.618 cuy it looks over-extended.
If this happen i will look for sells with target Demand zone 1.30000


USDCAD CHANNEL CONTINUATIONI think this pair is going to advance through the channel and it is supposed to go long for some time until it reaches the top part of the channel . Any thoughts leave in the comment section

USD BUY IDEALooking for Buys on USDCAD. Wait for price to dip 10-15 pips for a better entry so theres less drawdown. Could enter now & still have good risk to reward so I'm staying out for now.
Manage Risk & Good Luck!
Pip Hunt Safely!

USD/CAD TO 1.35000USD/CAD fib retest to weekly support.
Break above previous week highs then to 1.35000. 🚀
Continuing weekly trend.

USDCAD LONGI believe this pair is in an up trend with the dollar 💵 index DXY. USDCAD pulled back last night, so I’m going to try and join this continuation.

USDCAD 1H-TIMEFRAME ANALYSISUSDCAD 1H-TIMEFRAME ANALYSIS
Hello ladies and gentlemen
This is my new idea for USDCAD
My idea is that the pair will continue to uptrend
targets
1.352
1.364
I hope my idea is clear
Support me by like and share
Good luck

USD/CAD: positional swing LONG tradehi !
all the analysis turned into the trade in the chart.
the wide stop is to ensure that the play goes on and leaving strengthening (=adding longs) in case goes lower the coming few sessions.
I do expect the target to print still this month.
check the trade every 8hrs and adjust size accordingly. if lower than entry add if above entry reduce risk.
any questions?! - contact me
good luck !

USD/CAD - Break & RetestPrice has formed a break and retest. We are looking for buy entries if support holds area.

USDCAD is fighting with 1.32000 levelUSDCAD
The price is trading below the 1.32000 which is currently acting as a resistance for the bullish run. In one hour the price is also trading above the 50,100,200 exponential moving average is a clear sign of continuation of bull.
On volume profile the price is also above POC – Point of control. On Elliott wave pattern currently third wave is forming.
From sep low 1.2993& the uptrend trend line is holding this pair. At 1.31600 bullish engulfing candle is formed.
We can buy this pair at current level and the potential take profit will be 1.32700. SL may place below the trendline.
Please give us a thumbs up if u like our work and do follow us so that you can get a regular update about upcoming setups and ideas
Disclaimer
It’s not a financial advice. Do the analyze and take a decision.


USD/CAD TO 1.33500If we have a pullback this week by Wednesday, we can expect to see a huge upside push tapping the weekly level of 1.33500. (Fib retracements)

USD/CAD 12.09.2020Open Position: Buy 1.31526 (valid until 15.09.20)
Take Profit: 1.31894
Stop Loss: 1.31158


USDCAD LONG
ALL ANALYSIS ARE MADE USING ONLY PRICE ACTION, NO INDICATORS. MULTIPLE TIMEFRAMES ARE INVOLVED BEFORE TAKING A TRADE.
==> FIND THIS USEFUL?: LEAVE A LIKE AND FOLLOW
==> OTHER THOUGHTS?: COMMENT SO WE DISCUSS
==> PLEASE TAKE NOTE!! DO NOT SET LIMIT ORDERS. GET IN ONLY WHEN YOU GET THE GO SIGNAL FROM PRICE ACTION

USDCAD Long OppurtunityAccording to my idea the Resistance and support lines in the green are strong . The price has broken out from the previous resistance and also retested the line and now revered and headed bullish on a 4hr chart.
There is an opportunity for a BUY trade 1.31654 with a take profit at 1.32541.
