audusd 1h outlook for the dayI got a wadge in this pair but it is trading in the middle of this range now i am waiting to break any of this like I have drawn.....after breaking this line the execution opportunity will come ....keep in mind anything can happen so risk management is the key of profitability
Usdcadbuy

USDCAD Trade IdeaMarket Analysis: USDCAD on the Daily Time Frame
The USDCAD currency pair has exhibited a notable upward trend on the daily time frame. This trend is characterized by a consistent pattern of higher highs and higher lows, indicating bullish momentum. Additionally, there is a clear breakout (BoS) to the upside, further supporting the bullish bias.
As we anticipate a retracement in price, it’s essential to consider the impact of upcoming calendar events throughout the week. These events can introduce volatility and potentially influence the pair’s movement.
Given the technical context, my bias leans strongly toward a bullish entry near the fifty percent Fibonacci retracement level. I recommend placing a wide stop-loss at 1.34400 to allow for market fluctuations. Our target should align with the previous highs as we capitalize on the ongoing bullish trend.
Remember to monitor the economic calendar closely and adjust your strategy accordingly. Happy trading!

USDCAD BUY | Day Trading AnalysisHello Traders, here is the full analysis.
Price reversal going up, levels for BUY .. GOOD LUCK! Great BUY opportunity USDCAD
I still did my best and this is the most likely count for me at the moment.
Support the idea with like and follow my profile TO SEE MORE.
Traders, if you liked this idea or if you have your own opinion about it, write in the comments. I will be glad 🤝
Patience is the If You Have Any Question, Feel Free To Ask 🤗
Just follow chart with idea and analysis and when you are ready come in THE GROVE | VIP GROUP, earn more and safe, wait for the signal at the right moment and make money with us💰

USDCAD BUY | Day Trading AnalysisHello Traders, here is the full analysis.
The completed correction, hint at the continuation of growth. GOOD LUCK! Great BUY opportunity USDCAD
I still did my best and this is the most likely count for me at the moment.
Support the idea with like and follow my profile TO SEE MORE.
Traders, if you liked this idea or if you have your own opinion about it, write in the comments. I will be glad 🤝
Patience is the If You Have Any Question, Feel Free To Ask 🤗
Just follow chart with idea and analysis and when you are ready come in THE GROVE | VIP GROUP, earn more and safe, wait for the signal at the right moment and make money with us💰

USD/CAD LONG from 1.3473 USD/CAD has broken through the neckline of a W pattern and has the look of heading higher.
The price is now above all significant EMA's that are now grouped on the H1 time frame and its the same story on the H4 time frame.
With no significant news until tomorrow's US CPI numbers at 13:30 GMT , there shouldn't anything that would encourage USD/CAD BEARS so the WR1 pivot at 1.3530 looks a reasonable target though we're not likely to get there until well into tomorrow.
STOP is under the recent lows 1.3449.

USDCAD - Long opportunity ✅ Hello traders!
‼️ This is my perspective on USDCAD.
Technical analysis: Here I think we are still bullish, so I am looking for short. I expect price to continue the retracement to fill half of imbalance and then to reject from support zone + institutional big figure 1.34000.
Fundamental news: Tomorrow we will see results of Unemployment Rate on CAD.
Like, comment and subscribe to be in touch with my content!

USDCAD → Bottom of Trading Range! Looking for Long Entry.USDCAD is at the bottom of a trading range and near the Weekly 200EMA which acted as good support in the last bull trend opportunity from July to October. Now that we're here, should we long?
How do we trade this? 🤔
We almost have enough price action to justify a long entry. Longing now would be maximally risky because we don't have a good buy signal bar yet. You could enter now with the understanding that every time we've hit these levels since September 23, a long as been profitable. I prefer more confirmation and thus, more probability before entering a trade. I think we need at least a good strong buy signal closing in the 131.300 - 131.600 range. With this signal, we can enter a trade a 1:2 Risk/Reward Ratio to the top of the trend.
Wait for a couple more Daily candles to show such support before longing. Until then, lets be patient on the sidelines!
💡 Trade Ideas 💡
Long Entry: 132.665
🟥 Stop Loss: 130.000
✅ Take Profit: 138.000
⚖️ Risk/Reward Ratio: 1:2
🔑 Key Takeaways 🔑
1. Trading Range after Bullish Price Action, Bias to Long.
2. Near Trading Range Support and Weekly 200EMA, Look for Entry.
3. Look for Test of Support before Entering a Trade.
4. Target 1:2 Risk/Reward, Stop Loss below 200EMA, Take Profit at Top of Range.
5. RSI at 39.00 and below Moving Average. Needs to Fall More before Long.
💰 Trading Tip 💰
Trends typically have three legs in either direction. Signals of a reversal include strong buy or sell bars with large wicks, higher highs and lower lows get weaker, and responses to the reverse direction get stronger. Confirmation lies with double and triple bottoms with a strong candle closing on or near its low/high.
⚠️ Risk Warning! ⚠️
Past performance is not necessarily indicative of future results. You are solely responsible for your trades. Trade at your own risk!
Like 👍 and comment if you found this analysis useful!

USDCAD H4 / PERFECT HIT OF THE OB / SHORT TRADE ACTIVE ✅Hello Traders!
This is my idea related to USDCAD H4. I see a small accumulation at the moment, I expect a bearish move taking into consideration this accumulation in the area of the OB.
The target is before the FVG.
Follow, like, and comment to see my content:
www.tradingview.com

USDCAD Trade IdeaThe USDCAD has reached a pivotal juncture,reaching into a critical resistance level. While the larger trend remains firmly bullish, I anticipate a temporary pullback before seeking an optimal entry point.
1D Balance Area: As you can see on the attached chart, price has formed a significant balance area on the daily timeframe at the accumulation phase. A Fibonacci retracement drawn from the low to the high reveals a confluence zone around the 61.8% level potentially offering a high-probability entry point for opportunistic longs. Note: This analysis is for educational purposes only, and I'm not dispensing financial advice. Always conduct your own due diligence before making any trading decisions.

USDCAD: New Year 2024, New Outlook! Merry Christmas Everyone,
Dear Traders,
This week we waited USD to reverse and show some strong bullish momentum though it did not, however, this week we may see some bullish price movement. It is advisable that we may see uncertain price action due to low liquidity and low volume which is result of holidays worldwide.
Good Luck and Trade Safe.

USDCAD Long Term buying Trading IdeaHello Traders
In This Chart USDCAD HOURLY Forex Forecast By FOREX PLANET
today USDCAD analysis 👆
🟢This Chart includes_ (USDCAD market update)
🟢What is The Next Opportunity on USDCAD Market
🟢how to Enter to the Valid Entry With Assurance Profit
This CHART is For Trader's that Want to Improve Their Technical Analysis Skills and Their Trading By Understanding How To Analyze The Market Using Multiple Timeframes and Understanding The Bigger Picture on the Charts


USDCAD - Short after filling the imbalance ✅Hello traders!
‼️ This is my perspective on USDCAD.
Technical analysis: Here I think we have a good short opportunity from premium zone if price continues to go higher to fill the imbalance and then to react from institutional big figure 1.35000.
Like, comment and subscribe to be in touch with my content!

USDCAD (H1) Buy now at 1.33737USDCAD (H1)
Appears to have a pattern of narrowing the fluctuation range
(Ignoring Non-farm abnormalities)
Buy now at: 1.33737
Stop loss at: 1.33288
Take profit at: 1.34727

USDCAD - Looking To Buy Pullbacks In The Short TermH1 - Higher highs.
No opposite signs.
Until the strong support zone holds I expect the price to move higher further after pullbacks in the short term.

USDCAD Looking BullishIn the existing downtrend of the USDCAD currency pair, there is a distinct possibility that the exchange rate may approach and test the support level at 1.31142, unless there is a significant breakthrough in market dynamics. The technical analysis of the market structure points towards a potential pullback, implying a temporary reversal in the prevailing downward movement.
This setup could be viewed as an opportunity for traders to consider initiating buy positions. Buying at the support level involves anticipating a rebound or a corrective move in the exchange rate. Traders often look for confirmation signals, such as candlestick patterns or other technical indicators, to strengthen the rationale for entering a trade.
It's important to note that trading decisions should be made based on a comprehensive analysis of various factors, including technical, fundamental, and market sentiment indicators. Additionally, risk management strategies should be employed to mitigate potential losses in case the market does not behave as anticipated.

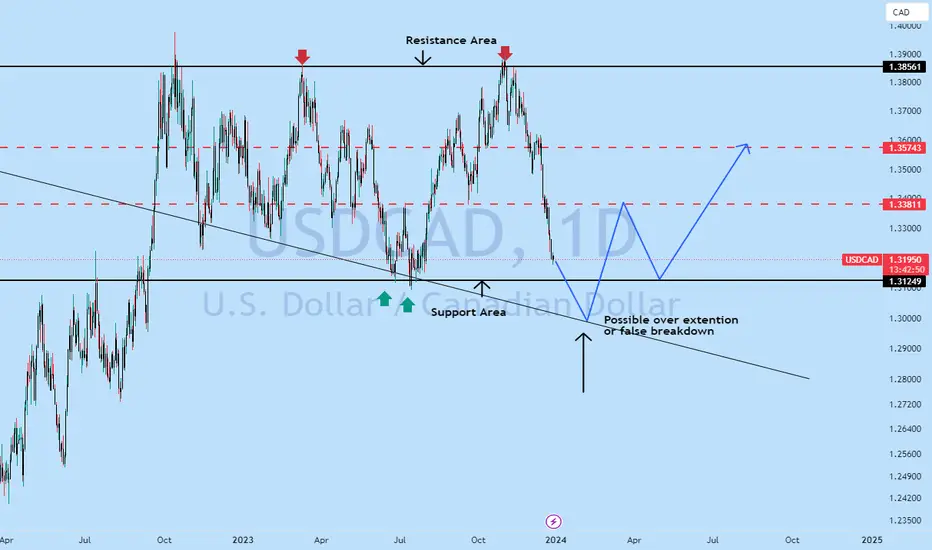
USDCAD possible buy after falsebreakdwon!The USDCAD trend remains downward, presenting a chance to test the 1.31142 support level unless a breakthrough occurs. The technical structure suggests a potential pullback, so contemplate purchasing in on Support
In the ongoing downtrend of USDCAD, there's a likelihood of testing the 1.31142 support level if no breakthrough occurs. The technical setup indicates the potential for a pullback, making it worth considering buying .
USDCAD Could provide a nice bullish move due to CAD CPIThere are several reasons why we could see a bullish move in the USD/CAD currency pair:
1. **Moderating Canadian Inflation**: Multiple sources, including RBC Economics, NBF, and CIBC, suggest that Canadian inflation is expected to moderate in November. This is primarily driven by factors like a drop in gasoline prices, easing food price growth, and a slowdown in core inflation measures. A moderation in inflation can weaken the Canadian dollar (CAD) as it reduces the pressure on the Bank of Canada to raise interest rates, potentially leading to a bullish move in USD/CAD.
2. **Headline CPI within Target Range**: RBC Economics points out that the expected drop in inflation would bring the headline CPI back within the Bank of Canada's target range of 1%-3%. This suggests that there may not be excessive inflationary pressures, which can be interpreted as a positive for USD/CAD bulls.
3. **Economic Backdrop and Interest Rates**: The analysis mentions that further softening in the economic backdrop and slower price growth should reinforce the idea that the Bank of Canada is unlikely to hike interest rates further in the near term. This anticipation of a pause in rate hikes can weigh on the CAD, making USD/CAD more attractive to traders.
4. **Core Inflation Deceleration**: The expectation of continued deceleration in core inflation measures, such as CPI-trim and CPI-median, indicates that underlying inflationary pressures may not be a concern. This can weaken the CAD and support a bullish move in USD/CAD.
5. **Caution Regarding Rate Cuts**: It's worth noting that the central banks, including the Bank of Canada, are expected to be cautious about declaring victory over inflation too early and pivoting to rate cuts. However, the anticipation of an extended pause in rate hikes rather than an immediate pivot to rate cuts can be seen as a positive factor for USD/CAD bulls.
In conclusion, the expected moderation in Canadian inflation, the potential return of headline CPI within the target range, the economic backdrop, and the likelihood of a pause in rate hikes by the Bank of Canada, along with continued core inflation deceleration, are factors that could support a bullish move in USD/CAD.

Long opportunity on USDCAD for this week??Share your idea in the comment section of this pair and let's debate
Good Week, Michel_FRX
DISCLAIMER:
1. Be aware this is not financial advice so trade carefully and have stop loss for sure
2. Past performance is not indicative of future results

USDCAD → Fell HARD to 135.000! Will We Bounce Here?USDCAD fell out of the bull channel as predicted from last week's analysis and hit the profit target of 135.500. We are now sitting on the 200EMA with no sign of support, do we short?
How do we trade this? 🤔
We do not short! We're on potential support, the RSI is at 32.00, we haven't had a good pullback in 10 bars, best to wait on the sidelines. What we *should* be looking for is a bounce off of the 200EMA as previous price action has shown. With a strong bull signal and confirmation bar closing on or near their highs, it would be reasonable to long at this level.
💡 Trade Idea 💡
Long Entry: 1.35470
🟥 Stop Loss: 1.34655
✅ Take Profit: 1.37100
⚖️ Risk/Reward Ratio: 1:2
🔑 Key Takeaways 🔑
1. Breakout of Bull Channel, Bias to Short.
2. Target Short TP at 200EMA 1.35200 Achieved.
3. Look for a test of Daily 200EMA Support.
4. Long if Bull Signal and Confirmation Candle Close.
5. RSI at 32.00, below Moving Average, Supports short-term Short.
⚠️ Risk Warning! ⚠️
Past performance is not necessarily indicative of future results. You are solely responsible for your trades. Trade at your own risk!
Like 👍 and comment if you found this analysis useful!

USDCAD : Long Trade , 4hHello traders, we want to check the USDCAD chart. The price is moving in a descending channel and has reached a key level that the price has reacted to several times in the past. We expect this level to play the role of a support level and the price will grow to around 1.34900. Good luck.

USD/CAD!! New week for recovery early December✍️ NOVA hello everyone, Let's comment on USDCAD price next week from 4/12 - 8/12/2023
🔥 World situation:
The Canadian Dollar (CAD) is currently experiencing upward movement in trading on Friday, once again strengthening against its primary counterpart, the US Dollar (USD). This comes after Canadian employment data surpassed market expectations by a significant margin. Throughout the week, the Canadian Dollar has been one of the best-performing currencies, exhibiting a 1% increase against the US Dollar since Monday's opening rates.
In November, Canada witnessed nearly double the number of job additions compared to the median market forecast. Approximately 25,000 new positions were created, surpassing the projected 15,000 and outpacing October's 17,500 new jobs.
🔥 Identify:
A week without much important news about CAD, the price is moving towards a fairly strong support zone along with the resistance zone according to FIBONACCY, setting up a BUY signal.
🔥 Technically:
Based on the resistance and support areas of the USDCAD price according to the D1 frame, NOVA identifies the important key areas as follows:
Resistance: 1.35800 ; 1.37800
Support : 1.34450
🔥 NOTE:
Note: Nova wishes traders to manage their capital well
- take the number of lots that match your capital
- Takeprofit equal to 4-6% of capital account
- Stoplose equal to 2-3% of capital account
- The winner is the one who sticks with the market the longest

usdcad but signal. Don't forget about stop-loss.
Write in the comments all your questions and instruments analysis of which you want to see.
Friends, push the like button, write a comment, and share with your mates - that would be the best THANK YOU.
P.S. I personally will open entry if the price will show it according to my strategy.
Always make your analysis before a trade
Update usdcad .saw our target👇👇👇👇
www.tradingview.com
