USD/CAD Rises to 2-Month HighUSD/CAD Rises to 2-Month High
Today, the USD/CAD exchange rate briefly exceeded the 1.3870 mark – the highest level seen this summer. In less than ten days, the US dollar has strengthened by over 2% against the Canadian dollar.
Why Is USD/CAD Rising?
Given that both the Federal Reserve and the Bank of Canada left interest rates unchanged on Wednesday (as expected), the primary driver behind the pair’s recent rally appears to be US President Donald Trump's decision to impose tariffs on several countries – including Canada:
→ Despite efforts by Prime Minister of Canada Mark Carney to reach an agreement with Trump, no deal was achieved;
→ Canadian goods exported to the US will now be subject to a 35% tariff;
→ The tariffs take effect from 1 August;
→ Goods compliant with the United States-Mexico-Canada Agreement (USMCA) are exempt.
Media analysts note that the tariffs are likely to increase pressure on the Canadian economy, as approximately 75% of the country's exports are destined for the United States.
USD/CAD Technical Analysis
At the end of July, the price formed a steep ascending channel (A-B), with bullish momentum confirmed by a decisive breakout above the 1.3790 resistance level, as illustrated by the arrow:
→ the pullback before the breakout was relatively shallow;
→ the bullish breakout was marked by a long bullish candlestick with a close near the session high;
→ following the breakout, the price confidently consolidated above 1.3790.
Provided that the fundamental backdrop does not undergo a major shift, bulls might attempt to maintain control in the market. However, the likelihood of a correction is also increasing, as the RSI indicator has entered extreme overbought territory.
Should USD/CAD show signs of a correction after its steep ascent, support might be found at:
→ line C, drawn parallel to the A-B channel at a distance of its width;
→ the previously mentioned 1.3790 level, which now acts as a support following the breakout.
This article represents the opinion of the Companies operating under the FXOpen brand only. It is not to be construed as an offer, solicitation, or recommendation with respect to products and services provided by the Companies operating under the FXOpen brand, nor is it to be considered financial advice.
Usdcaddaily

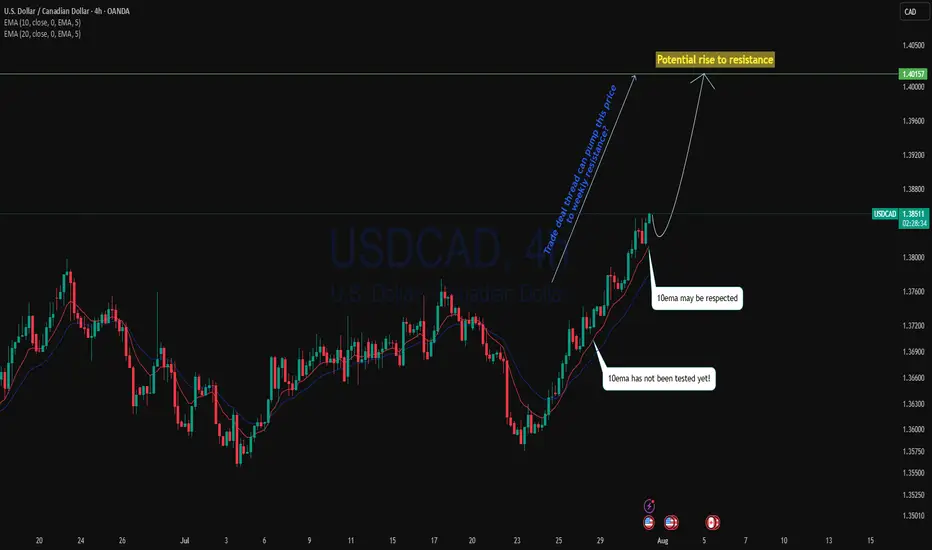
Trade deal thread could pump USDCAD?USDCAD as with the bounce off the monthly support level, current is a strong uptrend.4H perspective, price is trading above 10ema since the cross over of 20ema and 10ema price is pushing back to the upside. With trade deal thread, including upcoming GDP on CAD could pump this price back to the resistance ?
As 10ema has not been tested since cross over, we may see the price to back to the upside with respecting the 10ema.
Buying on EMA is a high probability trade setup.
USD/CAD) strong bullish trend Read The captionSMC trading point update
Technical analysis of USD/CAD (U.S. Dollar vs Canadian Dollar) on the daily timeframe. Here's a breakdown of the trade
---
Technical Breakdown:
1. Breakout from Descending Channel:
Price has broken out above a descending trend channel (marked with black lines).
This breakout suggests a potential trend reversal or at least a bullish correction phase.
2. Key Support Zone (Yellow Box):
The yellow zone marked as “support level” was a strong consolidation area.
Price has bounced off this zone multiple times, forming a solid base for further upside.
3. Bullish Price Action:
Price has closed above the previous resistance (now support), signaling bullish intent.
Current candle structure confirms strength with bullish continuation patterns.
4. RSI Indicator:
RSI is at 56.38, indicating bullish momentum without being overbought.
Suggests there is room for further upside before exhaustion.
---
Target Levels:
Target Point 1: 1.37968 (near-term resistance)
Target Point 2: 1.38615 (intermediate target)
Target Point 3: 1.39064–1.39090 (longer-term resistance near the 200 EMA)
Mr SMC Trading point
---
Trade Idea Summary:
Bias: Bullish
Entry Zone: Break and retest of the yellow support area (~1.368–1.371)
Target Zone: 1.379 – 1.390
Invalidation: Break below the yellow support zone
Confluence: RSI strength + breakout of downtrend channel + structural support
plesse support boost 🚀 this analysis)

US Dollar Strengthens Following Trump’s Tariff DecisionUS Dollar Strengthens Following Trump’s Tariff Decision
US President Donald Trump has announced his decision to impose new tariffs:
→ For Canada, tariffs are set at 35%. They are scheduled to take effect on 1 August, although negotiations may take place before this date, potentially influencing Trump’s final stance.
→ For many other countries, tariffs may be set at 15% or 20%;
→ For the European Union, the exact tariff levels have not yet been disclosed.
Overall, Trump’s latest comments have added to the uncertainty surrounding the specific tariffs to be applied to each country. The financial markets reacted as follows:
→ The US dollar strengthened against other currencies (including the Canadian dollar);
→ Equity markets saw a modest decline.
Technical Analysis of the USD/CAD Chart
As soon as the announcement of a 35% tariff on Canadian imports to the US was made public, the USD/CAD rate spiked sharply (as indicated by the arrow), reaching levels last seen at the end of June. In the hours that followed, the pair stabilised.
Taking a broader view, the chart appears to show a triangular formation, which consists of:
→ A descending resistance line (R);
→ A key support level (S) around 1.3570.
From this perspective, it is worth noting that the bulls’ attempt to break above the resistance line amid the 35% tariff news did not succeed, indicating strong selling pressure.
At the same time, the price action of USD/CAD in early July allows us to identify a local support level (marked by the blue line). This suggests that, for now, the pair is consolidating within a formation bounded by the blue support line and resistance line R.
However, how long this consolidation will last, and which direction the breakout will take, will most likely depend on the next round of news regarding US–Canada trade negotiations.
This article represents the opinion of the Companies operating under the FXOpen brand only. It is not to be construed as an offer, solicitation, or recommendation with respect to products and services provided by the Companies operating under the FXOpen brand, nor is it to be considered financial advice.

USDCADThis is a technical scenario, not a guaranteed prediction. The zone is becoming a key area of interest. No confirmation, no trade.
If confirmed breakout and retest occur, I’ll look to trade in alignment with the new structure.

USDCAD ( Weekly CLS Setup) Everything is clear here: a bearish order flow, with signs of manipulation and liquidity grabs above the structure highs. EUR/USD is trending upwards, presenting a good opportunity for a short trade on USD/CAD

#USDCAD: 1000+ Pips Big Bullish Move With Three TargetsThe USDCAD is currently in a bearish trend since the day has dropped significantly and is still falling. We anticipate the price to drop slightly more before it reaches our entry zone. There are two entry points, and you can choose either one that aligns with your views. There are three targets, and you can set take profit targets that suit you best.
Good luck and trade safely.
Thanks for your support! 😊
If you want to help us out, here are a few things you can do:
- Like our ideas
- Comment on our ideas
- Share our ideas
Team Setupsfx_
❤️🚀

#USDCAD: Two Major Buying Zones, Patience Pays! As previously analysed, USDCAD is expected to decline towards our predetermined entry point. We anticipate a bearish US Dollar for the remainder of the week, which will ultimately lead USDCAD to reach the entry zone. Three distinct target areas exist, collectively worth over 1100 pips. Each entry point, stop loss, and take profit is clearly defined.
We wish you the best of luck and safe trading.
Thank you for your support.
If you wish to assist us, we encourage you to consider the following actions:
- Like our ideas
- Provide comments on our ideas
- Share our ideas
Kind Regards,
Team Setupsfx_
Much Love ❤️🚀

Market Analysis: USD/CAD Breaks HigherMarket Analysis: USD/CAD Breaks Higher
USD/CAD is rising and might aim for more gains above the 1.3765 resistance.
Important Takeaways for USD/CAD Analysis Today
- USD/CAD is showing positive signs above the 1.3720 support zone.
- There is a key bullish trend line forming with support at 1.3740 on the hourly chart at FXOpen.
USD/CAD Technical Analysis
On the hourly chart of USD/CAD at FXOpen, the pair formed a strong support base above the 1.3540 level. The US Dollar started a fresh increase above the 1.3600 resistance against the Canadian Dollar.
The bulls pushed the pair above the 1.3640 and 1.3700 levels. The pair cleared the 50-hour simple moving average and climbed above 1.3750. A high was formed at 1.3766 and the pair is now consolidating.
Initial support is near the 1.3740 level. There is also a key bullish trend line forming with support at 1.3740. The next major support is near the 1.3710 level or the 23.6% Fib retracement level of the upward move from the 1.3539 swing low to the 1.3766 high.
The main support sits near the 1.3650 zone on the USD/CAD chart. It is near the 50% Fib retracement level.
A downside break below the 1.3650 level could push the pair further lower. The next major support is near the 1.3595 support zone, below which the pair might visit 1.3540.
If there is another increase, the pair might face resistance near the 1.3765 level. A clear upside break above 1.3765 could start another steady increase. The next major resistance is the 1.3800 level. A close above the 1.3800 level might send the pair toward the 1.3880 level. Any more gains could open the doors for a test of the 1.4000 level.
This article represents the opinion of the Companies operating under the FXOpen brand only. It is not to be construed as an offer, solicitation, or recommendation with respect to products and services provided by the Companies operating under the FXOpen brand, nor is it to be considered financial advice.

USDCAD Analysis – Breaking the Chains, Eyeing 1.38+USDCAD Price broke out from a long descending channel, followed by two bullish continuation flags – classic breakout-retest pattern.
Price is now pushing above 1.3720, aligning with the 38.2% Fib level of the prior drop.
Next upside targets:
🔹 1.3833 (Fib 61.8%)
🔹 1.3913 (Fib 78.6%)
Clear stop level: below 1.3625 (channel breakout support)
Structure Bias: Bullish continuation. Clean breakout + consolidation = probable impulse toward 1.3830/1.39.
📊 Current Bias: Bullish
🔍 Key Fundamentals Driving USDCAD
USD Drivers (Neutral to Bullish):
Fed held rates, dot plot shows only 1 cut in 2025, but Powell's tone leaned dovish.
US Retail Sales + PPI were weak, but safe-haven USD demand persists due to geopolitical risks and equity volatility.
Market reassessing Trump election risk, Fed independence, and inflation stickiness.
CAD Drivers (Bearish):
Oil prices are volatile due to Middle East tensions, but weak demand caps upside.
Canada’s CPI softened, BoC already delivered a dovish cut earlier this month.
CAD under pressure due to dovish BoC outlook and fiscal concerns (gov't budget deficits expanding).
CAD is also suffering from reduced foreign investment flows.
⚠️ Risks to Watch
Oil price spikes (especially if Strait of Hormuz risk escalates) may boost CAD short-term.
A sharp reversal in DXY or Fed commentary shift toward aggressive easing.
Weak US data next week (Core PCE especially) could unwind USD momentum.
🗓️ Upcoming Events to Watch
US Core PCE (June 28) – critical inflation gauge for the Fed
BoC Business Outlook Survey
Oil Inventories + Global energy sentiment
Geopolitical: Israel–Iran updates and Canada’s fiscal signals
🏁 Which Pair Leads the Move?
USDCAD is leading commodity crosses as CAD weakness broadens. Watch USDCAD and GBPCAD for signs of CAD softness before others like AUDCAD/NZDCAD follow.

USDCAD Bearish Bias: Beware Liquidity Traps & Reversal Risks.I'm currently keeping a close eye on USDCAD, which has been in a strong bearish trend. 📉
In this video, I explain how the market is unfolding across both the higher and lower timeframes, and why it’s critical to watch them in conjunction. On the lower timeframes, we often see a clean sequence of lower highs and lower lows, as the algos set up a seemingly a smooth trend. But traders should be cautious ⚠️
Why? Because on the higher timeframes, the market can easily pull back, triggering a liquidity hunt. This is often when the algorithm targets stop orders above recent highs, before resuming the trend 🧠💥
While my bias remains bearish, I'm also aware of the risk that the market could shift gears unexpectedly to run stops and shake out weak hands. This concept is fully broken down in the video — with examples of how to spot these traps and prepare accordingly 🎯

USDCAD Under Pressure: Chart Signals & Macro Forces Point South!The USDCAD pair is under clear pressure, as illustrated in this chart 📊. The visual structure highlights a persistent bearish trend, with price action consistently forming lower highs and lower lows. The chart is reinforcing the idea that sellers are dominating the market. Notably, the drawn arrow in the chart points toward previous higher timeframe lows, suggesting that these areas could be the next logical targets for price action if the current trend persists.
On the fundamental side, the US dollar has been weakened by dovish signals from the Federal Reserve and softer economic data, fueling expectations of potential rate cuts later this year 🏦. In contrast, the Canadian dollar has been buoyed by strong commodity prices—especially oil—and a relatively hawkish Bank of Canada. The bearish structure seen in the chart aligns with these macro drivers, as the CAD continues to benefit from both domestic strength and global demand for commodities.
Geopolitically, ongoing global trade tensions and shifting risk sentiment have further supported the Canadian dollar, as investors seek stability in commodity-backed currencies 🌍. The combination of these factors, as reflected in the chart, suggests that USDCAD remains vulnerable, and a move down to retest previous higher timeframe lows is a real possibility unless there’s a significant shift in the underlying fundamentals.
Traders should keep an eye on the key support zones highlighted in the chart, as these could provide clues for potential exhaustion or reversal in the current trend 🔎.
Disclaimer: This analysis is for informational purposes only and does not constitute financial advice. Please conduct your own research or consult a professional before making any trading decisions.

USD/CAD Holds Near 2025 LowUSD/CAD Holds Near 2025 Low
When we last analysed the USD/CAD chart on 4 June, we identified a descending channel that remains relevant.
On 5 June, the pair reached a new low for 2025, and it is possible that bears will attempt to extend this move further over the course of the month.
Why is USD/CAD declining?
The Canadian dollar appears to be strengthening amid speculation that a trade agreement between the US and Canada could be finalised soon — possibly on 15 June, when the G7 summit is due to be held in Canada.
Media reports highlight several indicators supporting this view:
→ Prime Minister Mark Carney stated that Canada will meet its NATO spending target of 2% of GDP.
→ Canada refrained from retaliatory tariffs on steel and aluminium.
→ The US ambassador to Canada confirmed that “secret” negotiations are ongoing.
Technical Analysis of the USD/CAD Chart
Note that the R-line, which divides the lower half of the descending channel into two equal parts, acted as resistance — price reversed downward from this line and accelerated lower (as indicated by the arrow). This reinforces the view that bears currently dominate the USD/CAD market.
For now, the 1.3650 level appears to be a support zone for bulls, but its strength may be tested today as markets react to US inflation data. The Consumer Price Index (CPI) report is scheduled for release today at 15:30 GMT+3. Be prepared for potential spikes in volatility.
This article represents the opinion of the Companies operating under the FXOpen brand only. It is not to be construed as an offer, solicitation, or recommendation with respect to products and services provided by the Companies operating under the FXOpen brand, nor is it to be considered financial advice.
#USDCAD: 500+ Pips Big Buy Opportunity!Dear Traders
Hope you are doing great, we have a great buying opportunity on USDCAD, our first entry is in profit of 250+ pips, however, we expect price to grow steadily after reconfirming the same area. USDCAD tends to reconfirm the order block area many times before a big bull move. Good luck.

USDCAD Price Rebounding from Key Support as CAD WeakensUSDCAD is showing signs of a potential reversal from key support around the 1.3700–1.3685 zone. The pair had been declining steadily but recent weakness in the Canadian Dollar — driven by soft economic data and oil market uncertainty — is starting to shift momentum back in favor of the U.S. Dollar. As long as support holds, there is room for a bullish continuation toward 1.3860 or higher in the near term.
Technical Analysis (4H Chart)
Trend Structure: After a strong impulsive drop earlier in May, USDCAD formed a rounded bottom near 1.3685, followed by a corrective bounce. The recent retracement toward the support area is forming a potential higher low setup.
Support Zone:
Primary Support: 1.3700–1.3685
This is a clean structure zone and previous demand level. Price tested this area on May 24–25 and rebounded sharply.
Resistance Zone:
Short-Term Target: 1.3849–1.3860
This is the next major horizontal resistance, and aligns with previous price congestion before the latest decline.
Price Projection:
The chart suggests a bullish wave may develop from the support zone, targeting the 1.3860 level. If broken, a further move toward 1.3920 (May swing high) is possible.
Invalidation Level:
A daily close below 1.3680 would negate the bullish bias and signal a deeper correction or trend continuation lower.
Fundamental Analysis
U.S. Dollar (USD) Drivers:
Q1 GDP second estimate shows steady but modest growth.
Consumer Confidence fell recently, capping upside for the USD short term.
The Fed remains cautious, signaling that inflation risks persist — keeping interest rates elevated, which supports USD.
U.S. Treasury yields have been stable to slightly higher, also helping support the dollar.
Canadian Dollar (CAD) Drivers:
Canada's balance of payments posted a larger-than-expected deficit in Q1 — a negative for CAD.
Oil prices, which heavily influence CAD, have been under pressure from global demand uncertainty.
Domestic demand is softening: flat retail sales and weak trade balance data reduce CAD appeal.
Bank of Canada is showing signs of policy caution, especially as inflation slows faster than in the U.S.
Conclusion
Outlook: Short-term bullish
USDCAD is likely to bounce from the 1.3700–1.3685 zone and retest 1.3849–1.3860 if CAD weakness continues.
Trade Plan (if trading):
Buy Zone: 1.3700–1.3685
Target: 1.3860
Stop Loss: Below 1.3680 (structure break)
The pair is fundamentally supported by CAD weakness and technically primed for a rebound — but confirmation from price action near support is critical.

Cautious Bulls Meet Trendline Test: USD/CAD Eyes FOMC CatalystCMCMARKETS:USDCAD OANDA:USDCAD USD/CAD extended its recovery for the third day, trading near 1.3833 on modest USD strength following upbeat U.S. data. However, fiscal worries and expectations of Fed rate cuts in 2025 may limit upside momentum. Traders are cautious ahead of the FOMC Minutes and U.S. PCE/GDP data, while firmer Canadian inflation and oil prices could support the CAD.
Technically, the pair remains within a broad downward channel and is now approaching key resistance at 1.3856, aligned with the descending trendline. A clear rejection here could spark a bearish continuation toward 1.3711 support. A breakout above 1.3937 would invalidate the bearish channel and suggest trend reversal.
Resistance : 1.3856 , 1.3937
Support : 1.3711 , 1.3809

Market Analysis: USD/CAD Declines SteadilyMarket Analysis: USD/CAD Declines Steadily
USD/CAD declined and now is consolidating below the 1.3800 level.
Important Takeaways for USD/CAD Analysis Today
- USD/CAD started a fresh decline after it failed to clear the 1.4000 resistance.
- There is a connecting bearish trend line with resistance at 1.3740 on the hourly chart at FXOpen.
USD/CAD Technical Analysis
On the hourly chart of USD/CAD at FXOpen, the pair climbed toward the 1.3900 resistance zone before the bears appeared. The US Dollar formed a swing high near 1.3890 and recently declined below the 1.3800 support against the Canadian Dollar.
There was also a close below the 50-hour simple moving average and 1.3750. The bulls are now active near the 1.3700 level, but they might fail to protect more losses. If there is an upside correction, the pair could face resistance near the 1.3740 level.
There is also a connecting bearish trend line with resistance at 1.3740. The trend line is near the 23.6% Fib retracement level of the downward move from the 1.3888 swing high to the 1.3694 low.
If there is a fresh increase, the pair could face resistance near the 1.3790 level. It is close to the 50% Fib retracement level of the downward move from the 1.3888 swing high to the 1.3694 low. The next key resistance on the USD/CAD chart is near the 1.3815 level.
If there is an upside break above 1.3815, the pair could rise toward the 1.3890 resistance. The next major resistance is near the 1.3935 level, above which it could rise steadily toward the 1.4000 resistance zone.
Immediate support is near the 1.3695 level. The first major support is near 1.3660. A close below the 1.3660 level might trigger a strong decline. In the stated case, USD/CAD might test 1.3600. Any more losses may possibly open the doors for a drop toward the 1.3550 support.
This article represents the opinion of the Companies operating under the FXOpen brand only. It is not to be construed as an offer, solicitation, or recommendation with respect to products and services provided by the Companies operating under the FXOpen brand, nor is it to be considered financial advice.

IN DEPTH HIGHER TIME FRAME ALIGNMENT!USDCAD SHORT FORECAST Q2 W2🔥👀USDCAD SHORT FORECAST Q2 W22 D26 Y25
IN DEPTH HIGHER TIME FRAME ALIGNMENT! 🔥👀
Professional Risk Managers👋
Welcome back to another FRGNT chart update📈
Diving into some Forex setups using predominantly higher time frame order blocks alongside confirmation breaks of structure.
💡Here are some trade confluences📝
✅Weekly 50 EMA
✅Daily 50 EMA
✅4 Hour 50 EMA
✅15’ order block identified
🔑 Remember, to participate in trading comes always with a degree of risk, therefore as professional risk managers it remains vital that we stick to our risk management plan as well as our trading strategies.
📈The rest, we leave to the balance of probabilities.
💡Fail to plan. Plan to fail.
🏆It has always been that simple.
❤️Good luck with your trading journey, I shall see you at the very top.
🎯Trade consistent, FRGNT X

HTF ALIGNMENT USDCAD SHORT FORECAST Q2 W22 Y25USDCAD SHORT FORECAST Q2 W22 Y25
HIGHER TIME FRAME ALIGNMENT!
Professional Risk Managers👋
Welcome back to another FRGNT chart update📈
Diving into some Forex setups using predominantly higher time frame order blocks alongside confirmation breaks of structure.
💡In depth trade confluences provided during the week 📝
🔑 Remember, to participate in trading comes always with a degree of risk, therefore as professional risk managers it remains vital that we stick to our risk management plan as well as our trading strategies.
📈The rest, we leave to the balance of probabilities.
💡Fail to plan. Plan to fail.
🏆It has always been that simple.
❤️Good luck with your trading journey, I shall see you at the very top.
🎯Trade consistent, FRGNT X

USD/CAD Rate Drops Towards Yearly LowsUSD/CAD Rate Drops Towards Yearly Lows
The USD/CAD chart is currently showing clear signs of a bearish trend, characterised by a sequence of lower highs and lower lows (A→B→C→D→E→F→G).
This week’s decline suggests the downward structure may continue to develop, putting the current yearly low around the 1.3770 level at risk.
Why Is USD/CAD Falling?
On one hand, the US dollar remains under pressure:
→ Following last week’s downgrade of US debt ratings by Moody’s, investor attention has shifted to the country’s $36 trillion debt burden.
→ A tax bill backed by Donald Trump — recently passed in the Republican-controlled House of Representatives — could add trillions more to the national debt. Market participants may be increasingly concerned about the US’s fiscal outlook, prompting a shift towards safe-haven assets.
On the other hand, the Canadian dollar has strengthened this week relative to other major currencies. Tuesday’s CPI figures from Canada came in above analysts’ expectations and may be seen as a sign that the inflation surge could delay any potential rate cuts by the Bank of Canada.
USD/CAD Technical Analysis
In early May, we outlined a descending channel on the USD/CAD chart — a structure that remains relevant today.
The current price is hovering near the channel’s median line, which could indicate a temporary balance between supply and demand. However, with Canadian retail sales data due at 15:30 GMT+3 today, the risk of increased volatility remains high. A new weekly low cannot be ruled out.
This article represents the opinion of the Companies operating under the FXOpen brand only. It is not to be construed as an offer, solicitation, or recommendation with respect to products and services provided by the Companies operating under the FXOpen brand, nor is it to be considered financial advice.

USDCAD Analysis⚠️ Market shift alert!
Due to the new trade agreements with China, the USD may strengthen 💪
Our previous short idea from this level was invalidated as price broke without a signal ❌
Now we’re waiting for a pullback to go long from the new support zone 📈
For detailed entry points, trade management, and high-probability setups, follow the channel:
ForexCSP

AUDCAD SHORT FORECAST Q2 W20 D12 Y25AUDCAD SHORT FORECAST Q2 W20 D12 Y25
Professional Risk Managers👋
Welcome back to another FRGNT chart update📈
Diving into some Forex setups using predominantly higher time frame order blocks alongside confirmation breaks of structure.
Let’s see what price action is telling us today!
💡Here are some trade confluences📝
✅ Weekly order block
✅Intraday 15 order block
✅Tokyo ranges to be filled
✅Intraday bearish breaks of structure to be confirmed
🔑 Remember, to participate in trading comes always with a degree of risk, therefore as professional risk managers it remains vital that we stick to our risk management plan as well as our trading strategies.
📈The rest, we leave to the balance of probabilities.
💡Fail to plan. Plan to fail.
🏆It has always been that simple.
❤️Good luck with your trading journey, I shall see you at the very top.
🎯Trade consistent, FRGNT X

Bearish Pressure Builds on USDCAD - 1D to 15m Sell Setup!Currently eyeing USDCAD 👀 — the pair has been under consistent downward pressure 📉. Volatility remains elevated ⚡, so be prepared for potential sharp moves.
The daily timeframe shows a clear bearish structure, aligning with my short bias 🐻. I’ve drilled down to the 4H, 1H, and 15min charts to refine my entry 🎯.
The 15-minute chart began showing signs of bearish momentum, and I’ve taken a short position based on that lower-timeframe confirmation ⏱️🔥.
As always, not financial advice – just sharing my view and execution logic 💼⚠️.
