USDCAD SHORT FORECAST Q2 W18 D1 Y25USDCAD SHORT FORECAST Q2 W18 D1 Y25
Professional Risk Managers👋
Welcome back to another FRGNT chart update📈
Diving into some Forex setups using predominantly higher time frame order blocks alongside confirmation breaks of structure.
Let’s see what price action is telling us today!
💡Here are some trade confluences📝
✅Intraday breaks of structure
✅Tokyo ranges to be filled
✅15' order block identified
🔑 Remember, to participate in trading comes always with a degree of risk, therefore as professional risk managers it remains vital that we stick to our risk management plan as well as our trading strategies.
📈The rest, we leave to the balance of probabilities.
💡Fail to plan. Plan to fail.
🏆It has always been that simple.
❤️Good luck with your trading journey, I shall see you at the very top.
🎯Trade consistent, FRGNT X
Usdcaddaily

usdcad buy signal. Don't forget about stop-loss.
Write in the comments all your questions and instruments analysis of which you want to see.
Friends, push the like button, write a comment, and share with your mates - that would be the best THANK YOU.
P.S. I personally will open entry if the price will show it according to my strategy.
Always make your analysis before a trade

#USDCAD: We took the Swing Sell, Now let's focus on Swing Buy! The USD/CAD exchange rate experienced a significant decline, reaching its all-time high against the USD. This decline is primarily attributed to the ongoing trade dispute between China and the United States, which has led to a depreciation of the USD and resulted in a yearly low.
However, we anticipate a potential reversal in the price trajectory. We identify a favourable area where the price may stabilise and address the liquidity gap it has created.
We have established three targets, and to effectively utilise these targets, we recommend executing small entries with each target set based on a predetermined take-profit level.
We extend our sincere gratitude for your unwavering support throughout this journey within this community. Additionally, we appreciate the contributions of each individual who has supported our endeavours. We are pleased to announce that we have garnered 20,000 followers.
Much Love,
Team Setupsfx_
❤️🚀

#USDCAD:Swing Sell Possibly Worth 980+ Pips? Dear Traders,
We are approaching a strong bearish hold where we estimate price to reverse from depending on how market treat DXY in coming weeks. Please use accurate risk management.

#USDCAD: Two Big Target Accumulating of 800+ Pips! **USDCAD **
Following the US President’s decision to impose a 25% tariff rate on Canada, the USD/CAD exchange rate experienced a significant surge, reaching approximately 1.49. However, as the market has stabilised, we anticipate a gradual decline in the exchange rate, which may help bridge the liquidity gap.
Two prominent red lines serve as potential entry and stop-loss points. Additionally, two designated targets are set as swing take-profit areas.
We appreciate your unwavering support. Should you have any inquiries regarding the strategy or any trading-related questions, please do not hesitate to provide feedback.
Team Setupsfx_

USDCAD SELL/SHORTBy utilizing Fibonacci retracement levels, historical patterns, , we can formulate a hypothesis that the market might follow a similar trajectory if bearish sentiment prevails.

USD/CAD Rejection Trade Setup – Short from Supply Zone with RisiTimeframe: 30 Minutes (M30)
Indicators:
EMA 30 (Red): 1.41932
EMA 200 (Blue): 1.42196
🧠 Trade Setup: Potential Short Opportunity
📍 Current Price: 1.42252
📌 Key Levels:
Entry Point (Supply Zone): 1.42582
Strong resistance zone, overlapping with EMA 200 and a previous consolidation zone.
Price has entered a rising wedge pattern—a potential bearish reversal signal.
Stop Loss: 1.42987
Placed just above the supply zone to avoid premature exit due to a false breakout.
Take Profit (EA Target Point): 1.40379
Aligns with previous demand zone, solid support level.
⚖️ Risk-to-Reward Breakdown:
Risk: ~335 pips
Reward: ~2047 pips
R:R Ratio: ~1:6 — Excellent risk-to-reward ratio for a swing short.

USDCAD: 1200+ Pips Swing Move, Comment Your View.Dear Traders,
Hope you are doing great we have an excellent selling opportunity coming up. We expect price to reverse from the designed area where we think price will react since dxy is likely to drop heavy.
Like and comment to show support

USD/CAD "The Loonie" Forex Market Money Heist Plan🌟Hi! Hola! Ola! Bonjour! Hallo! Marhaba!🌟
Dear Money Makers & Robbers, 🤑💰🐱👤🐱🏍
Based on 🔥Thief Trading style technical and fundamental analysis🔥, here is our master plan to heist the USD/CAD "The Loonie" Forex market. Please adhere to the strategy I've outlined in the chart, which emphasizes short entry. Our aim is the high-risk Green Zone. Risky level, oversold market, consolidation, trend reversal, trap at the level where traders and bullish robbers are stronger. 🏆💸Book Profits Be wealthy and safe trade.💪🏆🎉
Entry 📈 : "The vault is wide open! Swipe the Bearish loot at any price - the heist is on!
however I advise to Place buy limit orders within a 15 or 30 minute timeframe most recent or swing, low or high level. I Highly recommended you to put alert in your chart.
Stop Loss 🛑:
Thief SL placed at the recent / swing low level Using the 4H timeframe (1.44500) swing trade basis.
SL is based on your risk of the trade, lot size and how many multiple orders you have to take.
Target 🎯: 1.39500 (or) Escape Before the Target
🧲Scalpers, take note 👀 : only scalp on the Long side. If you have a lot of money, you can go straight away; if not, you can join swing traders and carry out the robbery plan. Use trailing SL to safeguard your money 💰.
📰🗞️Read the Fundamental, Macro, COT Report, Quantitative Analysis, Intermarket Analysis, Sentimental Outlook before start the plan.
USD/CAD "The Loonie" Forex Market is currently experiencing a bearish trend,., driven by several key factors.
1. Fundamental Analysis
Fundamental analysis evaluates the economic indicators of the United States and Canada that directly impact the USD/CAD exchange rate.
United States Economic Indicators:
GDP Growth: Forecasted at 2.0% to 2.5% for 2025, suggesting steady but slowing economic expansion.
Inflation: Stable at approximately 2.5% to 3.0%, with recent data showing no significant surprises.
Interest Rates: Currently at 4.50%, with the Federal Reserve potentially considering cuts later in 2025 if economic growth weakens.
Trade Balance: The US maintains a persistent trade deficit, though it remains manageable given the broader economic context.
Canada Economic Indicators:
GDP Growth: Projected at 1.0% to 1.5% for 2025, indicating moderate growth heavily tied to commodity exports.
Inflation: Around 2.0%, stable but sensitive to fluctuations in energy prices.
Interest Rates: Set at 3.0%, with the Bank of Canada (BoC) likely to hold steady or adjust slightly based on incoming economic data.
Trade Balance: Mixed, with oil exports being a critical driver of the Canadian Dollar (CAD).
Key Insight: The interest rate differential (4.50% in the US vs. 3.0% in Canada) currently supports the USD. However, declining oil prices—a key factor for Canada—and potential Fed rate cuts introduce uncertainty into the fundamental picture.
2. Macroeconomic Factors
Macroeconomic conditions provide a broader context for currency movements, encompassing global and country-specific trends.
Global GDP Growth: Expected to range between 3.0% and 3.3% in 2025, reflecting moderate global economic expansion.
US Economy: Exhibits signs of slowing growth, with the Federal Reserve adopting a cautious stance, potentially leading to rate cuts if economic conditions deteriorate.
Canadian Economy: Strongly influenced by commodity prices, especially oil, which has faced volatility due to global supply and demand dynamics.
Central Bank Policies: The Fed is in a wait-and-see mode, while the BoC remains data-dependent, with possible rate adjustments if inflation or growth shifts significantly.
Geopolitical Events: Trade tensions, including US-imposed tariffs, could pressure Canada’s economy, potentially weakening the CAD.
Key Insight: Macroeconomic factors present a mixed outlook. Moderate global growth supports risk assets, but trade tensions and central bank caution create uncertainty for USD/CAD.
3. Global Market Analysis
Global market conditions influence currency pairs through risk sentiment and economic interdependencies.
Equity Markets: US and global equity indices are range-bound, reflecting uncertainty and mixed economic signals.
Commodity Prices: Oil prices are under pressure, a bearish factor for the CAD given Canada’s role as a major oil exporter.
Currency Markets: The USD shows strength against some currencies but weakness against others, lacking a dominant trend.
Key Insight: Weak oil prices act as a headwind for the CAD, potentially pushing USD/CAD higher, though broader market uncertainty moderates this effect.
4. Commitment of Traders (COT) Data
COT data offers insights into the positioning of large traders, shedding light on market sentiment.
Large Speculators: Recent trends indicate a net short position on USD/CAD, suggesting bearish sentiment among big players.
Commercial Traders: Positioning is mixed, with some hedging activity reflecting uncertainty in the market.
Market Implications: The net short stance among speculators points to a bearish outlook, but it also raises the possibility of a crowded trade, increasing the risk of a short squeeze if the pair rallies.
Key Insight: Bearish sentiment prevails among large traders, aligning with technical signals, though the concentration of shorts could lead to volatility.
5. Intermarket Analysis
Intermarket analysis examines correlations between USD/CAD and other asset classes.
Oil Prices: A strong inverse correlation exists between USD/CAD and oil prices. Falling oil prices typically strengthen USD/CAD by weakening the CAD.
Commodity Currencies: USD/CAD often aligns with movements in other commodity-linked currencies like AUD/USD and NZD/USD.
Equity Markets: A risk-on environment (rising equities) can pressure the USD downward, while risk-off sentiment bolsters it.
Key Insight: Declining oil prices provide a bullish tilt for USD/CAD, but this is tempered by mixed risk sentiment across global markets.
6. Quantitative Analysis
Quantitative analysis employs technical indicators to assess price trends and momentum.
Moving Averages: The pair is trading below its 50-day and 200-day moving averages, signaling a bearish trend.
RSI (Relative Strength Index): At 45, the RSI is neutral but approaching oversold territory, hinting at potential downside exhaustion.
MACD (Moving Average Convergence Divergence): Positioned in negative territory, indicating bearish momentum.
Chart Patterns: A bear flag pattern has been noted, with a potential downside target near 1.3164, suggesting further declines.
Key Insight: Technical indicators predominantly point to a bearish trend, with the possibility of additional downside if key support levels are breached.
7. Market Sentiment Analysis
Market sentiment reflects the collective psychology of traders and investors.
Trader Sentiment: Surveys and positioning data indicate a bearish bias, with traders anticipating further declines in USD/CAD.
Expert Opinions: Analysts largely recommend selling the pair, citing both technical and fundamental weaknesses.
Social Media Trends: Discussions on platforms like X reveal mixed views, with some predicting a drop to 1.4000 and others warning of potential reversals.
Key Insight: Sentiment leans bearish, consistent with technical indicators and COT data, reinforcing expectations of a downward move.
8. Positioning
Positioning reveals how traders are aligned in the market, influencing potential price dynamics.
Speculative Positions: Likely net short, based on COT data and sentiment surveys, indicating widespread bearish bets.
Institutional Positioning: Mixed, with some institutions hedging against possible USD weakness.
Market Impact: The heavy short positioning could trigger volatility if the pair moves against the consensus, such as in a short squeeze scenario.
Key Insight: Bearish positioning dominates, heightening the risk of a sharp reversal if positive USD catalysts emerge.
9. Next Trend Move
The next likely price movement is derived from current data and market conditions.
Direction: Downward pressure is favored, driven by technical sell signals and bearish sentiment.
Key Levels:
Support: 1.4150; a break below could target 1.4000 or lower.
Resistance: 1.4500; a move above could signal a trend reversal.
Triggers: Upcoming economic data releases, central bank statements, or shifts in oil prices could catalyze the next move.
Key Insight: The next trend move is likely to test lower support levels, potentially reaching 1.39500 if bearish momentum continues.
10. Overall Summary Outlook
Overview: On March 6, 2025, with USD/CAD at 1.43000, the pair exhibits a bearish outlook. Technical indicators, bearish trader positioning, and market sentiment suggest downside risks. However, fundamental factors—such as declining oil prices and potential trade tensions—could provide some support for the pair. The market is at a pivotal point, with price action near key support levels likely to dictate the next direction.
Future Prediction
Trend: Bearish (Short-Term), with Potential for Reversal
Details:
Short-Term: The pair is poised to test support at 1.41500, with a possible decline to 1.39000 if this level breaks. This outlook is driven by technical weakness and bearish sentiment.
Risks: A reversal could occur if oil prices rebound or if US economic data exceeds expectations, potentially pushing the pair toward 1.39000.
Conclusion: The short-term forecast favors a bearish trend, supported by prevailing technical and sentiment signals. However, fundamental factors like oil prices and trade policies could cap downside or trigger a reversal, warranting close monitoring of upcoming data and events.
📌Keep in mind that these factors can change rapidly, and it's essential to stay up-to-date with market developments and adjust your analysis accordingly.
⚠️Trading Alert : News Releases and Position Management 📰 🗞️ 🚫🚏
As a reminder, news releases can have a significant impact on market prices and volatility. To minimize potential losses and protect your running positions,
we recommend the following:
Avoid taking new trades during news releases
Use trailing stop-loss orders to protect your running positions and lock in profits
💖Supporting our robbery plan 💥Hit the Boost Button💥 will enable us to effortlessly make and steal money 💰💵. Boost the strength of our robbery team. Every day in this market make money with ease by using the Thief Trading Style.🏆💪🤝❤️🎉🚀
I'll see you soon with another heist plan, so stay tuned 🤑🐱👤🤗🤩

USDCAD Long BaisUS Dollar against Canadian Dollar
The USD/CAD pair is currently on a structural support line that has historically demonstrated its ability to hold the pair. Based on this observation, it is reasonable to anticipate that the pair may respect this support level and potentially reverse to the upside, presenting a possible opportunity to enter a long position.
I would be interested in hearing your perspective on the future price action of this pair. As always, it is important to consider conducting further analysis and implementing appropriate risk management strategies before making any trading decisions.

USDCAD IdeaThis pair is retesting the ascending trendline so we enter a sell (short ) position
follow us or more ides and updates

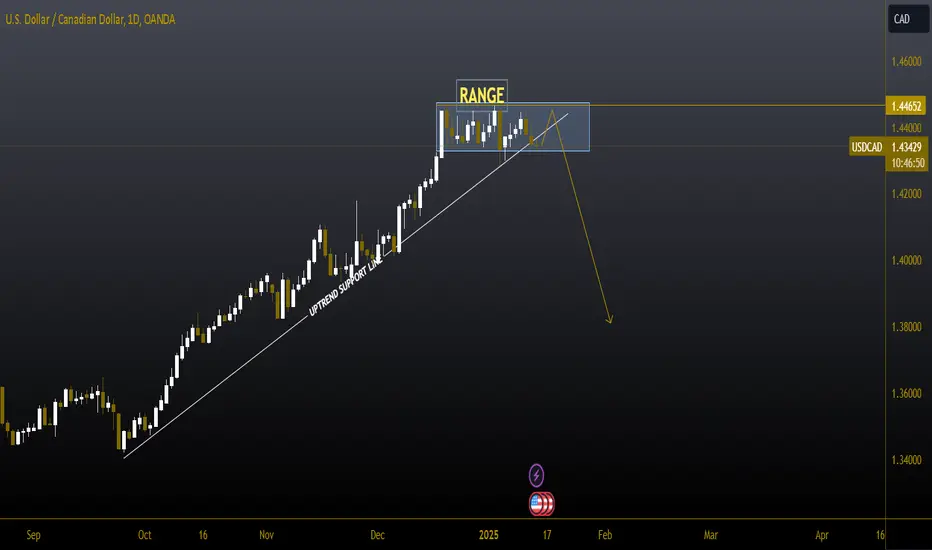
#USDCAD 1DAYUSDCAD (1D Timeframe) Analysis
Market Structure:
The price was supported by a trendline, but after forming a consolidation range near this Resistance, it has broken down, indicating potential bearish momentum. The breakdown suggests that the buyers were unable to hold the trendline, and selling pressure has increased.
Forecast:
A sell opportunity is anticipated as the breakdown below the trendline and range indicates a shift in market sentiment toward the downside.
Key Levels to Watch:
- Entry Zone: Consider entering a sell position after a retest of the broken trendline or consolidation range as resistance.
- Risk Management:
- Stop Loss: Placed above the retest level or recent swing high to manage risk.
- Take Profit: Target the next support levels or Fibonacci retracement areas for potential downside targets.
Market Sentiment:
The breakdown of the trendline support signals bearish sentiment, with further downside likely if the price remains below the retest level. Proper confirmation is recommended before entering the trade.
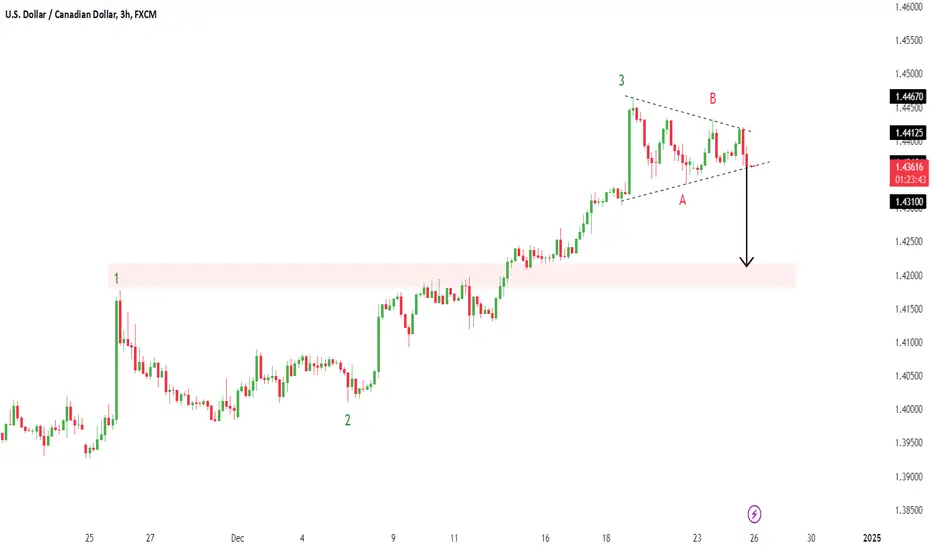
USDCADUSDCAD ( U.S Dollar / Canadian Dollar )
Symmetrical Triangle as an corrective pattern in Short Time Frame
Break of Structure
RSI - Divergence
Completed " 123 " Impulsive Waves
Change of Characteristics
USDCAD with two probabilities for 10/28/2024USDCAD with a high probability to make the decision for 10/28/2024 ✅️ :
🔸️If the price exceeds the green bar 🟩, with the bar closing in the hour above: there will be a high chance of entering a purchase as indicated in the chart, respecting the day, news and the stop loss.
🔸️If the price exceeds the red bar 🟥, with the bar closing in the hour below: there will be a high chance of entering a sale as indicated in the chart, respecting the day, news, and the stop loss.

USDCAD Top-down analysis Hello traders, this is a complete multiple timeframe analysis of this pair. We see could find significant trading opportunities as per analysis upon price action confirmation we may take this trade. Smash the like button if you find value in this analysis and drop a comment if you have any questions or let me know which pair to cover in my next analysis.

USDCAD with two probabilities for 10/25/2024USDCAD with a high probability to make the decision for 10/25/2024 ✅️ :
🔸️If the price exceeds the green bar 🟩, with the bar closing in the hour above: there will be a high chance of entering a purchase as indicated in the chart, respecting the day, news and the stop loss.
🔸️If the price exceeds the red bar 🟥, with the bar closing in the hour below: there will be a high chance of entering a sale as indicated in the chart, respecting the day, news, and the stop loss.

USDCAD with two probabilities for 10/22/2024USDCAD with a high probability to make the decision for 10/22/2024 ✅️ :
🔸️If the price exceeds the green bar 🟩, with the bar closing in the hour above: there will be a high chance of entering a purchase as indicated in the chart, respecting the day, news and the stop loss.
🔸️If the price exceeds the red bar 🟥, with the bar closing in the hour below: there will be a high chance of entering a sale as indicated in the chart, respecting the day, news, and the stop loss.

USD/CAD "The Loonie" Bank Money Heist Plan on Bullish SideHola! My Dear Robbers / Money Makers & Losers, 🤑 💰
This is our master plan to Heist USD/CAD "The Loonie" Bank based on Thief Trading style Technical Analysis.. kindly please follow the plan I have mentioned in the chart focus on Long entry. Our target is Red Zone that is High risk Dangerous level, market is overbought / Consolidation / Trend Reversal / Trap at the level Bearish Robbers / Traders gain the strength. Be safe and be careful and Be rich.
Entry : Can be taken Anywhere, What I suggest you to Place Buy Limit Orders in 15mins Timeframe Recent / Nearest Swing Low
Stop Loss 🛑 : Recent Swing Low using 2H timeframe
Attention for Scalpers : If you've got a lot of money you can get out right away otherwise you can join with a swing trade robbers and continue the heist plan, Use Trailing SL to protect our money 💰.
Warning : Fundamental Analysis news 📰 🗞️ comes against our robbery plan. our plan will be ruined smash the Stop Loss. Don't Enter the market at the news update.
Loot and escape on the target 🎯 Swing Traders Plz Book the partial sum of money and wait for next breakout of dynamic level / Order block, Once it is cleared we can continue our heist plan to next new target.
Support our Robbery plan we can easily make money & take money 💰💵 Follow, Like & Share with your friends and Lovers. Make our Robbery Team Very Strong Join Ur hands with US. Loot Everything in this market everyday make money easily with Thief Trading Style.
Stay tuned with me and see you again with another Heist Plan..... 🫂

USDCAD on the edgeWith the triple CPI news at 2:30PM, we're really confident to say that USD is taking a huge bump, leading USDCAD to a new lower low.

USDCAD GOING THROUGH THE ROOF (2)Now 's the time !
News CPI for USD today, more impact on currencies than US100
It has followed our large uptrend since 1rst of cotober now ;
it is now looking to push through the purple key level, which is pretty weak and ready to be broken ;
did not break too low tonight, even more ready to blow up

USDCAD SELL | Idea Trading AnalysisUSCAD is moving in a descending channel, We expect the decline to continue after the dynamic resistance is retested.
USDCAD is near the resistance, where price dropped before.
We expect a bearish move from the confluence zone.
Hello Traders, here is the full analysis.
I think we can soon see more fall from this range! GOOD LUCK! Great SELL opportunity USDCAD
I still did my best and this is the most likely count for me at the moment.
-------------------
Traders, if you liked this idea or if you have your own opinion about it, write in the comments. I will be glad 🤝

USDCADPair : USDCAD ( U.S Dollar / Canadian Dollar )
Description :
Completed " 12345 " Impulsive Waves
Break of Structure
RSI - Divergence
CHoCH
Bullish Channel as an Corrective Pattern in Short Time Frame

USDCADPair : USDCAD ( U.S Dollar / Canadian Dollar )
Description :
Completed " 12345 " Impulsive Waves
Break of Structure
RSI - Divergence
Consolidation Phase in Short Time Frame
Symmetrical Triangle
