1:10 RISK TO REWARD SELL SETUP FOR USDCADCore Analysis Method: Smart Money Concepts
Here’s a detailed breakdown of the analysis based on the Smart Money Concepts methodology:
😇 7 Dimension Analysis
Time Frame: 15M
Swing Structure:
The structure is currently bearish, with multiple Breaks of Structure (BOS) confirming the downtrend. The price has mitigated Inducement and is now undergoing a corrective swing move.
Only the extreme Sell Order Block (SOB) is identified as the Point of Interest (POI) in the Premier zone, making this area highly attractive for sellers.
This area has also served as a Resistance or Demand zone for sellers in the past, adding to its significance.
Pattern:
🟢 Chart Patterns:
To be assessed once the price reaches the POI.
🟢 Candle Patterns:
Will be updated upon the price reaching the POI.
Volume:
🟢 Significant volume is observed in the selling areas, indicating strong selling interest.
Momentum RSI:
🟢 The RSI is in the super-sell zone, indicating strong bearish momentum. Although there is an attempt at a range shift, it’s not confirmed yet, and the bearish sentiment still dominates.
Volatility Bollinger Bands:
🟢 The volatile move is about to conclude, and the market may require some time to cool down before the next significant movement.
Strength ADX:
The ADX indicates that sellers are firmly in control, supporting the bearish outlook.
Rating: ⭐⭐⭐⭐ (4 Stars)
Probability: 60%
The setup shows a moderate-to-high probability, but confirmation from patterns and additional indicators could increase this further.
✔️ Entry Time Frame: 15M
✅ Entry TF Structure: Bearish
☑️ POI: Extreme unmitigated OB
💡 Decision: Sell Limit
🚀 Entry: 1.3678
✋ Stop loss: 1.3686
🎯 Take profit: 1.3602
😊 Risk to reward Ratio: 10 RR
🕛 Expected Duration: 2 Days
SUMMARY:
The analysis suggests a strong selling opportunity on the 15-minute timeframe, with a sell limit entry at 1.3678. The stop loss is tightly set at 1.3686, providing a high risk-to-reward ratio of 10:1, with a take-profit target at 1.3602. This setup is favored by the current bearish market structure and the significant volume observed in selling zones. While the momentum is still bearish, the upcoming price action near the POI will be crucial in confirming this trade's potential. Monitoring the formation of chart and candle patterns at the POI will be essential for executing this setup effectively.
Usdcaddaily

USDCADPair : USDCAD ( U.S Dollar / Canadian Dollar )
Description :
Completed " 12345 " Impulsive Waves
Break of Structure
RSI - Divergence
Rising Wedge as an Corrective Waves in Long Time Frame
Demand Zone

USDCAD: 800+ Pips Move, Do not Miss Out! Dear Traders,
As we stated in our last analysis that price will bounce from our designated buying zone, for us that area remain a key level as price is likely to retrace from the area. Following our last idea, price did rise up higher than that we expected, however, it has almost reached our area of buying.
Good Luck and trade safe.

USDCADPair : USDCAD ( U.S Dollar / Canadian Dollar )
Description :
Completed " 12345 " Impulsive Waves
Break of Structure
RSI - Divergence
Falling Wedge as an Corrective Pattern in Short Time Frame
Support Level

11 RR Sell Setup for USDCADCore Analysis Method: Smart Money Concepts
Based on the Smart Money Concepts methodology, we have identified a strong demand zone on the daily timeframe, which has once again given a strong rejection, changing the price character from bullish to bearish on the H1 timeframe.
😇 7 Dimension Analysis
Time Frame: H1
Swing Structure:
Bearish CHoCH from higher timeframe zone rejection.
Took inducement and now ready for a corrective swing move with its 1st pullback.
Internal structure turned bullish for a correction towards extreme and decisional POI (Order Flow or Order Block).
Preferred POI: Order Flow in the Premier zone of the swing.
Entry Model: Regular SMC.
Daily Resistance: Supply zone where sellers still have full control, with the 3rd breakout attempt failure.
Pattern:
🟢 Chart Patterns:
Reversal: Head and Shoulders pattern is clearly visible and completed.
🟢 Candle Patterns:
Observed multiple reversal candlestick patterns on the daily timeframe, including Doji, Long Wick, Engulfing, and Dark Clouds. These patterns indicate strong bearish momentum at the level.
Volume:
🟢 Very massive volume observed on the daily timeframe right before and after rejection, with the price reacting bearish. This is a strong indication for a sell position.
Momentum RSI:
🟢 Price is in the bullish zone yet, but strange things are noted in terms of momentum on the daily timeframe.
🟢 Strongest 3-candle divergence and loud moves.
According to Andrew Cardwell's method (used for momentum analysis with RSI), loud moves are almost 90% confirmed moves.
Volatility Bollinger Bands:
🟢 After one of the longest contraction phases, the breakout to the upper side was unable to give the expected move and was rejected after a squeeze breakout.
🟢 Walking on the band took a rejection with a head fake, indicating strong bearish control here.
Strength ADX: Neutral
Rating: ⭐⭐⭐⭐⭐
Entry Time Frame: H1
Entry TF Structure: Bearish CHoCH
POI: Waiting for mitigation
Decision: Sell limit order with extreme risk (as per my money management strategy).
🚀 Entry: 1.3855
✋ Stop loss: 1.3955
🎯 Take profit: 1.2818
😊 Risk to reward Ratio: 11 RR
🕛 Expected Duration: 45 Days
SUMMARY:
Based on the comprehensive analysis using Smart Money Concepts, a sell limit order at 1.3855 with a stop loss at 1.3955 and a take profit at 1.2818 is recommended. The setup shows strong bearish indications across various parameters, making it a high-probability trade. The expected duration for this trade is 45 days with a risk to reward ratio of 11 RR.
If any one want learn this type of analysis can contact

USDCAD → Trade Analysis | SELL SetupUSDCAD forms a false breakdown of resistance, reached the resistance zone, but was subsequently pushed back down.
We expect a bearish move from the confluence zone.
Hello Traders, here is the full analysis.
I think we can soon see more fall from this range! GOOD LUCK! Great SELL opportunity USDCAD
I still did my best and this is the most likely count for me at the moment.
-------------------
Traders, if you liked this idea or if you have your own opinion about it, write in the comments. I will be glad 🤝

USDCAD Bullish Bias! USD-CAD is trading in an
Uptrend and the pair has
Formed a bullish flag
Pattern so as the pair
Is breaking out we
Are bullish biased
And we will be expecting
A further move up !

USDCAD Pattern FormationAs analysed in the previous post, my stance is the price will continue in the bullish momentum following the formation of a bullish pennant.
I am waiting for the price to break out of this pattern so that we can have a clear entry position.

USDCADPair : USDCAD ( U.S Dollar / Canadian Dollar )
Description :
RSI - Divergence
Completed " 12345 " Impulsive Waves
Break of Structure
Consolidation Phase as an Corrective Pattern in Short Time Frame
Resistance Level

USDCADThe USD/CAD price is expected to move bullish as it follows a symmetrical triangle pattern and Elliott Wave theory. Currently, the price has completed the 4th wave and found support on the trendline. This indicates a potential move to the upside, completing the 5th wave.

USDCADPair : USDCAD ( U.S Dollar / Canadian Dollar )
Description :
Consolidation Phase in Long Time Frame
RSI - Divergence
Break of Structure
Bullish Channel as an Corrective Pattern in Short Time Frame
Resistance Level

Usd Cad Short USd Cad is reaching the levels for a pullback area, shorts can be taken in this area with stops in place

#USDCAD: 550+ Pips Buying Opportunity! Do not miss out! FX:USDCAD
Price has started rebound from the area that we had previously had anticipated. However, we will now wait for price to breakthrough the inducement. The news on Thursday and NFP on Friday will be crucial for future of the pair.
**If you like our ideas, then please like, comment and follow us which will encourage to bring more educational ideas like this**
Team Setupsfx_

USDCAD Rally towards 1.3695We can see a clear price run for the upside in the USDCAD pair after running Sellstops. i am expecting price to reach above the retail resistane above 1.3690 level in the short term.
Entry is around @ current market price @ 1.3650 with a stoploss at 1.3620 with a ultimate of 1.3690+

USDCAD Pair : USDCAD ( U.S Dollar / Canadian Dollar )
Description :
Break of Structure
Head and Shoulder
Bullish Channel as Corrective Pattern in Short Time Frame
RSI - Divergence
Completed " 1234 " Impulsive Waves

USDCAD next MovePair : USDCAD ( U.S Dollar / Canadian Dollar )
Description :
Bullish Channel as an Corrective Pattern in Long Time Frame
Break of Structure
RSI - Divergence
Completed " 12 " Impulsive Waves
Demand Zone

audusd 1h outlook for the dayI got a wadge in this pair but it is trading in the middle of this range now i am waiting to break any of this like I have drawn.....after breaking this line the execution opportunity will come ....keep in mind anything can happen so risk management is the key of profitability

USDCAD Trade IdeaMarket Analysis: USDCAD on the Daily Time Frame
The USDCAD currency pair has exhibited a notable upward trend on the daily time frame. This trend is characterized by a consistent pattern of higher highs and higher lows, indicating bullish momentum. Additionally, there is a clear breakout (BoS) to the upside, further supporting the bullish bias.
As we anticipate a retracement in price, it’s essential to consider the impact of upcoming calendar events throughout the week. These events can introduce volatility and potentially influence the pair’s movement.
Given the technical context, my bias leans strongly toward a bullish entry near the fifty percent Fibonacci retracement level. I recommend placing a wide stop-loss at 1.34400 to allow for market fluctuations. Our target should align with the previous highs as we capitalize on the ongoing bullish trend.
Remember to monitor the economic calendar closely and adjust your strategy accordingly. Happy trading!

USD/CAD could be nearing the end of its retracementA double top formed this month around a 50% retracement level on the daily charts ahead of its latest pullback. And it is interesting to note that the market tends to react around the 50% level.
The double top could actually be part of a 3-wave retracement, and that retracement could be nearing completion.
We saw a strong rally into the January high, hence the bias for an eventual continuation of that move. Bulls could look for a swing low to form around 1.3350 - which is near a high-volume node and another 50% level, and initially target the January highs - a break of which brings 1.36 into focus.

Trade idea: Canadian inflation data tomorrow On Tuesday, February 20, Canada will unveil the latest inflation data. It is anticipated that headline annual inflation will decrease to 3.2%, marking its first deceleration since October 2023, compared to December's figure of 3.4%. Bear in mind, the Bank of Canada's previously indicated that they expected inflation to persist near 3.5% until mid-2024. The forecasts obviously suggest a slight easing.
Various commercial banks offer a range of forecasts too. ING predicts 3.1%, Wells Fargo anticipates 3.2%, National Bank Financial (NBF) estimates 3.3 to 3.4%, CIBC forecasts 3.3%, and Citi expects 3.4%.
On the chart. the USDCAD faces challenges breaching the 1.3500 resistance line, but it currently hovers just above a supply zone and right on the threshold of its bullish trend line.
The next potential targets are in the range of 1.3530 to 1.3550, with December high at 1.3620, just above this.
It's worth noting that both Canada and the US observe bank holidays on Monday, which could lead to reduced trading volumes.

USDCAD Pair : USDCAD ( U.S Dollar / Canadian Dollar )
Description :
Completed " 1234 " Impulsive Waves and Rejection from Daily Demand Zone or Fibonacci Level - 50.0%. Bullish Channel as an Corrective Pattern in Short Time Frame with the Breakout of the Lower Trend Line. Strong Divergence in RSI and Break of Structure
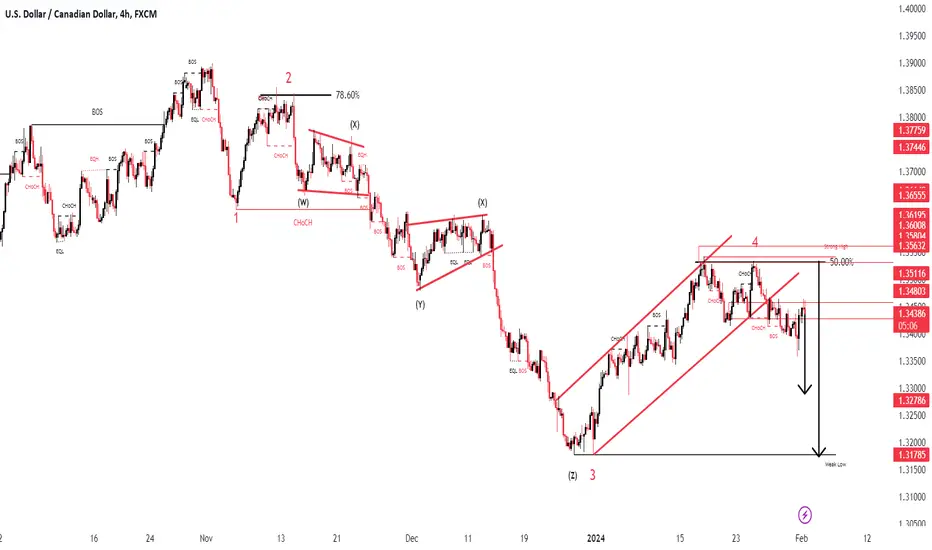
Classic play USDCADI see a tipycal setup on USDCAD. Break of major trendline, retest, divergence on H4 timeframe. I expect a drop of the price till the daily resistance at 1.336. Dollar weakness should confirm the setup

