USDCADfailed to break out of previous low. maybe a continuation of down trend. this will be further validated if price breaks the lower support.
Usdcadidea


USD/CAD - Potential Further Drop After RetracementHello Traders!,
Happy Monday, I hope everone's had an enjoyable weekend, despite the current ongoings with whats happening in USA and other countries
What Is The Markets Telling Us?
We see a massive drop off on US dollar strength, possibly due to widepread protest which will cost the country millions in repair
Upon New York Session opening we can see a retest of resistance @1.3730, followed by a significant drop, MAs are above price
This is a great example to show how fundamentals and technicals co-operate within the market
When Should We Enter?
Will be looking to execute SELLS once price has reached our retracement area
Although, we may see consolidation if there is a insufficient amount of volume, or even price may not reach our retracement area
All in all, before entering for a SELL, it will be ideal to see some sort of consolidation/retracement followed by bearish bias before selling

USDCAD 4HTHE #USDCAD pair which is direcly negatively correlated with oil is expected to go for long in the coming days based on possible non rate change of the CAD which is ecpected tomorrow, thereby recovering from the slump yesterday due to USD data


USDCAD long trade ideaPlan: trendline and resistance level breakout --> wait for the price to bounce off from support level --> wait for the rejection candle pattern to form e.g. bullish engulfing, pinbar, etc --> BUY
**Disclaimer** the content on this analysis is subject to change at any time without notice, and is provided for the sole purpose of assisting traders to make independent investment decisions.
Traders!! if you like my ideas and do take the same trade as I do, please write it in a comment so we can manage the trade together.
_____________________________________________________________________________________________________________________
Thank you for your support ;)
GWBFX


USD/CAD, price action speaks Bearish languageUSD/CAD has recently broken support area. After daily close, this will become new resistance for the price. If the price retests this, we will be looking for shorts with our members.


USD/CAD, expect price to hit bottom of the Symmetrical TriangleUSD/CAD is rejecting resistance Trend so there is a great chance for some bearish price action which can lead the price to the downside.


USDCAD, ready to go long After the complex corrective wave on usdcad, the pair is ready to breakout of this consolidatio and resume an impulse BUY,
The wave 1 and wave 2 of this bulish motive wave has formed, we are anticipating the buy of wave 3( usually the longest).
kindly like ans follow
Thank you

USD/CAD TRADE SHORTUSD / CAD will break its support line and will go to the specified arrow.
FOLLOW ME. STAY INFORMED UNTILL THE ANALYSIS IS DONE.

On his way to the resistance #USDCADA very interesting pattern of support and resistance was created with 3 support points and 3 resistance points, because of our proximity to the support line and the margin we have until reaching the resistance line we recommend buying
The bullish trend supports our model
Target: 1.4120

USDCAD long trade ideaPlan : trendline and resistance level breakout --> wait for the price to bounce off from support level --> wait for the rejection candle pattern to form e.g. bullish engulfing , pinbar, etc --> BUY
**Disclaimer** the content on this analysis is subject to change at any time without notice, and is provided for the sole purpose of assisting traders to make independent investment decisions.
Traders!! if you like my ideas and do take the same trade like i do, please write it in comment so we can manage the trade together.
_____________________________________________________________________________________________________________________
Thank you for your support ;)
GWBFX

USDCAD 4HUSDCAD is expected to retest the lower support of 1.38500 for a possible reversal or alternatively as oil price rise which affects the CAD the pair can plunge downwards

USD/CAD - Break & Retest of Support StructureTrade Suggestion:
Price to continue its downtrend after bounce off trendline resistance level
D1 Timeframe shows price trading within descending triangle and has show bearish bias from touching its resistance
DXY Dollar Index beginning to show some weakness after bullish surge
Technical Analysis
EMA Bearish cross of 10EMA & 50 EMA adds bearish confluence
Broken support has held price before, showing rejection in the past
Price has broken H4 support structure and has retested its level

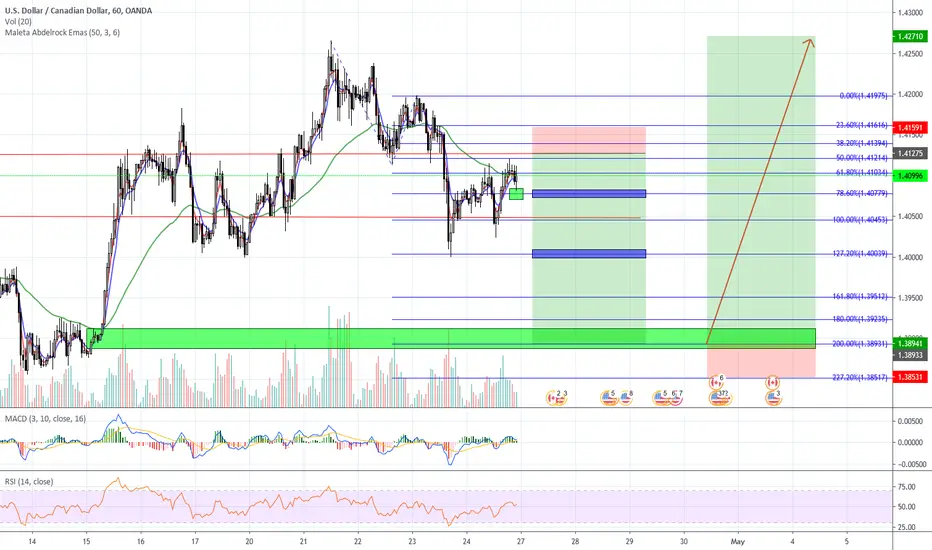
USDCAD: Expect Further Upside Towards 1.4280Hi Traders,
USDCAD will continue with the current bullish momentum until it reaches key resistance at the 1.4280 level. At this point, I'm expecting to see some reversal where price will continue the down trend. At current levels, look to join the current upside momentum only when price pulls back. Otherwise, look for short position from the blue box.
Regards
Wave Theorist

USDCAD UPDATEThis is an update take profit was smashed. Starting next week Monday I will post my analysis with great description so you guys can understand and implement them into your trading. Back test before anything.

USD/CADHI
The USD / CAD has reacted to its support level and will move upwards.
And it's the best time to trade.
HAVE A GOOD DAY.