#USDCAD: 1000+ Pips Big Bullish Move With Three TargetsThe USDCAD is currently in a bearish trend since the day has dropped significantly and is still falling. We anticipate the price to drop slightly more before it reaches our entry zone. There are two entry points, and you can choose either one that aligns with your views. There are three targets, and you can set take profit targets that suit you best.
Good luck and trade safely.
Thanks for your support! 😊
If you want to help us out, here are a few things you can do:
- Like our ideas
- Comment on our ideas
- Share our ideas
Team Setupsfx_
❤️🚀
Usdcadlong

#USDCAD: Two Major Buying Zones, Patience Pays! As previously analysed, USDCAD is expected to decline towards our predetermined entry point. We anticipate a bearish US Dollar for the remainder of the week, which will ultimately lead USDCAD to reach the entry zone. Three distinct target areas exist, collectively worth over 1100 pips. Each entry point, stop loss, and take profit is clearly defined.
We wish you the best of luck and safe trading.
Thank you for your support.
If you wish to assist us, we encourage you to consider the following actions:
- Like our ideas
- Provide comments on our ideas
- Share our ideas
Kind Regards,
Team Setupsfx_
Much Love ❤️🚀

USDCAD BUYBy utilizing Fibonacci retracement levels, historical patterns, , we can formulate a hypothesis that the market might follow a similar trajectory if bullish sentiment prevails.

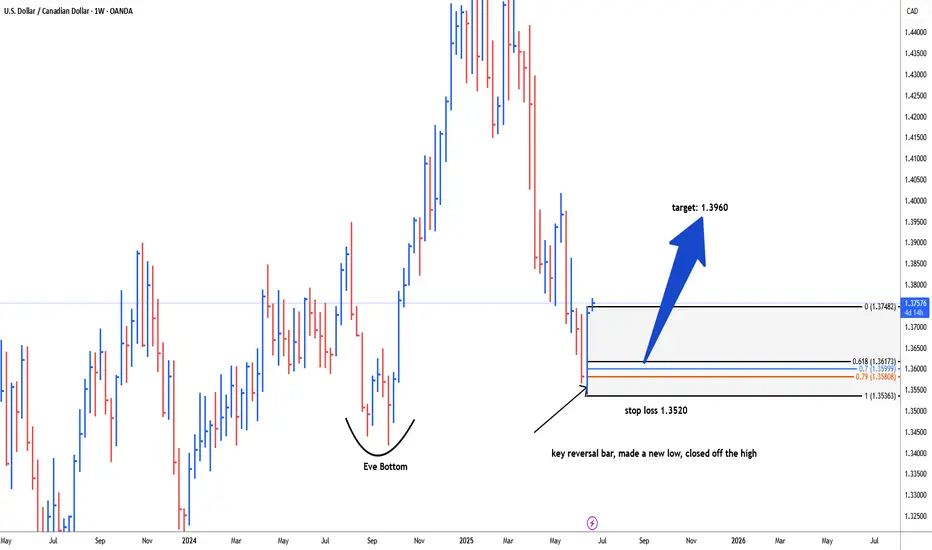
USDCAD possible bullish reversal for 1.3960#usdcad weekly key reversal bar, made a new low, closed off the high, early indication for reversal. It's better to wait for correction 61.8 fib level, 79.0 fib level and 79.0 fib level to reduce/secure drawdwon i.e. 1.3622-1.3585 is the area of interest for long trade. stop loss below key reversal bar i.e. 1.3520. target level: 1.3960
USDCAD LONG SETUPI am expecting the US Dollar to be bullish this week.
Weekly closed as a bullish engulfing.
Expecting price to make a minor pull back on the daily before taking making another bullish push.
Price is also showing a bullish divergence on the daily, which furthers strengthens my perspective.
The 2H TF also illustrates somewhat of a Cup-and-Handle Candle Stick Formation
Will look to enter longs on the lower TFs (1-4h)

USDCAD Analysis – Breaking the Chains, Eyeing 1.38+USDCAD Price broke out from a long descending channel, followed by two bullish continuation flags – classic breakout-retest pattern.
Price is now pushing above 1.3720, aligning with the 38.2% Fib level of the prior drop.
Next upside targets:
🔹 1.3833 (Fib 61.8%)
🔹 1.3913 (Fib 78.6%)
Clear stop level: below 1.3625 (channel breakout support)
Structure Bias: Bullish continuation. Clean breakout + consolidation = probable impulse toward 1.3830/1.39.
📊 Current Bias: Bullish
🔍 Key Fundamentals Driving USDCAD
USD Drivers (Neutral to Bullish):
Fed held rates, dot plot shows only 1 cut in 2025, but Powell's tone leaned dovish.
US Retail Sales + PPI were weak, but safe-haven USD demand persists due to geopolitical risks and equity volatility.
Market reassessing Trump election risk, Fed independence, and inflation stickiness.
CAD Drivers (Bearish):
Oil prices are volatile due to Middle East tensions, but weak demand caps upside.
Canada’s CPI softened, BoC already delivered a dovish cut earlier this month.
CAD under pressure due to dovish BoC outlook and fiscal concerns (gov't budget deficits expanding).
CAD is also suffering from reduced foreign investment flows.
⚠️ Risks to Watch
Oil price spikes (especially if Strait of Hormuz risk escalates) may boost CAD short-term.
A sharp reversal in DXY or Fed commentary shift toward aggressive easing.
Weak US data next week (Core PCE especially) could unwind USD momentum.
🗓️ Upcoming Events to Watch
US Core PCE (June 28) – critical inflation gauge for the Fed
BoC Business Outlook Survey
Oil Inventories + Global energy sentiment
Geopolitical: Israel–Iran updates and Canada’s fiscal signals
🏁 Which Pair Leads the Move?
USDCAD is leading commodity crosses as CAD weakness broadens. Watch USDCAD and GBPCAD for signs of CAD softness before others like AUDCAD/NZDCAD follow.

Will CAD bulls eventually fade away?During the North American session, the USD/CAD exchange rate continued its downward trend and is currently trading above 1.3600, approaching the support zone at 1.3600. If the exchange rate effectively holds the 1.3600 support zone, accompanied by RSI bottom divergence and MACD death cross repair signals, there may be a short-term technical rebound. The initial resistance above is still at 1.3700. If it can break through, it may open up space to 1.3800.
Humans need to breathe, and perfect trading is like breathing—maintaining flexibility without needing to trade every market swing. The secret to profitable trading lies in implementing simple rules: repeating simple tasks consistently and enforcing them strictly over the long term.

USDCAD Hits Support as Fed-Hawkish & BoC Cuts! Big Bounce ComingUSDCAD ( OANDA:USDCAD ) is trading at the Potential Reversal Zone(PRZ) and near the important Support line and Support lines .
In terms of Elliott Wave theory , it seems that USDCAD has managed to complete 5 main down waves and we can expect more up waves .
Also, we can see the Regular Divergence(RD+) between Consecutive Valleys .
I expect USDCAD to rise to at least 1.37860 CAD.
Fundamental View:
The Bank of Canada initiated its rate-cutting cycle , while the Federal Reserve remains firm with no immediate plans to ease.
Strong NFP data on Friday reinforced USD ( TVC:DXY ) strength .
Oil prices( BLACKBULL:BRENT ) may offer temporary support to CAD , but macro divergences clearly favor the dollar .
Note: Stop Loss(SL)= 1.36110 CAD
U.S Dollar/Canadian Dollar Analyze (USDCAD), 4-hour time frame.
Be sure to follow the updated ideas.
Do not forget to put a Stop loss for your positions (For every position you want to open).
Please follow your strategy; this is just my idea, and I will gladly see your ideas in this post.
Please do not forget the ✅' like '✅ button 🙏😊 & Share it with your friends; thanks, and Trade safe.

THE USD CAD PAIR USD/CAD 1H Chart – Busy with Levels but the Bias is Clear 📊✨
Multiple confluences pointing to bullish intent: trendline support, key demand zones, and clean higher lows. Despite the clutter, price is respecting structure. Watching for a clean break above recent highs to ride the buy-side liquidity sweep. Eyes on 1.38+ 📈
#ForexTrading #USDCAD #SmartMoney #TechnicalAnalysis"

Can 1.3633 Construct a Bottom?The USD/CAD exchange rate continues to maintain a (sideways) pattern, currently trading around 1.37. Although the US dollar is fundamentally supported by the boost from the US non-farm payroll data and the optimistic expectations of trade negotiations in major economies, the overall market sentiment remains cautious. The Canadian dollar is supported by the strengthening of crude oil prices, and the exchange rate trend presents a complex pattern of mixed long and short positions. In the short term, if the exchange rate can effectively break through 1.3800 and stabilize above this level, it will open up further upward space. The next targets may point to the middle track of Bollinger Bands at 1.3823 and the previous platform resistance area at 1.3900. However, if it is blocked again at the 1.3800 line and falls back, it will increase the market expectation of "making a new low after a technical rebound". At that time, the supports will focus on 1.3640 and the low point of 1.3633. If the latter is broken, it will open up the downward space to 1.3600 or even 1.3550.
Humans need to breathe, and perfect trading is like breathing—maintaining flexibility without needing to trade every market swing. The secret to profitable trading lies in implementing simple rules: repeating simple tasks consistently and enforcing them strictly over the long term.

USD/CAD - Channel Breakout (10.06.2025)The USD/CAD pair on the M30 timeframe presents a Potential Buying Opportunity due to a recent Formation of a Channel Breakout Pattern. This suggests a shift in momentum towards the upside and a higher likelihood of further advances in the coming hours.
Possible Long Trade:
Entry: Consider Entering A Long Position around Trendline Of The Pattern.
Target Levels:
1st Resistance – 1.3757
2nd Resistance – 1.3792
🎁 Please hit the like button and
🎁 Leave a comment to support for My Post !
Your likes and comments are incredibly motivating and will encourage me to share more analysis with you.
Best Regards, KABHI_TA_TRADING
Thank you.
Disclosure: I am part of Trade Nation's Influencer program and receive a monthly fee for using their TradingView charts in my analysis.

USDCAD WILL DELIVER BY FIREThe USD/CAD trended lower in a volatile manner this week, declining 0.29% on a weekly basis, reflecting the relative resilience of the Canadian dollar supported by the Bank of Canada's (BoC) policy and economic data. The BoC maintained its interest rate at 2.75%, in line with market expectations. The BoC's concerns about Trump's tariff policies mirror the widespread anxieties among global central banks regarding the impact of trade wars. The central bank is likely to remain on hold in the short term to observe the effects of trade policies. If employment data turns out to be robust, the Canadian dollar may gain further support.
Humans need to breathe, and perfect trading is like breathing—maintaining flexibility without needing to trade every market swing. The secret to profitable trading lies in implementing simple rules: repeating simple tasks consistently and enforcing them strictly over the long term.

#USDCAD: 500+ Pips Big Buy Opportunity!Dear Traders
Hope you are doing great, we have a great buying opportunity on USDCAD, our first entry is in profit of 250+ pips, however, we expect price to grow steadily after reconfirming the same area. USDCAD tends to reconfirm the order block area many times before a big bull move. Good luck.

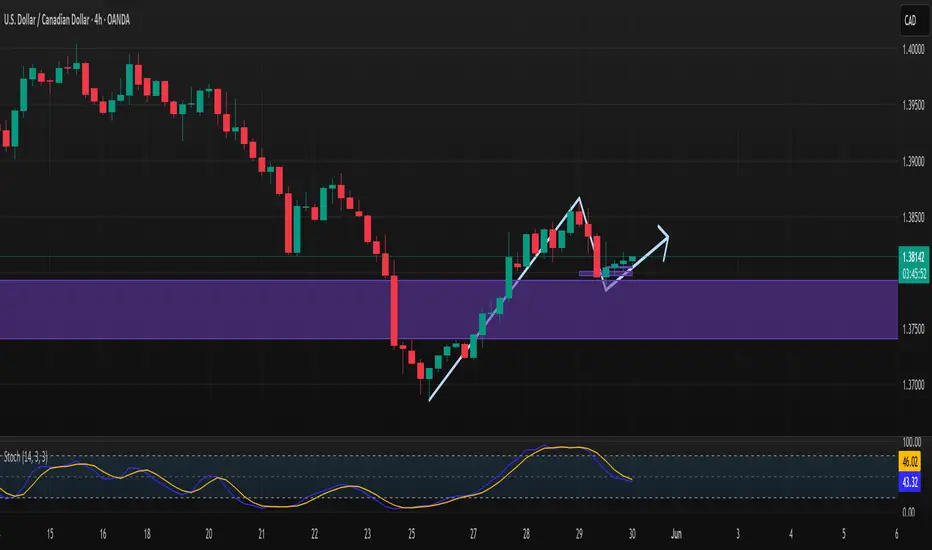
USDCAD Rebound from Key Support – Bullish Setup in PlayUSDCAD pair has reached a technical inflection point at key support around 1.3700, where it is attempting a rebound after several days of bearish momentum. With recent Canadian data showing underlying economic strain and the U.S. dollar reacting to rate expectations and tariff news, this area becomes crucial for the next directional move.
🔍 Technical Analysis
Support Level: Price has respected the horizontal support at 1.3700–1.3685, forming a possible double-bottom structure on the 4H chart.
Bullish Reversal Zone: The latest candle shows a strong rejection wick at the support zone, suggesting bullish interest. The structure aligns with a classic bullish reversal pattern.
Target Zones:
First TP: 1.3849 (previous high / supply zone).
Second TP: 1.3860–1.3870 (Fibonacci extension + minor resistance).
Invalidation (SL): Below 1.3685, further downside may open to 1.3632.
🧠 Fundamental Context
U.S. Side:
GDP and NFP data have recently come out mixed, reducing the immediate pressure on the Fed to hike rates further.
Tariff uncertainty and appeal plans by the Trump administration are increasing near-term USD volatility.
US bond yields are firming again, giving the dollar mild support.
Canada Side:
Canadian Q1 GDP disappointed at 0.1%, lower than expected.
BoC is likely to hold rates steady, but the economy shows weak business investment and softening consumption growth.
Crude oil, Canada’s key export, is still under pressure, slightly weakening CAD.
✅ Conclusion
This setup favors a short-term long on USDCAD from current levels, targeting the upper resistance zone at 1.3849–1.3860. A break and close above 1.3870 could extend toward 1.3900. However, caution should be exercised with upcoming U.S. labor and trade data that may fuel volatility.

USDCAD Price Rebounding from Key Support as CAD WeakensUSDCAD is showing signs of a potential reversal from key support around the 1.3700–1.3685 zone. The pair had been declining steadily but recent weakness in the Canadian Dollar — driven by soft economic data and oil market uncertainty — is starting to shift momentum back in favor of the U.S. Dollar. As long as support holds, there is room for a bullish continuation toward 1.3860 or higher in the near term.
Technical Analysis (4H Chart)
Trend Structure: After a strong impulsive drop earlier in May, USDCAD formed a rounded bottom near 1.3685, followed by a corrective bounce. The recent retracement toward the support area is forming a potential higher low setup.
Support Zone:
Primary Support: 1.3700–1.3685
This is a clean structure zone and previous demand level. Price tested this area on May 24–25 and rebounded sharply.
Resistance Zone:
Short-Term Target: 1.3849–1.3860
This is the next major horizontal resistance, and aligns with previous price congestion before the latest decline.
Price Projection:
The chart suggests a bullish wave may develop from the support zone, targeting the 1.3860 level. If broken, a further move toward 1.3920 (May swing high) is possible.
Invalidation Level:
A daily close below 1.3680 would negate the bullish bias and signal a deeper correction or trend continuation lower.
Fundamental Analysis
U.S. Dollar (USD) Drivers:
Q1 GDP second estimate shows steady but modest growth.
Consumer Confidence fell recently, capping upside for the USD short term.
The Fed remains cautious, signaling that inflation risks persist — keeping interest rates elevated, which supports USD.
U.S. Treasury yields have been stable to slightly higher, also helping support the dollar.
Canadian Dollar (CAD) Drivers:
Canada's balance of payments posted a larger-than-expected deficit in Q1 — a negative for CAD.
Oil prices, which heavily influence CAD, have been under pressure from global demand uncertainty.
Domestic demand is softening: flat retail sales and weak trade balance data reduce CAD appeal.
Bank of Canada is showing signs of policy caution, especially as inflation slows faster than in the U.S.
Conclusion
Outlook: Short-term bullish
USDCAD is likely to bounce from the 1.3700–1.3685 zone and retest 1.3849–1.3860 if CAD weakness continues.
Trade Plan (if trading):
Buy Zone: 1.3700–1.3685
Target: 1.3860
Stop Loss: Below 1.3680 (structure break)
The pair is fundamentally supported by CAD weakness and technically primed for a rebound — but confirmation from price action near support is critical.

Cautious Bulls Meet Trendline Test: USD/CAD Eyes FOMC CatalystCMCMARKETS:USDCAD OANDA:USDCAD USD/CAD extended its recovery for the third day, trading near 1.3833 on modest USD strength following upbeat U.S. data. However, fiscal worries and expectations of Fed rate cuts in 2025 may limit upside momentum. Traders are cautious ahead of the FOMC Minutes and U.S. PCE/GDP data, while firmer Canadian inflation and oil prices could support the CAD.
Technically, the pair remains within a broad downward channel and is now approaching key resistance at 1.3856, aligned with the descending trendline. A clear rejection here could spark a bearish continuation toward 1.3711 support. A breakout above 1.3937 would invalidate the bearish channel and suggest trend reversal.
Resistance : 1.3856 , 1.3937
Support : 1.3711 , 1.3809

USDCAD - Following the market looks like we could be going longFollowing the market looks like we could be going long for a bit.
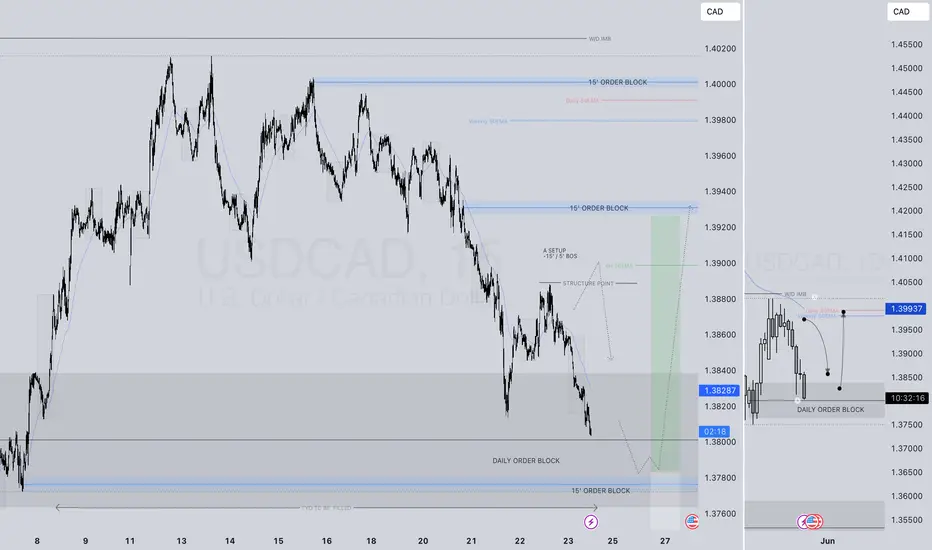
PERHAPS... USDCAD LONG FORECAST Q2 W21 D23 Y25PERHAPS... A REVERSAL BACK TO THE HTF 50EMA's
USDCAD LONG FORECAST Q2 W21 D23 Y25
Professional Risk Managers👋
Welcome back to another FRGNT chart update📈
Diving into some Forex setups using predominantly higher time frame order blocks alongside confirmation breaks of structure.
Let’s see what price action is telling us today!
💡Here are some trade confluences📝
✅Daily Order Block
✅Tokyo ranges to be filled
✅15' order block identified
✅Weekly 50 EMA
✅Daily 50 EMA
🔑 Remember, to participate in trading comes always with a degree of risk, therefore as professional risk managers it remains vital that we stick to our risk management plan as well as our trading strategies.
📈The rest, we leave to the balance of probabilities.
💡Fail to plan. Plan to fail.
🏆It has always been that simple.
❤️Good luck with your trading journey, I shall see you at the very top.
🎯Trade consistent, FRGNT X
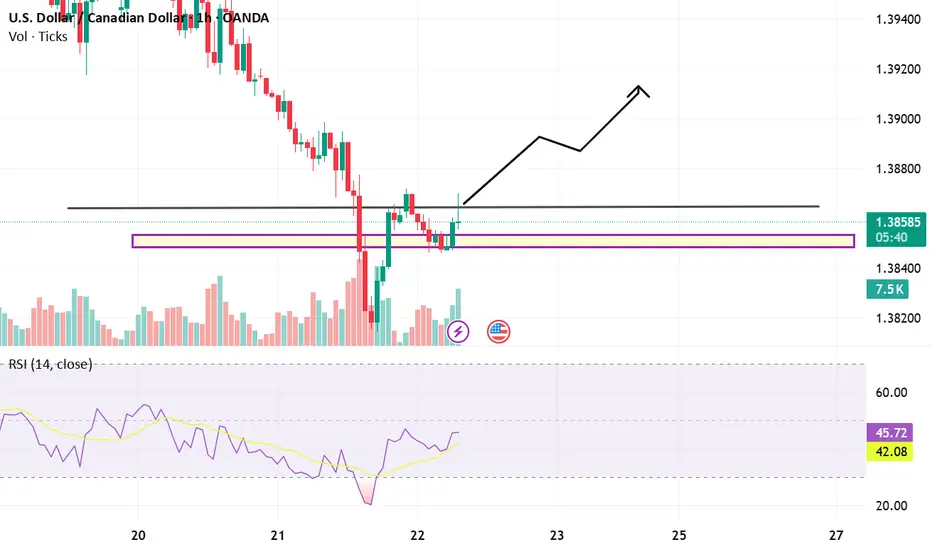
USDCAD TechnicalsThe pair attempting a recovery following a sharp bearish decline. After a significant selloff, price found strong support in the 1.38300–1.38440 zone, where multiple rejections indicate the presence of demand. This area has now acted as a base for a bullish reaction, confirmed by increasing bullish volume on the most recent candles.
The recovery is now pushing back toward a previously broken structure zone around 1.38770–1.38800, which is expected to act as resistance. This is a critical level to watch, as it previously marked a breakdown point. If price manages to push above and hold, it could signal a reversal or at least a corrective rally within the broader downtrend.
Momentum indicators are showing early signs of recovery. The RSI has climbed to around 46, rebounding from a low and crossing its moving average. While it remains below the neutral 50 level—still slightly favoring sellers—the upward momentum is strengthening. This supports the current short-term bullish movement, especially if price remains above the 1.3840 handle.
The short-term trend is shifting toward bullish, supported by a potential higher low structure forming after the recent dip. A clean break and hold above 1.3880 could open the door for a move toward the psychological round number at 1.3900 and potentially higher toward 1.3920–1.3940.
However, if the price fails to hold above 1.3840 and breaks back into the support box with bearish volume, the recovery thesis would be invalidated, suggesting a potential revisit of the 1.3820 level and lower.
In summary, the chart suggests a cautious bullish bias with near-term upside potential, contingent on maintaining support above the demand zone and breaking through the resistance around 1.3880 with momentum.
USDCAD Consolidation Within Bullish Flag – Targets 1.4130USDCAD is consolidating inside a descending flag structure following a strong impulsive rally earlier in May. The current pullback is orderly and corrective, indicating potential for continuation higher. If price breaks above 1.3960, this flag breakout could extend toward 1.4130 and possibly 1.4225. With CAD weakening on soft oil prices and USD regaining strength from yield-driven flows, the bias remains bullish while price stays above 1.3870.
🔍 Technical Analysis
Pattern: Bullish flag forming after a strong rally
Support Zone: 1.3870–1.3900 → base of flag
Resistance/Breakout Zone: 1.3960–1.3980 → upper flag line
Structure:
Higher lows holding firm
Fib confluence near 1.3933 (23.6% retracement)
Target Levels:
1.4130 – 50% fib level + previous structure resistance
1.4225 – 61.8% fib zone from March–April high
📈 Bias: Bullish continuation on breakout
🌍 Fundamental Context
🇺🇸 U.S. Dollar (USD)
Supported by:
Higher bond yields
Fed expected to hold rates higher for longer
Safe-haven inflows post-Moody’s downgrade fading
USD Index recovering broadly across majors
🇨🇦 Canadian Dollar (CAD)
Oil prices softening due to global demand concerns (China slowdown, US inventories)
BoC likely done hiking — no fresh bullish catalysts
CAD correlation with crude oil adds downside risk if energy markets weaken further
🎯 Trade Plan
Entry: Break and close above 1.3960
Stop Loss: Below 1.3870 (flag support zone)
Targets:
TP1: 1.4130 (structure resistance + fib level)
TP2: 1.4225 (swing high + golden ratio)
⚠️ Risk Factors to Watch
If USD sentiment shifts (e.g., dovish Fed speaker) → breakout may fail
Crude oil rebound would support CAD and cap USD/CAD upside
False breakouts common near 1.3960 — wait for confirmation (strong candle close)
🧭 Conclusion
USD/CAD remains in a bullish consolidation phase with a clear continuation setup. A break above 1.3960 would confirm a flag breakout targeting 1.4130 and 1.4225. With the macro backdrop favoring the USD and energy-linked CAD weakening, this setup offers clean structure and potential for follow-through.

USDCAD Is Bullish! Long!The USD/CAD exchange rate consolidated near 1.3980 during the European trading session, after the Canadian dollar (CAD) came under pressure due to falling crude oil prices, enabling the pair to recover earlier losses. Given that Canada is the largest crude oil exporter to the U.S., declining oil prices typically dampen CAD sentiment.
USD/CAD is displaying a complex technical trend. On the daily chart, the price is currently consolidating around the 1.3980 level. The pair has rebounded from a recent low of 1.3749 and is now attempting to break through the key psychological barrier of 1.4000. If it can surpass both the 1.4000 psychological level and the 1.4050 resistance, further upside toward 1.4150 could be possible. On the downside, key support lies at 1.3890 (the lower edge of the recent consolidation range) and 1.3749 (the recent low).
you are currently struggling with losses, or are unsure which of the numerous trading strategies to follow, at this moment, you can choose to observe the operations within our channel.

USDCAD Analysis⚠️ Market shift alert!
Due to the new trade agreements with China, the USD may strengthen 💪
Our previous short idea from this level was invalidated as price broke without a signal ❌
Now we’re waiting for a pullback to go long from the new support zone 📈
For detailed entry points, trade management, and high-probability setups, follow the channel:
ForexCSP

USDCAD Analysis: Three Bounce ScenariosHello traders!
USDCAD is offering three trading scenarios on the daily timeframe.
The first scenario suggests the pair may react bullishly from the currently approached zone, setting up a bounce opportunity that could drive price higher toward the 1.41600 area.
The second scenario anticipates a bounce toward the 1.37586 region, where a mean reversion setup may come into play (if buyers step in and price action confirms bullish intent near that support).
The third scenario anticipates a bounce toward the 1.34150 region, where a mean reversion setup may come into play (if buyers step in and price action confirms bullish intent near that support).
Discretionary Trading: Where Experience Becomes the Edge
Discretionary trading is all about making decisions based on what you see, what you feel, and what you've learned through experience. Unlike systematic strategies that rely on fixed rules or algorithms, discretionary traders use their judgment to read the market in real time. It's a skill that can't be rushed, because it's built on screen time, pattern recognition, and the ability to stay calm under pressure.
There's no shortcut here. You need to see enough market conditions, wins, and losses to build that intuition—the kind that tells you when to pull the trigger or sit on your hands. Charts might look the same, but context changes everything, and that's something only experience can teach you.
At the end of the day, discretionary trading is an art, refined over time, sharpened through mistakes, and driven by instinct. It's not for everyone, but for those who've put in the work, it can be a powerful way to trade.
