USDCAD ANALYSIS 22 - 26 FEBANALYSIS
==========
DAILY - STRONG BEARISH MOMENTUM
4HR - BEARISH
PLAN OF ACTION
================
SHORT TERM BUYS THEN LONG TERM SELLS
IM EXPECTING PRICE TO COME RETEST 50% OR 61.8% FIB RETRACEMENT LEVEL ON 4HR THEN WE TAKE SELLS IN LINE WITH THE HIGHER TIME FRAME INDICATION
SELLS:
ENTRY @ FIB GOLDEN RATIOS
EXIT @ UPON SIGNS OF EXHAUSTION
SL ABOVE THE FIB RETRACEMENT ZONES
Usdcadprediction

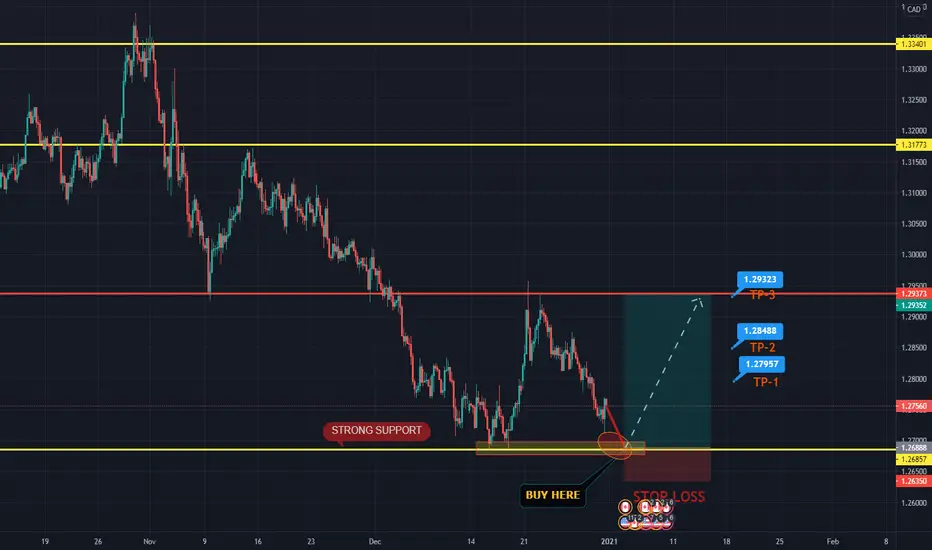
USDCAD BUY FROM KEY ZONEThis pair had successful achieve out TP2 in previous analysis now trading near @ minor support
so we are expecting this pair will retest the support zone and then we will buy on dips
Friends push like and comments Follow us for more updates

USDCAD: Ending Diagonal PatternIn some cases, we cannot detect the main trend clearly. But there are patterns that are helpful, they temporarily show the trend. One of these patterns is Diagonal.
As you can see in the image, the Diagonal pattern is formed and we are waiting for the price to increase to the range of 1. 3411. To get the confirmation for the uptrend, the price should cross the range of 1.2835.
In addition, convergence is evident in RSI. This analysis will be violated by crossing the price from the range of 1.2588.

USDCAD BUYING FROM SUPPORT ON DIPSAS I can see this pair is going to test again daily support
& now will not going to skip this entry level and going to buy USDCAD ON DIPS if price show us it hold above the buying area
Friends support us and help all of other via shearing ur ideas
Follow us for more updates and stay tuned
USDCAD SELL FOR 300+ PIPS !!!As i can see this pair is still in bearish trend CAD is all depending on oil prices
and oil still have to touch 50$ soon incoming days this pair retested a strong resistance and fail to break
so it is going to make a new low till design levels based on daily chart so
now we are selling this pair with low risk and looking for higher rewards
friends push like and subscribe to stay updated with new analysis

USDCAD BUYING FROM SUPPORT ON DIPAS we can see this pair has reached at strong support so buying on dips
with a small risk and looking for higher rewards
friends push likes if u like my idea
i love and appropriate ur likes
follow us for more updates

USDCAD - Probability of the formation of Expanding DiagonalUSDCAD - Probability of the formation of Expanding Diagonal Pattern
Wave 3 has ended in the range of 1.4689 and the movement structure up to the range of 1.4667 has been in the form of 3 waves, which indicates the corrective movement. Given that the X wave has ended in the range of 1.4667, it is possible that we will encounter the FLAT pattern in the 4th wave.
In the downtrend, which started from the range of 1.4667 and should be in the form of 5 waves, according to the FLAT pattern, the movement structure is in the form of 3 waves, which can represent the Expanded Diagonal pattern. Which can prolong up to the range of 1.2039.

USDCAD BUYING FROM SUPPORT ON DIP 300+ pips !!!USDCAD is trading near a support zone as i can see this pair is waiting for a strong move in US Index and then it will start moving to our targets
CAD economy is depending on oil prices as we can see US-Oil and Brent had move making new high and now its is expecting a retrace so we are buying this pair from support zone
and looking for a higher rewards against our lower risk
friends push like and comments
follow us for more updates for new ideas

USDCAD-UpdateUSDCAD
We still believe in the Expanded Flat pattern. This analysis is violated if the price exceeds the range of 1.2928.

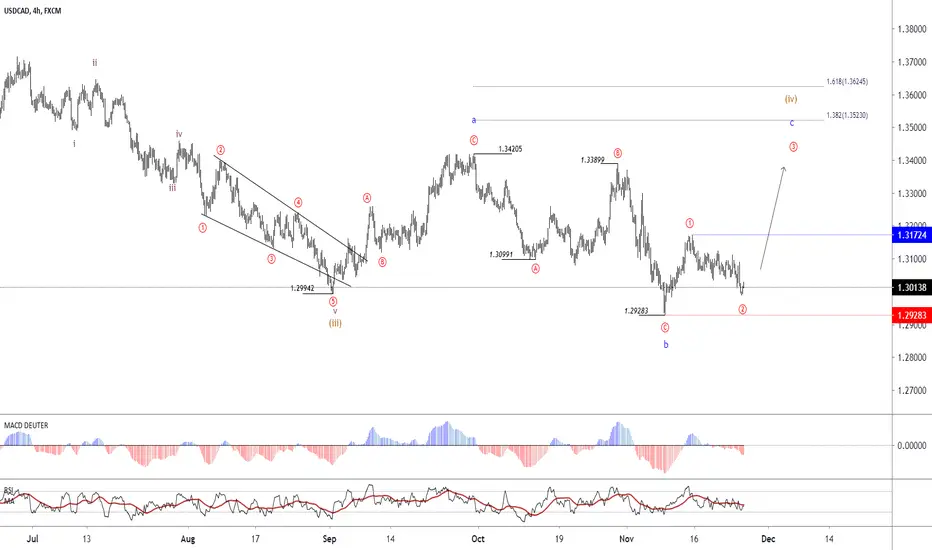
USDCAD - Probable Expanded Flat Pattern formation in Wave IVThe structure of the downtrend which has been started from the range of 1.3420, has finished in the range of 1.2928 which is in the form of 3 waves. Given this trend, we will probably have a 5-wave uptrend in C-wave, which could be extended up to the target of 1.3523.
If the price crosses the range of 1.2928, this analysis will be violated. In case the price crosses the range of 1.3172, we can expect an uptrend forming hopefully.
USDCAD BUYING FROM SUPPORT ON DIP !!! 15MIN TFAs we see that usdcad has reached @ strong support
we are buying this pair for 60+ pips on smaller TF with a small risk and higher rewards
guys support us to get always updated with our ideas follow us and
Push like it will a grateful thanks for us

USDCAD BUY AFTER BREAKOUT CONFIRMATION !!!!as we see a bullish trend on this pair already performing great buy from this monthly horizontal support area
we are waiting for a bulls breakout and enter to buying USDCAD for higher rewards with low risk
we appreciate your likes and comments feel free to ask your questions and suggestion in comments
Follow us for more updated trades alerts !!!!


USDCAD IS BUYING FROM A STRONG KEY LEVEL As we see USDCAD has reached @ strong Support area
we plane to enter BUY this pair for more big profits with a low risk
guys if u like our idea push like and support us
we appreciate ur likes and comments for more
follow us for more updates

USDCAD, SELL on H4- A potential FULL Flag formation
- if close above the channel high, confirms the breakout the bull flag
- if close below the short ascending channel, might expose 1.3750

USCAD: Are the buyers coming inthe daily time frame has built a falling wedge.
are we expecting a reversal or a breakdown.
keep an eye on the pair.
do not miss out


USDCAD Bearish Deep Crab Pattern Entry is at 161.8 of XA
Targets 38.2 and 61.8
Stops in this pattern for me are RR based, 1:2 , use your own method of trading
Note:
We were long since that blue Shark Pattern before that spike, which I posted in here for free on Oct 19.
Very good trade.
Drop a like if you enjoy my charts!

USDCAD- A very short term IdeaHi for those whoa re looking for short in USDCAD can take the trade right now. It just broke the trend line and after retesting the same zone expectations are for to go down this time thanks

USDCAD CORRECTIVE BUY SETUPHi Every one,
USD.CAD chart we can clearly see ABC corrective structure. On intraday basis we can expect further downside upto 1.2940 level. This level act as possible wave reversal level for this corrective structure.
reversal date 27 / 01 / 2017

USDCAD SETUP !Hello Traders ! I am back .. Merry Christmas, Sorry I know I am late but too much busy with some issues. here is the Setup of USDCAD , As I am expecting the down move becuase price traps between weekly channel. Take a short position now thanks
