$USDCAD TRADE SELL SETUPThe trade is clearly in a pullback.
I would expect the market to hit the top and reverse
Usdcadsell

USDCAD ! NICE SETUPrather it gets a pull back or just a breakout due to the double bottom im seeing some upside b4 any possible down move and it could postenially push towards that strong high

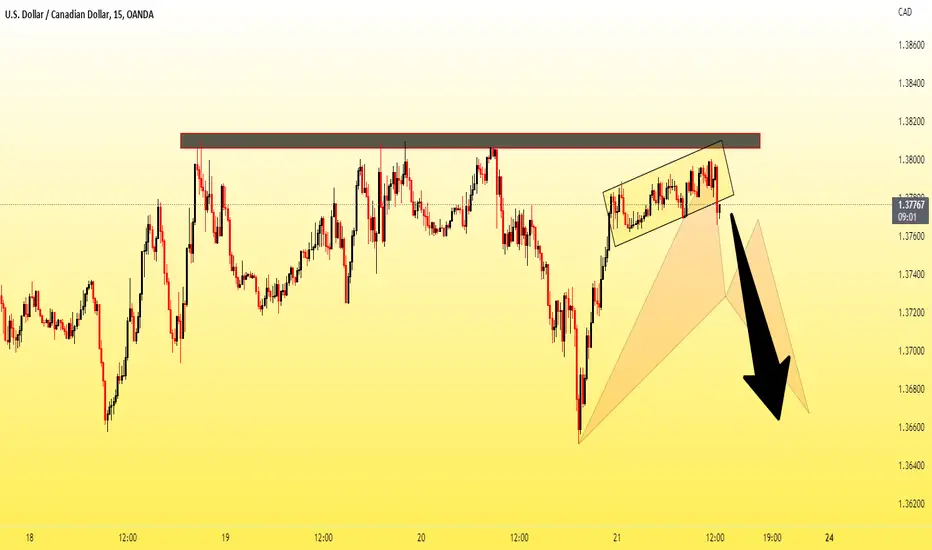
USDCAD first SELL area 4 next leg down Looking at that continuation down as explained last week.. Price at the moment is creating at resistance area with price slowing down and rejecting. Price can push a little higher so I may just wait for the initial drop on the 1hr and then look for a small right shoulder..

USDCAD SELL !!!!!!!!!Price still makes consolidation and will be a continuation or it will bounce up. If you wanna follow me to take a trade, make sure your money management rule your trade

USDCAD H1Hi traders, USDCAD is setting up for a downside move i am expecting from price to go our mentioned pattern completion area and looking price action on the top for a short position opportunity.
Trade with your own according strategy GOOD LUCK.

USDCAD - Short from bearish orderblock ✅Hello traders!
‼️ This is my analysis on USDCAD.
Here we are bearish from H4 timeframe perspective, so I am looking for shorts. I expect price to continue the retracement to fill the imbalance and reject from bearish orderblock + institutional big figure 1.37000.
Like, comment and subscribe to be in touch with my content!

USDCAD new possible situations! Still holding that long term short bias but am also open to getting another possible buy position.. trading for me is just entering at the most likely areas price moves from and then take what comes off that..

USDCAD FINALLY PUSHING DOWN FROM 1.38!Hey guys, hopefully some of you may have got entry's on this one, I think I've covered it at lest 10 times ahah, if your not in a position look for a retracement and the next leg.. simple market structure!!

USDCAD top-down analysisHello traders, this is a complete multiple timeframe analysis of this pair. We see could find significant trading opportunities as per analysis upon price action confirmation we may take this trade. Smash the like button if you find value in this analysis and drop a comment if you have any questions or let me know which pair to cover in my next analysis.

USDCAD Idea H1Here is my view for USDCAD on H1. The price could go down, you can put a pending order on the Order block or find an entry on LTF within OB Zone. Trade Safe!

Will USDCAD be my best trade in 2022? Hi Traders,
This is my view for this week on USDCAD, thanks to Richard Wyckoff ;-)
I remind you that this is only a forecast based on what current data are.
Therefore the following signal will be activated only if specific rules are strictly respected.
I really hope you liked this content and I would like to know what do you think about this analysis, so please use the comment section below to give me your point of view.
Pit
DISCLAIMER:
Trading activity is very dangerous. All the contents, suggestions, strategies, videos, images, trade setups and forecast, everything you see on this website and are the result of my personal evaluations and was created for educational purposes only and not as an incentive to invest. Do not consider them as financial advice.
———————————

USDCAD SHORTS OFF THE RIGHT SHOULDER!Sorry for the background noise... I'm watching to see a bit more rejection and the next possible leg down to continue a bit of weakness.. for now anyway!

USDCAD top-down analysisHello traders, this is a complete multiple timeframe analysis of this pair. We see could find significant trading opportunities as per analysis upon price action confirmation we may take this trade. Smash the like button if you find value in this analysis and drop a comment if you have any questions or let me know which pair to cover in my next analysis.

USDCAD POSSIBLE BEAR MOVEMENTUptrend wedge formed on the 1hr TF
Major Zone right 1.36411, also price is sitting right on the support trendline.
Breakout from the zone and the trendline as confluence will ignite the possible bear movement.
Also another entry level is right at 1.34993 once price break the zone and retest.

USDCADHi traders, USDCAD is setting up for a downside move i am expecting from price to hold the top and looking price action for a short position opportunity.
Trade with your according strategy do not depend on my analysis GOOD LUCK.
USDCAD waiting for downside Momentum Still just watching and waiting for a better direction as hopefully 1.38 resistance can hold strong and create a short entry once again... End of the week approaching so I wont be entering unless we get some more momentum shifting to the downside..

USDCADHi traders, i am currently in short position, i am expecting from price to continue and go hit our bottom mentioned area but if price go back and hit our upper mentioned area then i will be looking price action on the top for the next short position opportunity.
Trade with your according strategy do not depend on my analysis, this analysis is just a scenario and i would love to be wrong GOOD LUCK.

USDCAD eyeing the shorts from 1.38 still!Still waiting for price to provide the best entry on this possible sell off move I'm looking out for on USDCAD. Never forget the overall direction and trading against that can be risky and tricky but can pay off if you play it smart! Good luck everyone

USDCADHi traders, USDCAD is setting up for a downside move watch sharp breakdown to the downside and look for a short. If price did not give us a sharp breakdown then watch price to come around our upper mentioned area and look on the top for a short position opportunity GOOD LUCK.

USDCAD is 1.38 going to be the reversal level!?! HUGE DOWNSIDEHave been watching very carefully around this resistance of 1.38 on USDCAD to see how price reacts. We have now had multiple rejections and another (FAKE?) push through followed by price quickly selling back off... we sometimes see these fake moves (breaking through levels) to catch the early sellers before the big moves happen... is this the situation with USDCAD?? I believe we have some downside coming, so like I explained I've got my eyes on a zone where if price fails it once more ill be opening a short for potentially a big move to the downside.

Update On USDCAD Idea SELL Trade Triggered......Just a quick update on yesterday's trade idea just were I had identified the 1.40 zone as a good area to look for a SELL setup we got a HUGE spike up towards that area during the US session yesterday often spikes like this into High timeframe levels will give great opportunities to enter a position and that's exactly what we did currently up over 200 pips :)
read the related post to see why this was a great setup

Looking To SELL USDCAD Around 1.40 or Above...USDCAD is fast approaching the 1.40 level which is the start of a huge Monthly SUPPLY/SELL zone that is around 700 pips in range so to find a good R/R trade we need to zoom into the weekly charts to see if there is any areas there for possible setups.
As you can see marked on the charts there is a nice Weekly SUPPLY/SELL zone starting at 1.40 this is where price actually broke down heavy from in 2020 it's also a tight zone so will provide an excellent R/R trade if the correct signal happens here.
I will be looking for a signal on my FX Reversal King indicator on approach to 1.40 on timeframes from the 6hr to Daily, the first easy target if this trade triggers is the last high in the previous trend that was just taken out at 1.34 it can drop a little lower to 1.32 .

USD/CAD :: Below the trend line .USD/CAD :::
The trend line (yellow line) has just been broken, which means that the continuation of the path will be below this line, but it is still possible to return to this line, and after that the fall is confirmed.
